Nursing Home

A Grace Subacute & Skilled Care

Nursing Home

A Grace Subacute & Skilled Care

1250 S Winchester Blvd, San Jose, CA 95128 View map
Overview of A Grace Subacute & Skilled Care

A Grace Sub Acute and Skilled Care is nestled in a homey neighborhood on Winchester Boulevard that exudes diversity and positive energy. This facility is constantly improving and growing to meet the highest standards of healthcare. Currently, they provide around-the-clock ventilator and tracheostomy services, as well as a comprehensive range of rehabilitation, dietary, and physician services. Their team is very dedicated to ensuring that their residents receive the best care possible and achieve optimum recovery through the most effective methods.
Seniors can also enjoy a variety of fun activities that keep them engaged and entertained. They can participate in morning exercises, arts and crafts, parties, and even visit the salon and barber for some pampering. The smiles on their faces are a testament to the warm and welcoming environment that the facility provides. If you’re looking for a place that truly cares about its residents and offers top-notch healthcare services, look no further than A Grace Sub Acute and Skilled Care.

(408) 241-3844

Quality ratings

Measured by Centers for Medicare & Medicaid Services (CMS)

Overall rating Info Official CMS rating based on health inspections, staffing and quality measures.
4/5
California average: 3.6/5
Health Inspection Info Official CMS rating based on deficiencies found during state health inspections.
3/5
California average: 3.2/5
Staffing Info Official CMS rating based on nurse staffing hours per resident per day.
4/5
California average: 3.5/5
Quality Measures Info Official CMS rating based on clinical outcomes for residents.
5/5
California average: 4.3/5

Nursing care per resident

Info Average daily nursing hours per resident (adjusted for acuity). Higher values indicate more nursing time per resident.
3h 24m per day

This home provides 22% less nursing time per resident than the California average.

California average: 4h 23m per day

Staffing hours breakdown

Info Hours of care per resident per day, broken down by staff type. Data from CMS Medicare.
Staff type Facility State avg National avg
Registered Nurse (RN) Info Registered nurse hours per resident per day. 1h 8m per day 39m per day 41m per day
Nurse Aide Info Nurse aide hours per resident per day. 2h 50m per day 2h 39m per day 2h 21m per day
Total Nursing (Weekend) Info Total number of nurse staff hours per resident per day on weekends. 5h 25m per day 4h 5m per day 3h 26m per day
Physical Therapist Info Physical therapist staff hours per resident per day. 3m per day 5m per day 4m per day
RN (Weekend) Info Registered nurse hours per resident per day on weekends. 57m per day 30m per day 29m per day

Capacity and availability

Medium-capacity home

Offers a balance of services and community atmosphere.

Total beds 166

This home usually has availability

Lower occupancy suggests more openings may be available.

Lower demand than the California average
Occupancy rate 66.6%
Residents per day (avg) 102
Occupancy rate
66.6%
Residents per day (avg)
102

Who this home usually serves

TYPE OF STAY

Primarily short stays

Residents typically stay for brief periods, with frequent admissions and discharges throughout the year.

Might be optimal for
Post-acute recovery Temporary care Transitional stays

Breakdown by payment type

Medicare

22% of new residents, usually for short-term rehab.

Typical stay 1 - 2 months

Private pay

78% of new residents, often for short stays.

Typical stay 1 years

Finances and operations

Privately-owned community
Operated by a business corporation.
Home revenue
$28.2M
Profit
$2.0M
Privately-owned community Operated by a business corporation.
Home revenue
$28,237,769.00
Profit
$1,956,541.00
Payroll costs Info The portion of the home's budget spent on staff, including nurses, caregivers, and other employees who support care and operations.
$9.9M
35.2% of revenue
Other operating costs Info All remaining costs needed to run the home, such as food, utilities, building maintenance, supplies and administrative expenses.
$16.2M
Total costs $26.1M
Walk Score
Walk Score: 74 / 100
Very walkable. Most errands can be accomplished on foot, and many essentials are within a short walk.
BBB Rating
BBB Rating: A+ (Not Accredited)
An independent rating from the Better Business Bureau based on factors such as complaint history, transparency, and business practices.
How BBB ratings work

About this community

Additional licensing details

CMS Certification Number: 56376

Care Services

Nursing Services
Rehabilitation Services
Skilled Nursing
Licensed Nurses/CNAs
24-Hour Staffing

Programs & Activities

Specific Programs
Physician Services, 24 hour License Nurse Care, Dietary Services, Social & Recreational Service, Respiratory Therapy, Rehabilitation Services

Types of Care at A Grace Subacute & Skilled Care

Nursing Home

Inspection History

In California, the Department of Social Services (for assisted living facilities) and the Department of Public Health (for nursing homes) conduct inspections to ensure resident safety and regulatory compliance.

Health Inspection History

Inspections
Total health inspections 8

California average 12.5


Last Health inspection on Aug 2025

Total health citations 48
Citations per inspection
6

Health citations are formal notices following inspections when they fail to comply with safety and care standards.

43 of 48 citations resulted from standard inspections; and 5 of 48 resulted from complaint investigations.

Breakdown of citation severity (last 3 years)
Critical Health citations More info 0
100% better than California average

California average: 0.4


Serious Health citations More info 0
100% better than California average

California average: 1

0 critical citations More info California average: 0.4

0 serious citations More info California average: 1

48 moderate citations More info California average: 47.2

0 minor citations More info California average: 1.5
Citations history (last 3 years)
Pharmacy moderate citation Aug 14, 2025
Corrected

Environmental moderate citation Oct 18, 2024
Corrected

Environmental moderate citation Oct 18, 2024
Corrected

Infection Control moderate citation Oct 18, 2024
Corrected

Compare Nursing Homes around San Jose

The information below is reported by the California Department of Social Services and Department of Public Health.
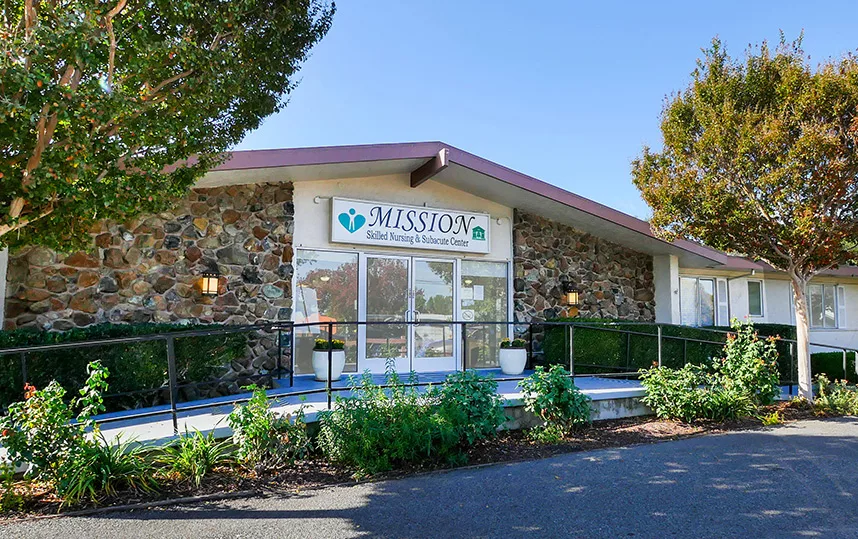
Mission Skilled Nursing & Subacute Center
SNF

Nursing Homes 24/7 care needed

Santa Clara (Cory)
133
-
69
-
84.4%
$32,322,484.00
$10,826,545.00
33.5%
117.60
5/5
4.0851
4/5
4/5
5/5
36
2
+94%
-3%
0%
A Grace Subacute & Skilled Care
SNF

Nursing Homes 24/7 care needed

San Jose (Castlemont)
166
A+
74
ADELMAN, JASON
66.6%
$25,148,254.00
$9,937,439.00
39.5%
102.30
4/5
3.3965
3/5
4/5
5/5
48
-
+98%
-20%
-21%
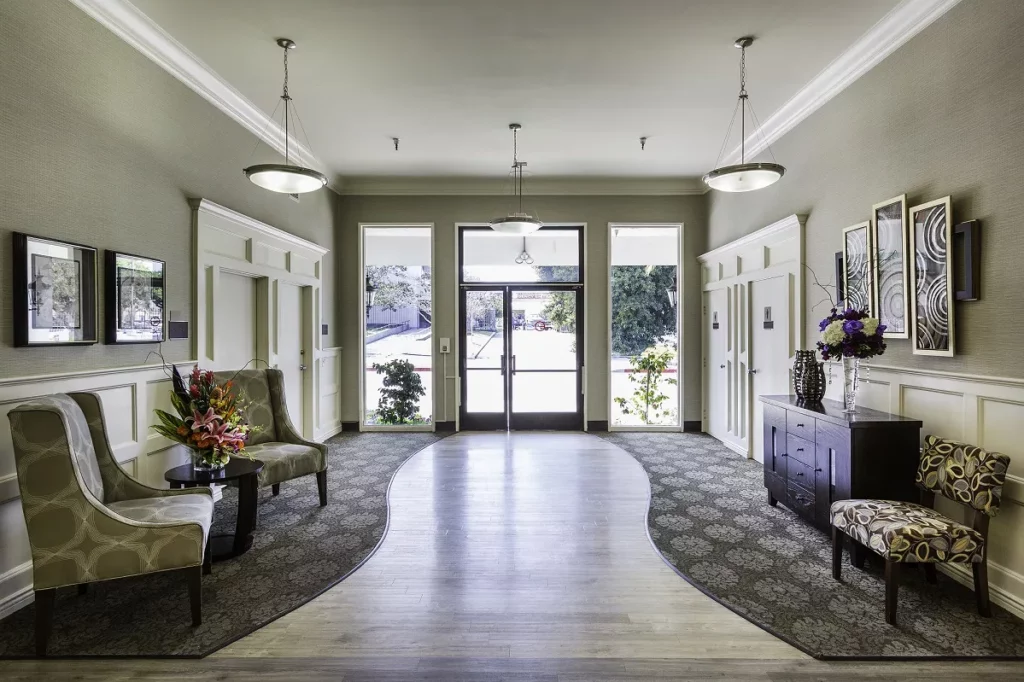
San Jose Healthcare & Wellness Center
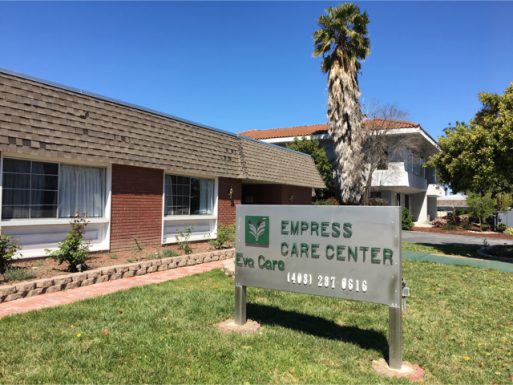
HC

Hospice Care

SNF

Nursing Homes 24/7 care needed

San Jose (Central San Jose)
58
A+
84
CARSON, LESLIE
88.3%
$14,157,340.00
$5,187,705.00
36.6%
50.60
4/5
3.9344
3/5
3/5
5/5
42
1
+12%
-7%
+4%
Empress Care Center
HC

Hospice Care

SNF

Nursing Homes 24/7 care needed

RC

Respite Care

San Jose (Willow Glen)
67
A+
78
DIEBOLD, CORY
70.9%
$7,113,242.00
$3,263,225.00
45.9%
47.70
4/5
4.5055
2/5
5/5
5/5
44
-
-44%
+7%
-16%
Almaden Health & Rehab Center
HC

Hospice Care

SNF

Nursing Homes 24/7 care needed

RC

Respite Care

San Jose (Blossom Crest)
77
-
68
ALMADEN HOLDING COMPANY GP LLC
91.2%
$15,435,458.00
$4,662,104.00
30.2%
68.40
3/5
4.6087
3/5
4/5
4/5
38
-
-30%
+9%
+8%

Places of interest near A Grace Subacute & Skilled Care

Address 7.2 miles from city center — 1.13 miles to nearest hospital (SOAR)

Address 1250 S Winchester Blvd, San Jose, CA 95128

Calculate Travel Distance to A Grace Subacute & Skilled Care

Add your location

Address

Staffing Data

Source: CMS Payroll-Based Journal (Q2 2025)

183
Total Staff
183
Employees
0
Contractors
65,684
Total Hours (Quarter)
94
Avg Staff/Day
7.7
Avg Shift (hrs)
Nursing Staff Breakdown
Role Count Avg Shift (hrs) Uses Contractors?
Registered Nurse317.7 No
Licensed Practical Nurse427.9 No
Certified Nursing Assistant727.3 No
Staff by Category
Administration
2 staff
7.1hs shift avg
Nursing Staff
145 staff
7.6hs shift avg
Physicians & Practitioners
1 staff
8hs shift avg
Therapy Services
21 staff
7.8hs shift avg
Activities & Recreation
8 staff
10hs shift avg
Social Services
1 staff
4.3hs shift avg
Dietary Services
3 staff
8hs shift avg
Other Services
2 staff
7.9hs shift avg
Role Employees Contractors Total Staff Total Hours Days Worked % of Days Avg Shift (hrs)
Certified Nursing Assistant7207227,60391100%7.3
Licensed Practical Nurse4204215,60591100%7.9
Registered Nurse310319,79991100%7.7
Physical Therapist130134,70991100%8
Qualified Activities Professional8083,16191100%10
Other Dietary Services Staff3031,22091100%8
Administrator1015126470%8
Occupational Therapy Aide1015126470%8
Dental Services Staff1015016268%8.1
Physical Therapy Assistant2024966369%7.9
Respiratory Therapy Technician1014926268%7.9
Mental Health Service Worker1014175459%7.7
Nurse Practitioner1014005055%8
Qualified Social Worker1011072527%4.3
Occupational Therapy Assistant3038289%10.3
Speech Language Pathologist101442022%2.2
Medical Director101241213%2

Facility Characteristics

Source: CMS Long-Term Care Facility Characteristics (Data as of Jan 2026)

Total census
99 residents
Residents by payment source
Medicare
7 residents (7.1%)
Medicaid
83 residents (83.8%)
Private pay or other
9 residents (9.1%)
Programs & Services
Residents' Group

Residents meet regularly to discuss policies, care quality, and activities

Active Resident Council

Organized group of residents that meets regularly to discuss facility policies, quality of life, and activities.

Quality of care over time

These measures show how residents usually do over time at this home, based on health outcomes and preventive care.

High-risk clinical events score Info A composite score based on pressure ulcers, falls with injury, weight loss, walking ability decline, and activities of daily living decline. 7.3
10% worse than California average

California average: 6.6

Functional decline score Info A composite score based on activities of daily living decline, walking ability decline, and incontinence. 9.0
21% better than California average

California average: 11.3

Long-stay resident measures
Significantly above average California avg: 4.3 Info CMS star rating based on long-stay quality measure performance. 5 stars = significantly above average, 1 star = significantly below average.
Need for Help with Daily Activities Increased Info Percent of long-stay residents whose need for help with daily activities has increased 10.8%
In line with California average

California average: 11.1%

Walking Ability Worsened Info Percent of long-stay residents whose ability to move independently worsened 13.4%
12% worse than California average

California average: 12.0%

Low Risk Residents with Bowel/Bladder Incontinence Info Percent of low risk long-stay residents who lose control of their bowels or bladder 2.8%
76% better than California average

California average: 11.3%

Falls with Major Injury Info Percent of long-stay residents experiencing one or more falls with major injury 1.0%
38% better than California average

California average: 1.7%

High Risk Residents with Pressure Ulcers Info Percent of long-stay high risk residents with pressure ulcers 5.8%
17% worse than California average

California average: 5.0%

Urinary Tract Infection Info Percent of long-stay residents with a urinary tract infection 0.8%
37% better than California average

California average: 1.2%

Lost Too Much Weight Info Percent of long-stay residents who lose too much weight 5.3%
27% worse than California average

California average: 4.2%

Depressive Symptoms Info Percent of long-stay residents who have depressive symptoms 0.0%
100% better than California average

California average: 6.7%

Antipsychotic Use Info Percent of long-stay residents who received an antipsychotic medication 4.0%
60% better than California average

California average: 10.1%

Pneumococcal Vaccine Info Percent of long-stay residents assessed and appropriately given the pneumococcal vaccine 100.0%
In line with California average

California average: 98.5%

Influenza Vaccine Info Percent of long-stay residents assessed and appropriately given the seasonal influenza vaccine 96.2%
In line with California average

California average: 98.2%

Hospitalizations per 1,000 days Info Number of hospitalizations per 1,000 long-stay resident days. 1.40
38% better than California average

California average: 2.25

ED visits per 1,000 days Info Number of outpatient emergency department visits per 1,000 long-stay resident days. 0.58
64% better than California average

California average: 1.59

Short-stay resident measures
Significantly above average California avg: 3.5 Info CMS star rating based on short-stay quality measure performance. 5 stars = much above average, 1 star = much below average.
Pneumococcal Vaccine Info Percent of short-stay residents assessed and appropriately given the pneumococcal vaccine 95.4%
In line with California average

California average: 94.0%

Antipsychotic medication increase Info Percent of short-stay residents who newly received an antipsychotic medication 0.0%
100% better than California average

California average: 1.5%

Influenza Vaccine Info Percent of short-stay residents assessed and appropriately given the seasonal influenza vaccine 88.6%
5% worse than California average

California average: 93.2%

Re-hospitalized after SNF stay Info Percentage of short-stay residents who were re-hospitalized after their nursing home admission. 15.8%
32% better than California average

California average: 23.2%

Emergency department visits Info Percentage of short-stay residents who had an outpatient emergency department visit. 0.0%
100% better than California average

California average: 11.2%

Falls with major injury Info Percentage of SNF residents who experience falls with major injury during their stay. 0.0%
100% better than California average

California average: 0.8%

Successful return to home or community Info Rate of successful return to home or community from a skilled nursing facility. 29.0%
43% worse than California average

California average: 50.6%

Guides for Better Senior Living

Care Cost Calculator: See Prices in Your Area

Nursing Home Data Explorer

Don’t Wait Too Long: 7 Red Flag Signs Your Parent Needs Assisted Living Now

The True Cost of Assisted Living in 2025 – And How Families Are Paying For It

Understanding Senior Living Costs: Pricing Models, Discounts & Financial Assistance

Financial Aid for California Seniors

Get financial aid guidance

Multipurpose Senior Services Program

MSSP (Medi-Cal Waiver)

Age 65+, California resident, Medi-Cal eligible, nursing home risk.

~$2,829/month (300% FBR, individual).

$2,000 (individual), $3,000 (couple).

County-managed; waitlists possible.

In-Home Supportive Services (IHSS)

California IHSS

Age 65+, California resident, Medicaid-eligible or low-income.

~$1,732/month (individual, Medi-Cal threshold).

$2,000 (individual).

Can hire family as caregivers.

Multipurpose Senior Services Program (MSSP)

CA MSSP

Age 65+, California resident, Medi-Cal-eligible, nursing home-eligible but community-capable.

~$2,829/month (300% FBR, individual).

$2,000 (individual).

Available in 38 counties; waitlists common.

Property Tax Postponement Program (PTP)

CA PTP

Age 62+, California resident, own and live in home, 40% equity.

~$51,500/year (household, adjusted annually).

Equity-based; no strict asset cap.

Deferred taxes accrue interest (5% as of 2024); repaid upon sale/death.

Assisted Living Waiver (ALW)

CA ALW

Age 65+ or disabled, California resident, Medi-Cal-eligible, nursing home-eligible.

~$2,829/month (300% FBR, individual).

$2,000 (individual).

Available in 15 counties (e.g., LA, Sacramento); waitlists common.

California CARES Program

CA CARES

Caregivers of California residents 60+ needing help with 3+ daily activities; no caregiver age limit.

No strict limit; cost-sharing above ~$2,500/month threshold.

Not applicable; need-based.

High demand in urban areas; complements IHSS respite.

Low-Income Home Energy Assistance Program (LIHEAP)

CA LIHEAP

Age 60+ priority, California resident, low-income, utility/heating need.

~$2,510/month (200% of poverty level, individual).

Not applicable; income-focused.

High demand in inland/coastal extremes; weatherization capped at $5,000/home.