Total health inspections
6
Illinois average 10.4
Last Health inspection on Aug 2025

We arrange tours, appointments, and even moving support so you don’t have to
Thank you for your interest!
Our team will be in touch shortly to help with next steps.


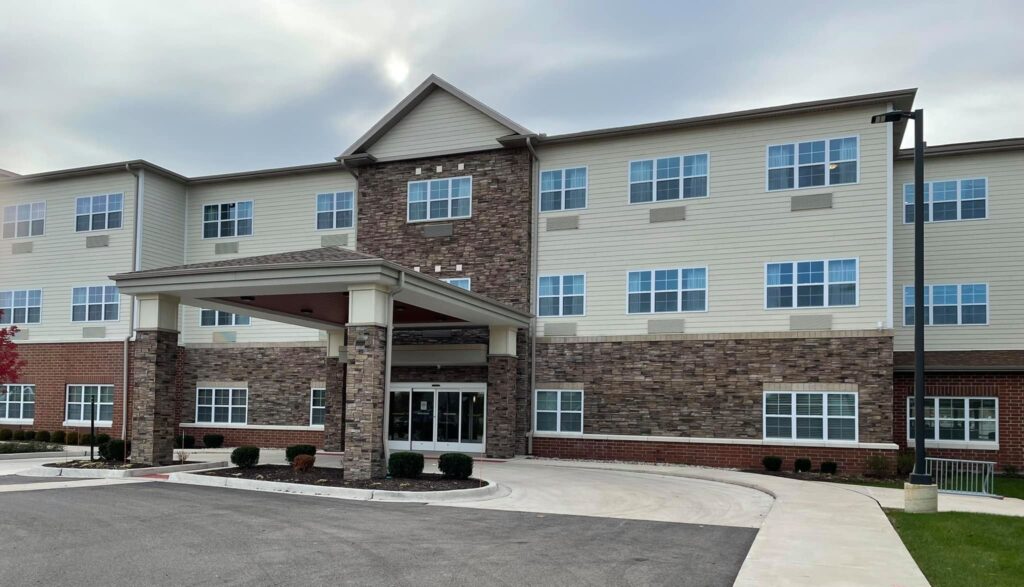
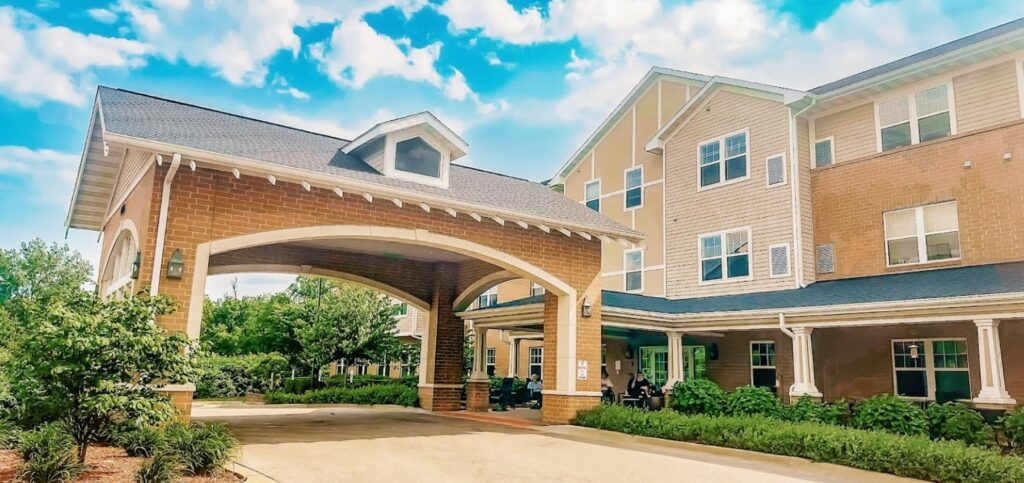
Prepare for an extraordinary and refined experience at Alden Courts of Waterford. This exceptional home offers innovative services that encompass memory care, assisted living, skilled short-term rehabilitation, and Medicare coverage for individuals with memory care needs. Here, residents can gracefully navigate the challenges of memory impairment, thanks to unique therapy programs and life enrichment initiatives designed to provide support and promote well-being.
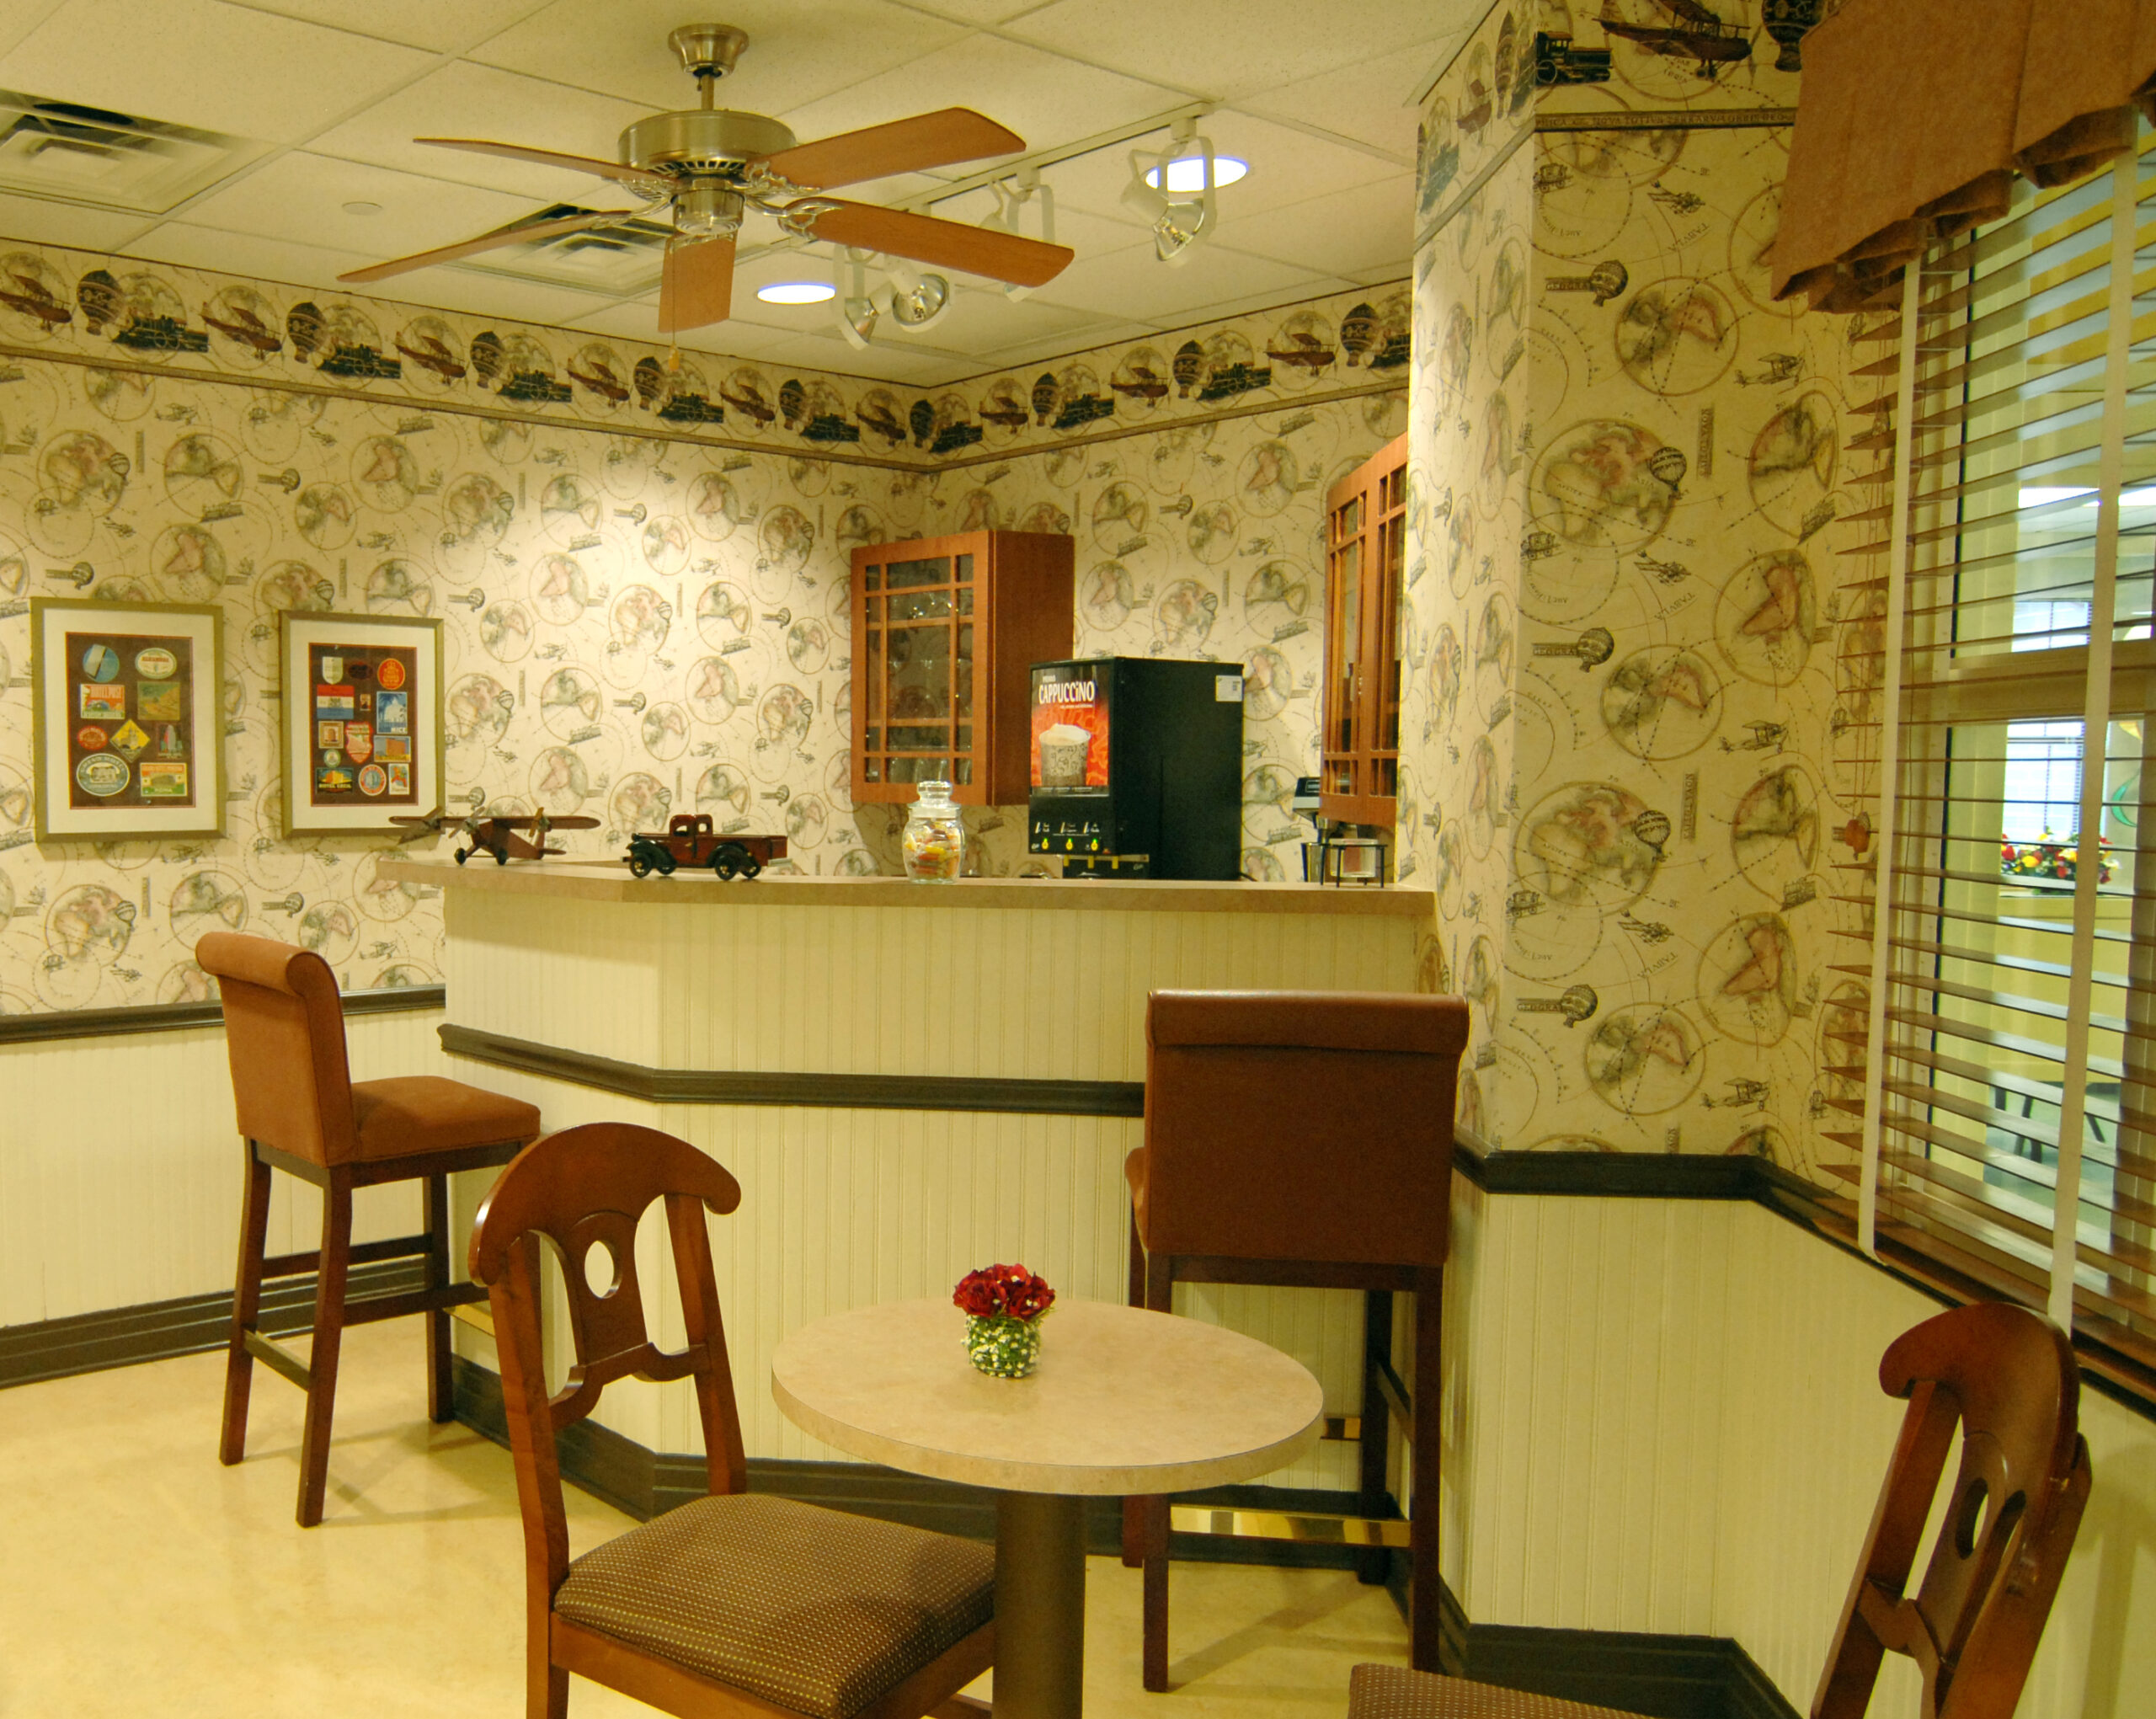
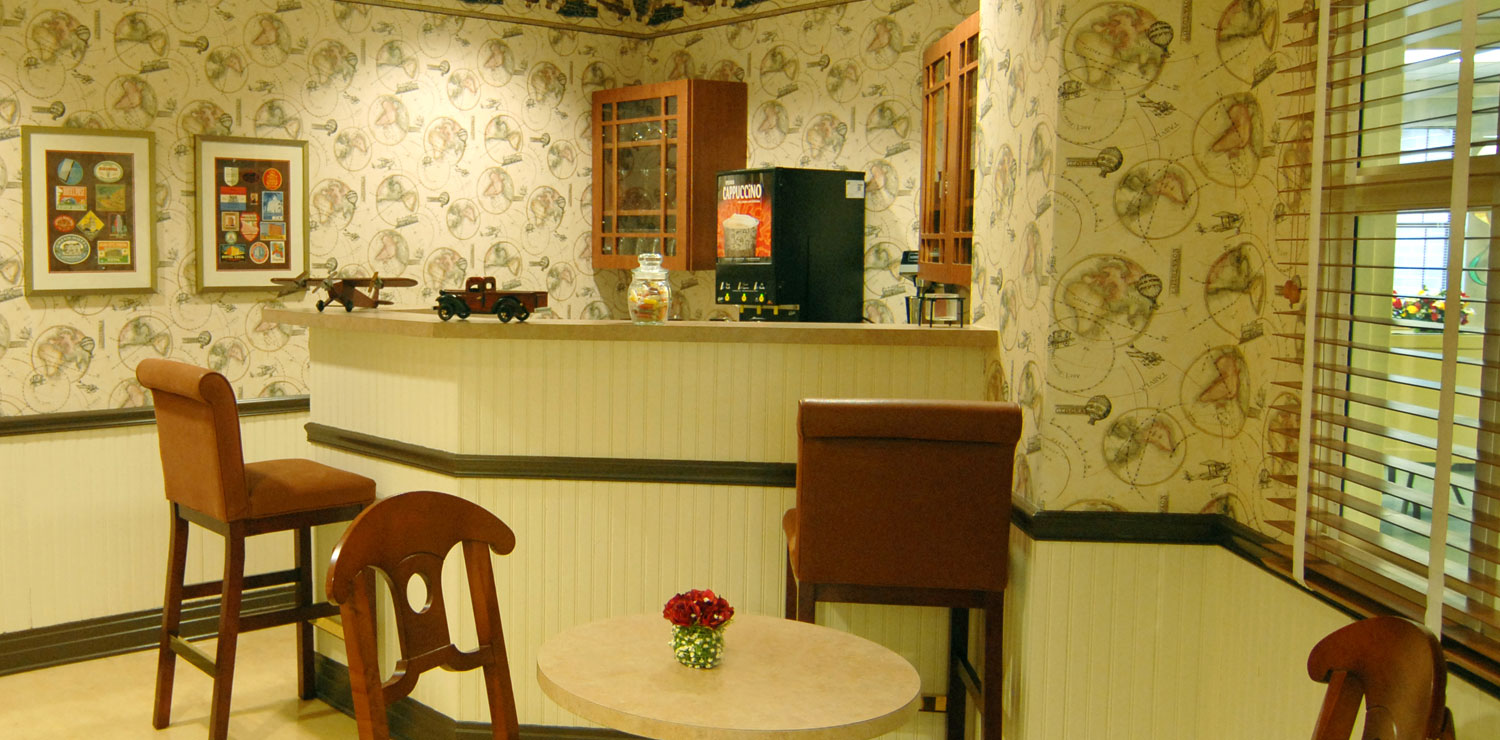
Alden Courts of Waterford also recognizes the importance of memory care insurance, ensuring that residents have access to the necessary coverage for their specialized care. With transparent memory care costs, families can have peace of mind knowing that their loved ones are receiving exceptional care without hidden expenses. Immerse yourself in well-maintained and exquisite common spaces that exude a homelike ambiance. Located in the vibrant community of Aurora, Illinois, this is the place to be for those seeking unparalleled care and comfort.
May offer a more intimate, personalized care environment.
Occupancy is moderate, suggesting balanced demand.
This home supports both short-term rehab and long-term care, with residents staying for a wide range of durations.
29% of new residents, usually for short-term rehab.
37% of new residents, often for short stays.
34% of new residents, often for long-term daily care.
Key information about the people who lead and staff this community.
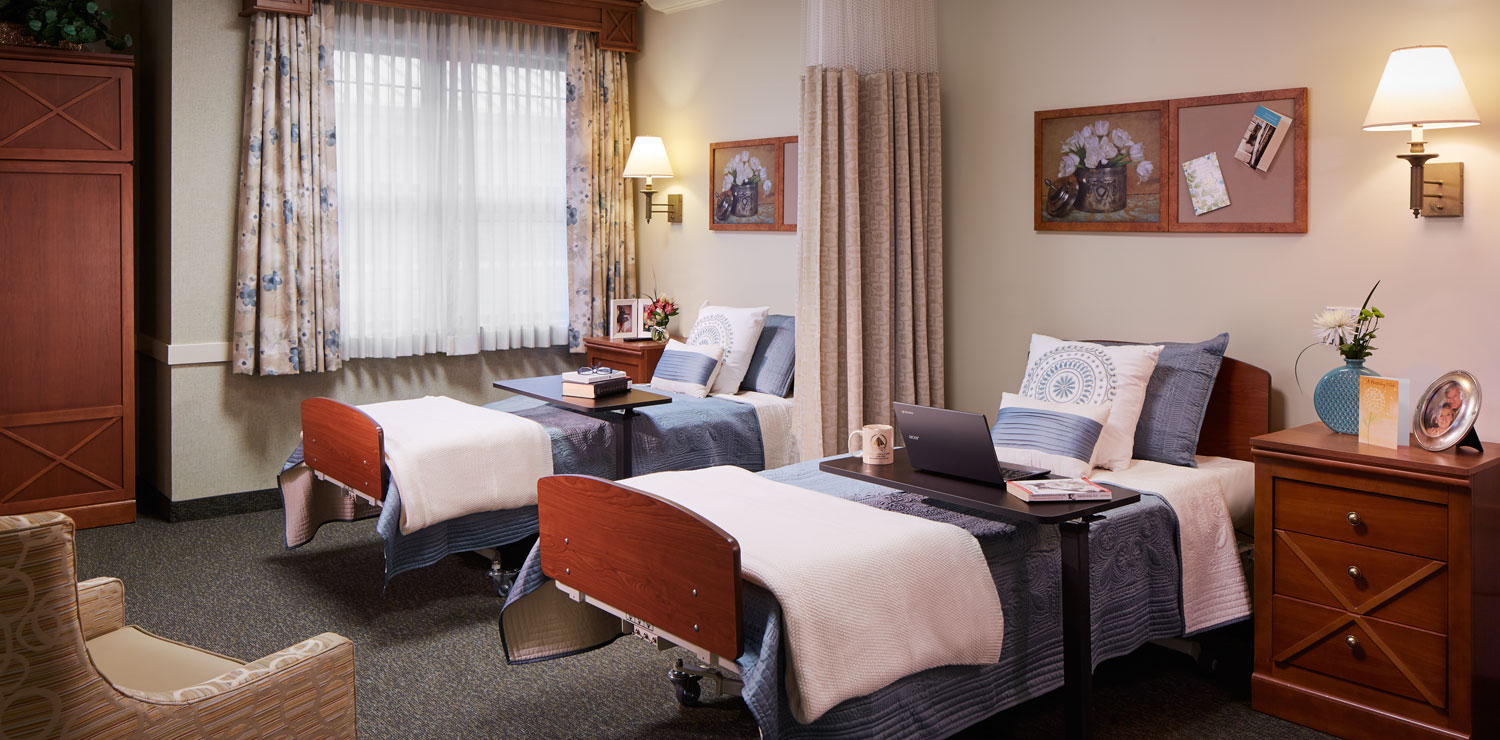
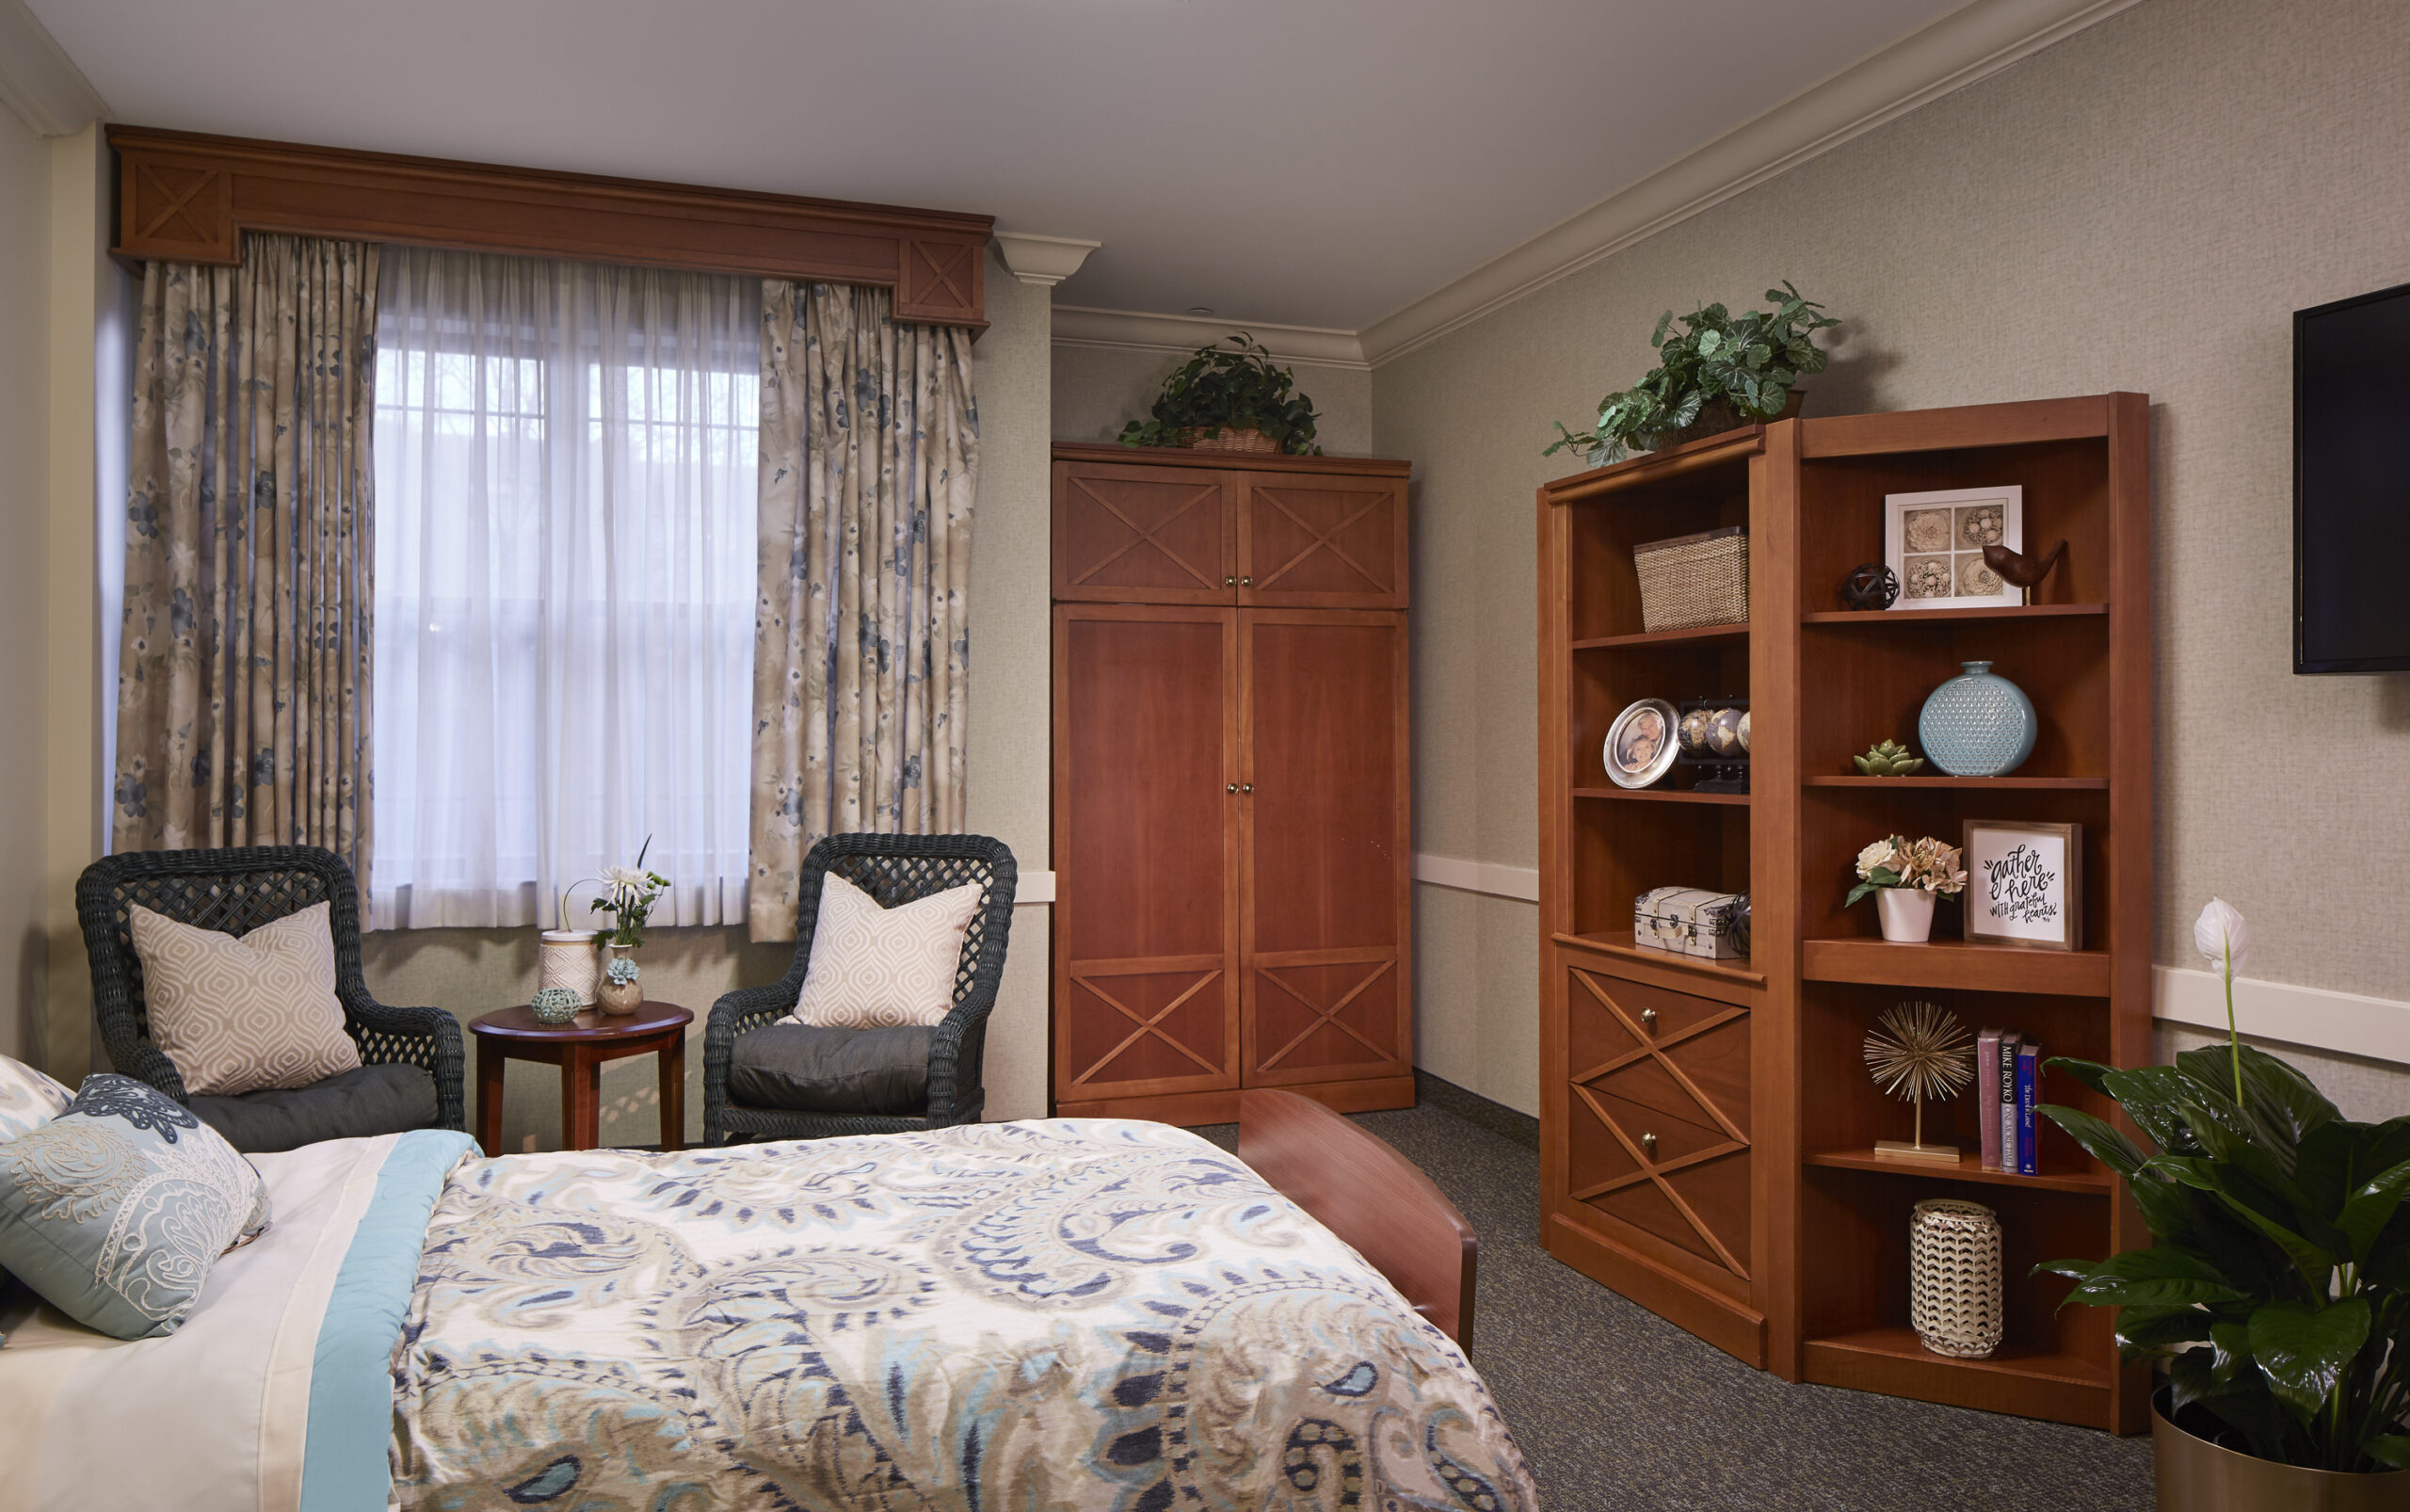
Housing Options: Private Rooms / Semi-Private Rooms
Building Type: Mid-rise
Transportation Services
Fitness and Recreation
Ways to qualify for care at this community, including accepted programs and payment options.
This facility is certified for eligible Medicare services.
In Illinois, the Department of Public Health, Office of Health Care Regulation conducts annual unannounced surveys to assess compliance with state and federal healthcare facility standards.
2 visits/inspections triggered by complaints
2 routine inspections
5 with issues
0 without issues
Deficiencies indicate regulatory issues. A higher number implies the facility had several areas requiring improvement.
Illinois average: 7 deficiencies
Illinois average 10.4
Last Health inspection on Aug 2025
Illinois average 36.8
Illinois average 3.68
Health citations are formal notices following inspections when they fail to comply with safety and care standards.
15 of 20 citations resulted from standard inspections; and 5 of 20 resulted from complaint investigations.
Illinois average: 0.7
Illinois average: 3.6
Data sourced from CMS Health Deficiencies reports. Citation severity codes range from A (least serious) to L (most serious). Immediate Jeopardy (J-L) citations indicate situations where the facility's noncompliance has placed residents at risk of death or serious harm.
Assisted Living A licensed, long-term care setting for seniors or individuals with disabilities who need help with daily activities — like bathing, dressing, and medication management — but not 24-hour skilled nursing. Offers housing, meals, and around-the-clock support while aiming to maximize resident independence.
Memory Care Secured, specialized care for people living with Alzheimer's or dementia. Staff trained in cognitive impairment, with higher staff-to-resident ratios and an environment designed to reduce confusion and wandering risk.
Nursing Home Licensed facility providing 24/7 skilled nursing care for residents with complex, ongoing medical needs. Staffed by RNs, LPNs, and CNAs. Inspected and star-rated annually by CMS. Accepts Medicare (short-term rehab) and Medicaid (long-term care).
Assisted Living A licensed, long-term care setting for seniors or individuals with disabilities who need help with daily activities — like bathing, dressing, and medication management — but not 24-hour skilled nursing. Offers housing, meals, and around-the-clock support while aiming to maximize resident independence.
Independent Living Lifestyle-focused communities for older adults offering dining, activities, and transportation with minimal personal care. Best for active, independent seniors who want community without medical support.
Memory Care Secured, specialized care for people living with Alzheimer's or dementia. Staff trained in cognitive impairment, with higher staff-to-resident ratios and an environment designed to reduce confusion and wandering risk.
Assisted Living A licensed, long-term care setting for seniors or individuals with disabilities who need help with daily activities — like bathing, dressing, and medication management — but not 24-hour skilled nursing. Offers housing, meals, and around-the-clock support while aiming to maximize resident independence.
Memory Care Secured, specialized care for people living with Alzheimer's or dementia. Staff trained in cognitive impairment, with higher staff-to-resident ratios and an environment designed to reduce confusion and wandering risk.
Respite Care Short-term temporary care — days to weeks — to give family caregivers a break. Full care provided during the stay. Often used after hospitalization or to trial a facility before a permanent placement decision.
Assisted Living A licensed, long-term care setting for seniors or individuals with disabilities who need help with daily activities — like bathing, dressing, and medication management — but not 24-hour skilled nursing. Offers housing, meals, and around-the-clock support while aiming to maximize resident independence.
Independent Living Lifestyle-focused communities for older adults offering dining, activities, and transportation with minimal personal care. Best for active, independent seniors who want community without medical support.
Memory Care Secured, specialized care for people living with Alzheimer's or dementia. Staff trained in cognitive impairment, with higher staff-to-resident ratios and an environment designed to reduce confusion and wandering risk.
![]() 3.8 miles from city center — 0.56 miles to nearest hospital (Rush Copley Medical Center)
3.8 miles from city center — 0.56 miles to nearest hospital (Rush Copley Medical Center)
![]() 1991 Randi Dr, Aurora, IL 60504
1991 Randi Dr, Aurora, IL 60504
Add your location
This data corresponds to Q2 2025 and is based on CMS Payroll-Based Journal.
Illinois average ratio: 1.90:1
Illinois average: 7.6 hours
Manages medical care and health needs.
This role is partially covered by contractors.
Assists with medical care and medications.
This role is partially covered by contractors.
Helps with daily care and mobility.
This role is partially covered by contractors.
Total hours from contractors
2,080 contractor hours this quarter
| Certified Nursing Assistant | 35 | 4 | 39 | 12,227 | 91 | 100% | 7.3 |
| Registered Nurse | 13 | 4 | 17 | 4,905 | 91 | 100% | 9.5 |
| Other Dietary Services Staff | 8 | 0 | 8 | 2,489 | 91 | 100% | 7 |
| Licensed Practical Nurse | 3 | 7 | 10 | 1,346 | 76 | 84% | 9.5 |
| Administrator | 2 | 0 | 2 | 512 | 60 | 66% | 8 |
| Physical Therapy Assistant | 0 | 4 | 4 | 494 | 76 | 84% | 6.4 |
| Nurse Practitioner | 1 | 0 | 1 | 481 | 65 | 71% | 7.4 |
| Speech Language Pathologist | 0 | 6 | 6 | 452 | 73 | 80% | 5.9 |
| Physical Therapy Aide | 0 | 2 | 2 | 295 | 58 | 64% | 4.8 |
| Respiratory Therapy Technician | 0 | 7 | 7 | 267 | 66 | 73% | 3.8 |
| Qualified Social Worker | 0 | 3 | 3 | 259 | 60 | 66% | 4.2 |
| Dietitian | 1 | 0 | 1 | 243 | 34 | 37% | 7.1 |
| Occupational Therapy Aide | 0 | 2 | 2 | 131 | 36 | 40% | 3.5 |
| Medical Director | 0 | 1 | 1 | 26 | 13 | 14% | 2 |
Source: CMS Long-Term Care Facility Characteristics (Data as of Jan 2026)
Residents meet regularly to discuss policies, care quality, and activities
State-approved Nurse Aide Training and Competency Evaluation Program on-site
Organized group of residents that meets regularly to discuss facility policies, quality of life, and activities.
Data sourced from CMS Long-Term Care Facility Characteristics quarterly report. Payer mix reflects the current resident census by primary payment source.
These measures show how residents usually do over time at this home, based on health outcomes and preventive care.
Illinois average: 9.7
Illinois average: 18.6
Illinois average: 15.5%
Illinois average: 18.4%
Illinois average: 21.6%
Illinois average: 3.4%
Illinois average: 5.3%
Illinois average: 1.8%
Illinois average: 6.5%
Illinois average: 48.1%
Illinois average: 20.2%
Illinois average: 89.2%
Illinois average: 91.6%
Illinois average: 2.05
Illinois average: 2.25
Illinois average: 68.3%
Illinois average: 2.3%
Illinois average: 63.0%
Illinois average: 26.2%
Illinois average: 14.0%
Illinois average: 0.8%
Illinois average: 53.7%
Illinois average: 50.6%
Quality measures are calculated from Minimum Data Set (MDS) assessments. For most measures, lower percentages indicate better care quality.
Historical financial and operational data for Alden Courts of Waterford based on CMS SNF Cost Reports.
Loading trend charts...
Care Cost Calculator: See Prices in Your Area
Nursing Home Data Explorer
Don’t Wait Too Long: 7 Red Flag Signs Your Parent Needs Assisted Living Now
The True Cost of Assisted Living in 2025 – And How Families Are Paying For It
Understanding Senior Living Costs: Pricing Models, Discounts & Financial Assistance

Touring a community? Use this expert-backed checklist to stay organized, ask the right questions, and find the perfect fit.
We'll send you a PDF version of the touring checklist.