Alden Courts of Waterford
Nursing Home, Independent Living, Assisted Living & Memory Care · Aurora, IL
CMS overall rating Info The Overall CMS Rating is scored from 1 to 5 stars and combines results from health inspections, staffing levels, and quality measures. Health inspections carry the most weight. Staffing and quality scores can increase or decrease the final rating based on performance compared to state and national standards.

Alden Courts of Waterford

Nursing Home, Independent Living, Assisted Living & Memory Care · Aurora, IL
CMS overall rating Info The Overall CMS Rating is scored from 1 to 5 stars and combines results from health inspections, staffing levels, and quality measures. Health inspections carry the most weight. Staffing and quality scores can increase or decrease the final rating based on performance compared to state and national standards.
Calculator: See prices in your area
Alden Courts of Waterford accepts Medicare, Medicaid, and private pay.

Overview of Alden Courts of Waterford

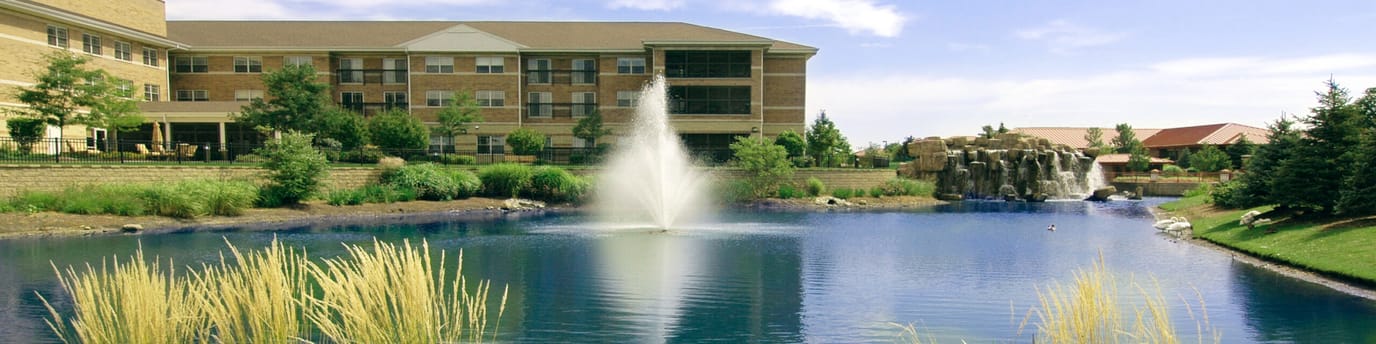
Prepare for an extraordinary and refined experience at Alden Courts of Waterford. This exceptional home offers innovative services that encompass memory care, assisted living, skilled short-term rehabilitation, and Medicare coverage for individuals with memory care needs. Here, residents can gracefully navigate the challenges of memory impairment, thanks to unique therapy programs and life enrichment initiatives designed to provide support and promote well-being.

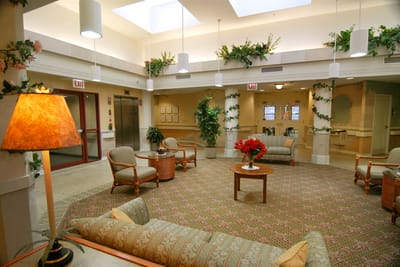
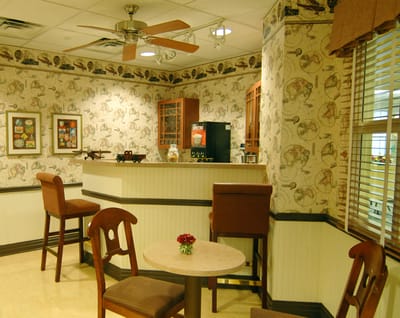
Alden Courts of Waterford also recognizes the importance of memory care insurance, ensuring that residents have access to the necessary coverage for their specialized care. With transparent memory care costs, families can have peace of mind knowing that their loved ones are receiving exceptional care without hidden expenses. Immerse yourself in well-maintained and exquisite common spaces that exude a homelike ambiance. Located in the vibrant community of Aurora, Illinois, this is the place to be for those seeking unparalleled care and comfort.

(630) 851-1466

Quality ratings

Measured by Centers for Medicare & Medicaid Services (CMS)

Overall rating Info The Overall CMS Rating combines results from health inspections, staffing levels and quality measures. Health inspections carry the most weight. Staffing and quality scores can increase or decrease the final rating based on performance compared to state and national standards.
▲ 27.0% Above IL avg. ▲ 27.0% Above IL avg.Click the badge to see the full State ranking.Click here to see the full State ranking.
Health Inspection Info Based on the results of the facility's three most recent standard inspections and any complaint investigations. CMS reviews the number, scope, and severity of deficiencies, with more recent findings weighted more heavily.
▲ 31.6% Above IL avg. ▲ 31.6% Above IL avg.Click the badge to see the full State ranking.Click here to see the full State ranking.
Staffing Info Measures average nursing staff hours per resident per day, including Registered Nurses (RNs) and total nursing staff. Ratings are adjusted based on the level of care residents require and are compared to state and national benchmarks.
▼ 39.9% Below IL avg. ▼ 39.9% Below IL avg.Click the badge to see the full State ranking.Click here to see the full State ranking.
Quality Measures Info Based on clinical and physical health indicators reported to CMS, such as hospital readmissions, falls, pressure ulcers, and improvements in mobility. These measures reflect how well residents' health needs are being managed.
▼ 37.3% Below IL avg. ▼ 37.3% Below IL avg.Click the badge to see the full State ranking.Click here to see the full State ranking.

Staffing hours breakdown

Info Daily nursing hours per resident by staff type, reported to CMS. Higher is generally better — compare this facility to state and national averages to see where staffing stands.

Hours per resident per day — compared to Illinois state averages

Total nursing care / resident Info This home is ranked 54th out of 167 homes in Illinois. Total adjusted nursing hours per resident per day, combining RN, LPN, and aide time. CMS adjusts this for case-mix so facilities can be fairly compared.
3h 36m per day
Rank #54 / 167Nurse hours — State benchmarkedThis home is ranked 54th out of 167 homes in Illinois. Shows adjusted nurse hours per resident per day benchmarked to the Illinois average, with a ranking across 167 Illinois SNFs. More hours mean more direct care. The national average is about 3.5 hrs; below 3.0 is a red flag.Click the rank badge to see the full State ranking.Click here to see the full State ranking.
This facility Illinois avg (3h 57m per day)
vs Illinois avg
-9%

1 of 6 metrics below state avg

Standout metric Weekend RN is +82% above state avg
Staff typeHours / Day / Residentvs state avg
Registered Nurse (RN) Info RNs hold the highest nursing license and can assess residents, interpret test results, and direct care plans. More RN hours per day often signals stronger clinical oversight and faster response to health changes. 1h 5m per day ▲ 48% State avg: 44m per day · National avg: 41m per day
LPN / LVN Info Licensed Practical Nurses (LPNs) or Licensed Vocational Nurses (LVNs) deliver routine hands-on care — medication administration, wound dressing, and monitoring vital signs. They work under RN supervision and make up a large share of daily bedside care. 15m per day ▼ 61% State avg: 38m per day · National avg: 52m per day
Nurse Aide Info Certified Nurse Aides (CNAs) provide the most direct day-to-day assistance: bathing, dressing, feeding, and mobility. Nurse aide hours are typically the largest staffing category and directly affect residents' quality of life. 2h 26m per day ▲ 14% State avg: 2h 8m per day · National avg: 2h 21m per day
Weekend Total Nursing Info Combined nursing hours (RN + LPN + Nurse Aide) per resident per day on weekends. Staffing often drops on weekends — this figure reveals whether the facility maintains adequate coverage outside of weekday hours. 3h 24m per day ▲ 10% State avg: 3h 5m per day · National avg: 3h 26m per day
Physical Therapist Info Hours per resident per day provided by licensed Physical Therapists (PTs) or PT Assistants. PT services help residents recover mobility after injury or illness and are especially important for post-acute (short-stay) rehabilitation. 3m per day ■ Avg State avg: 3m per day · National avg: 4m per day
Weekend RN Info Registered nurse hours specifically on weekends. Facilities sometimes reduce RN presence on Saturdays and Sundays — a low weekend RN figure compared to weekday hours can indicate reduced clinical oversight when most administrative staff are absent. 1h 2m per day ▲ 82% State avg: 34m per day · National avg: 29m per day

Types of Care at Alden Courts of Waterford

Independent Living Assisted Living Memory Care Nursing Home

Capacity and availability

This home usually has limited availability

Occupancy between 85% and 95% suggests balanced demand.

Higher occupancy than the Illinois average: 69.3%
Occupancy rate 90% Rank #33 / 199Occupancy rate — State benchmarkedThis home is ranked 33rd out of 199 homes in Illinois. Shows this facility's occupancy rate versus the Illinois average, with its Statewide rank out of 199. Higher occupancy signals strong local demand and financial stability.Click the rank badge to see the full State ranking.Click here to see the full State ranking.
Avg. Length of Stay 68 days
Occupancy rate
90% Rank #33 / 199Occupancy rate — State benchmarkedThis home is ranked 33rd out of 199 homes in Illinois. Shows this facility's occupancy rate versus the Illinois average, with its Statewide rank out of 199. Higher occupancy signals strong local demand and financial stability.Click the rank badge to see the full State ranking.Click here to see the full State ranking.
Avg. Length of Stay
68 days
Years in operation
24 years in operation Rank #52 / 251Years in operation — State benchmarkedThis home is ranked 52nd out of 251 homes in Illinois. Shows how long this facility has been in operation compared to other Illinois SNFs. Longer operating histories may benefit residents, families, and staff.Click the rank badge to see the full State ranking.Click here to see the full State ranking.
A longer operating history, which may indicate experience navigating regulations and delivering ongoing care.
Walk Score
Walk Score: 58 / 100 Rank #253 / 647Walk Score — State benchmarkedThis home is ranked 253rd out of 647 homes in Illinois. Shows how walkable this facility's neighborhood is compared to the average Walk Score across Illinois SNFs. Higher scores benefit residents, families, and staff.Click the rank badge to see the full State ranking.Click here to see the full State ranking.
Moderately walkable. Some errands can be accomplished on foot, with a mix of nearby amenities.
BBB Rating
BBB Rating: A+ (Not Accredited)
An independent rating from the Better Business Bureau based on factors such as complaint history, transparency, and business practices.
How BBB ratings work

About this community

About the Community

The facility features private and semi-private apartments, three neighborhoods based on care levels, and enclosed outdoor courtyards designed for safety and stimulation.

License Details

CMS Certification Number146182

Staffing

Key information about the people who lead and staff this community.

Leadership

ContactJanine Schoen

Payment & Insurance

1 service
Accept Medicare

Therapy & Rehabilitation

3 services
Rehabilitation Services
Respite Care
Short-Term Rehab

Staffing & Medical

1 service
24-Hour Staffing

Amenities & Lifestyle

Courtyard
Garden
Patio
Branded ProgramsBest Friend Program, Cadence Program, Expressions Program, Exposure Program, Sensations Program, Nurture Program, Nature Lovers Program, Retreat Program, Inner Bliss Program
Wellness ProgramThe Wellness Dining Program is designed to provide nutritious meals served with exquisite taste.
Specific ProgramsMemory Care Assisted Living, Life Enrichment Program, Payment, About Alden Video, Programs, Aging In Place, Wellness Dining Program, Unique Therapy Programs, Family Orientation and Support Program, Medicare-Covered Short-Term Rehab, 5-Star Service, Specialized Neighborhoods, Nursing Care, Accommodations, Memory Care Professionals

Dining & Nutrition

Food DescriptionThe Wellness Dining Program focuses on nutritious meals that enhance the dining experience and promote independent eating for residents.

Contact Alden Courts of Waterford

Inspection History

In Illinois, the Department of Public Health, Office of Health Care Regulation conducts annual unannounced surveys to assess compliance with state and federal healthcare facility standards.

Since 2023 · 3 years of data 20 deficiencies

Inspection Scorecard Info This scorecard compares key inspection, citation, and complaint metrics at this facility against the Illinois state average. Metrics rated ≥15% worse than average are highlighted in red; those ≥15% better are highlighted in green.

Since 2023 vs. Illinois state average
Overall vs. IL average 2 Worse Metrics worse than Illinois average:
• Total deficiencies (186% above)
• Deficiencies per year (191% above)
0 Better No metrics in this bucket.
Latest Inspection August 28, 2025 Annual Inspection

Deficiencies Info Deficiencies are formal regulatory issues recorded during state inspections.

This FacilityIL Averagevs. IL Avg
Total deficiencies Info Formal regulatory issues recorded by inspectors across all inspection types. 207 This facility has 186% more total deficiencies than a typical Illinois nursing home (20 vs. IL avg 7).↑ 186% worse
Deficiencies per year Info Average deficiencies per year since 2023. 6.72.3 This facility has 191% more deficiencies per year than a typical Illinois nursing home (6.7 vs. IL avg 2.3).↑ 191% worse

Inspection Reports Summary Info An editor-reviewed summary of the themes and findings across this facility's recent inspection reports.

The most recent inspection on August 28, 2025, identified deficiencies related to resident transfer procedures, urinary catheter care, oxygen administration, infection control, and PPE use. Earlier inspections showed similar issues with pressure ulcer care, medication transcription errors, infection prevention, medication management, and discharge notifications. Inspectors cited recurring problems in wound care, infection control practices, and medication management, with substantiated complaints regarding medication transcription and discharge notification failures. No fines, immediate jeopardy findings, or license actions were listed in the available reports. The pattern of deficiencies suggests ongoing challenges with clinical care processes, with no clear trend of improvement or worsening over time.

Read the full inspection reports for this facility, including detailed findings and corrective actions.

Show Inspection Reports

Health Inspection History

Inspections since 2022
Total health inspections 6

Illinois average 10.4


Last Health inspection on Aug 2025

Total health citations
20 Rank #42 / 167Health citations — State benchmarkedThis home is ranked 42nd out of 167 homes in Illinois. Shows this facility's total health deficiency citations benchmarked to the Illinois State average, with a ranking across all 167 IL SNFs. Lower citation counts earn a better rank.Click the rank badge to see the full State ranking.Click here to see the full State ranking.

Illinois average 36.8

Citations per inspection
3.33 Rank #69 / 167Citations per inspection — State benchmarkedThis home is ranked 69th out of 167 homes in Illinois. Shows average deficiency citations per CMS inspection for this facility versus the Illinois mean across 167 SNFs with citation data. Lower is better.Click the rank badge to see the full State ranking.Click here to see the full State ranking.

Illinois average 3.68


Health citations are formal notices following inspections when they fail to comply with safety and care standards.

15 of 20 citations resulted from standard inspections; and 5 of 20 resulted from complaint investigations.

Breakdown of citation severity (last 4 years)
Critical Health citations
0
100% better than Illinois average

Illinois average: 0.7


Serious Health citations
0
100% better than Illinois average

Illinois average: 3.6

0 critical citations Illinois average: 0.7

0 serious citations Illinois average: 3.6

19 moderate citations Illinois average: 32

1 minor citation Illinois average: 0.5
Citations history (last 4 years)
Infection Control moderate citation Aug 28, 2025
Corrected

Quality of Care moderate citation Aug 28, 2025
Corrected

Quality of Care moderate citation Aug 28, 2025
Corrected

Quality of Care moderate citation Aug 28, 2025
Corrected

Staffing Data

Reporting period: October 1 – December 31, 2025 (Q4 2025). Source: CMS Payroll-Based Journal report.

Total staff 97
Employees 68
Contractors 29
Staff to resident ratio 1.67:1
12% worse than Illinois average
Illinois average ratio: 1.90:1 Illinois average ratio: 1.90:1See full Illinois ranking
Avg staff/day 35
Average shift 7.7 hours
0% compared with Illinois average
Illinois average: 7.6 hours Illinois average shift: 7.6 hoursSee full Illinois ranking
Total staff hours (quarter) 24,714

Nursing staff breakdown

Q4 2025 · Oct 1 – Dec 31 More info This data comes from the CMS Payroll-Based Journal report covering October 1 – December 31, 2025.
Registered Nurse

Manages medical care and health needs.

RN Staff 19
Average shift length Info Average shift length. Calculated as total hours divided by days worked and average staff per day. 9.1 hours

No contractors work on this role.

Licensed Practical Nurse

Assists with medical care and medications.

LPN Staff 3
Average shift length Info Average shift length. Calculated as total hours divided by days worked and average staff per day. 9.8 hours

No contractors work on this role.

Certified Nursing Assistant

Helps with daily care and mobility.

CNA Staff 37
Average shift length Info Average shift length. Calculated as total hours divided by days worked and average staff per day. 7.7 hours

No contractors work on this role.

Contractor staffing

Q4 2025 · Oct 1 – Dec 31 More info This data comes from the CMS Payroll-Based Journal report covering October 1 – December 31, 2025.

Total hours from contractors

7.1%

1,763 contractor hours this quarter

Respiratory Therapy Technician: 8 Speech Language Pathologist: 7 Physical Therapy Assistant: 4 Qualified Social Worker: 4 Occupational Therapy Aide: 2 Physical Therapy Aide: 2 Medical Director: 1 Other Social Services Staff: 1

Staff by category

Q4 2025 · Oct 1 – Dec 31 More info This data comes from the CMS Payroll-Based Journal report covering October 1 – December 31, 2025.
Certified Nursing Assistant3703712,61592100%7.7
Registered Nurse190195,88492100%9.1
Other Dietary Services Staff6062,39892100%6.9
Licensed Practical Nurse3031,0127480%9.8
Physical Therapy Assistant0444787784%6.1
Administrator1014165257%8
Dietitian1014015863%6.9
Respiratory Therapy Technician0883576571%4.3
Speech Language Pathologist0772885054%5.6
Qualified Social Worker0442815560%5.1
Physical Therapy Aide0222315863%3.8
Nurse Practitioner1012263134%7.3
Occupational Therapy Aide022982527%3.9
Medical Director011261314%2
Other Social Services Staff011411%4
37 Certified Nursing Assistant
% of Days 100%
19 Registered Nurse
% of Days 100%
6 Other Dietary Services Staff
% of Days 100%
3 Licensed Practical Nurse
% of Days 80%
4 Physical Therapy Assistant
% of Days 84%
1 Administrator
% of Days 57%
1 Dietitian
% of Days 63%
8 Respiratory Therapy Technician
% of Days 71%
7 Speech Language Pathologist
% of Days 54%
4 Qualified Social Worker
% of Days 60%
2 Physical Therapy Aide
% of Days 63%
1 Nurse Practitioner
% of Days 34%
2 Occupational Therapy Aide
% of Days 27%
1 Medical Director
% of Days 14%
1 Other Social Services Staff
% of Days 1%

Penalties and fines

Federal penalties imposed by CMS for regulatory violations, including civil money penalties (fines) and denials of payment for new Medicare/Medicaid admissions.

Source: CMS Penalties Database

No penalties in the past 3 years

No civil money penalties or payment denials were reported in the last 3 years.

Quality of care over time

These measures show how residents usually do over time at this home, based on health outcomes and preventive care.

High-risk clinical events score Info A composite score based on pressure ulcers, falls with injury, weight loss, walking ability decline, and activities of daily living decline. 8.3
15% better than Illinois average

Illinois average: 9.7

Functional decline score Info A composite score based on activities of daily living decline, walking ability decline, and incontinence. 18.1
In line with Illinois average

Illinois average: 18.6

Long-stay resident measures
Average Illinois avg: 3.6 Info CMS star rating based on long-stay quality measure performance. 5 stars = significantly above average, 1 star = significantly below average.
Need for Help with Daily Activities Increased Info Percent of long-stay residents whose need for help with daily activities has increased 10.1%
35% better than Illinois average

Illinois average: 15.5%

Walking Ability Worsened Info Percent of long-stay residents whose ability to move independently worsened 12.4%
33% better than Illinois average

Illinois average: 18.4%

Low Risk Residents with Bowel/Bladder Incontinence Info Percent of low risk long-stay residents who lose control of their bowels or bladder 31.9%
48% worse than Illinois average

Illinois average: 21.6%

Falls with Major Injury Info Percent of long-stay residents experiencing one or more falls with major injury 6.7%
101% worse than Illinois average

Illinois average: 3.4%

High Risk Residents with Pressure Ulcers Info Percent of long-stay high risk residents with pressure ulcers 3.8%
28% better than Illinois average

Illinois average: 5.3%

Urinary Tract Infection Info Percent of long-stay residents with a urinary tract infection 4.2%
134% worse than Illinois average

Illinois average: 1.8%

Lost Too Much Weight Info Percent of long-stay residents who lose too much weight 8.3%
27% worse than Illinois average

Illinois average: 6.5%

Depressive Symptoms Info Percent of long-stay residents who have depressive symptoms 19.8%
59% better than Illinois average

Illinois average: 48.1%

Antipsychotic Use Info Percent of long-stay residents who received an antipsychotic medication 15.8%
22% better than Illinois average

Illinois average: 20.2%

Pneumococcal Vaccine Info Percent of long-stay residents assessed and appropriately given the pneumococcal vaccine 86.5%
In line with Illinois average

Illinois average: 89.2%

Influenza Vaccine Info Percent of long-stay residents assessed and appropriately given the seasonal influenza vaccine 98.1%
7% better than Illinois average

Illinois average: 91.6%

Hospitalizations per 1,000 days Info Number of hospitalizations per 1,000 long-stay resident days. 2.11
In line with Illinois average

Illinois average: 2.05

ED visits per 1,000 days Info Number of outpatient emergency department visits per 1,000 long-stay resident days. 1.76
22% better than Illinois average

Illinois average: 2.25

Short-stay resident measures
Below average Illinois avg: 2.3 Info CMS star rating based on short-stay quality measure performance. 5 stars = much above average, 1 star = much below average.
Pneumococcal Vaccine Info Percent of short-stay residents assessed and appropriately given the pneumococcal vaccine 43.2%
37% worse than Illinois average

Illinois average: 68.3%

Antipsychotic medication increase Info Percent of short-stay residents who newly received an antipsychotic medication 1.2%
47% better than Illinois average

Illinois average: 2.3%

Influenza Vaccine Info Percent of short-stay residents assessed and appropriately given the seasonal influenza vaccine 62.5%
In line with Illinois average

Illinois average: 63.0%

Re-hospitalized after SNF stay Info Percentage of short-stay residents who were re-hospitalized after their nursing home admission. 29.3%
12% worse than Illinois average

Illinois average: 26.2%

Emergency department visits Info Percentage of short-stay residents who had an outpatient emergency department visit. 26.9%
92% worse than Illinois average

Illinois average: 14.0%

Falls with major injury Info Percentage of SNF residents who experience falls with major injury during their stay. 1.2%
56% worse than Illinois average

Illinois average: 0.8%

Ability to care for self at discharge Info Percentage of residents at or above expected ability to care for themselves at discharge. 69.6%
30% better than Illinois average

Illinois average: 53.7%

Successful return to home or community Info Rate of successful return to home or community from a skilled nursing facility. 34.0%
33% worse than Illinois average

Illinois average: 50.6%

Breakdown by payment type

Medicare

29% of new residents, usually for short-term rehab.

Typical stay 1 - 2 months

Private pay

37% of new residents, often for short stays.

Typical stay 2 months

Medicaid

34% of new residents, often for long-term daily care.

Typical stay 3 months

Facility Characteristics

Source: CMS Long-Term Care Facility Characteristics (Data as of Jan 2026)

Total residents 58
Medicare
6
10.3% of residents
Medicaid
44
75.9% of residents
Private pay or other
8
13.8% of residents
Programs & Services
Residents Group

Residents meet regularly to discuss policies, care quality, and activities

Nurse Aide Training

State-approved Nurse Aide Training and Competency Evaluation Program on-site

Active Resident Council

Organized group of residents that meets regularly to discuss facility policies, quality of life, and activities.

Finances and operations

Privately-owned community
Home revenue
$6.8M
Operating loss
-$326.9K
Privately-owned community
Home revenue
$6.8M Rank #149 / 166Revenue — State benchmarkedThis home is ranked 149th out of 166 homes in Illinois. Shows this facility's annual revenue compared to the Illinois SNF average. Higher revenue generally means more resources for staffing and capital — read alongside Payroll %.Click the rank badge to see the full State ranking.Click here to see the full State ranking.
Operating loss
-$326.9K
Payroll costs Info The portion of the home's budget spent on staff, including nurses, caregivers, and other employees who support care and operations. Rank #150 / 166Payroll — State benchmarkedThis home is ranked 150th out of 166 homes in Illinois. Shows total annual staff payroll benchmarked to the Illinois average. Higher payroll investment relative to peers often signals better staffing and less reliance on cheaper contract labor.Click the rank badge to see the full State ranking.Click here to see the full State ranking.
$3.8M
56.1% of revenue Rank #48 / 166Payroll % — State benchmarkedThis home is ranked 48th out of 166 homes in Illinois. Shows payroll as a percentage of revenue versus the Illinois average. Well-run Illinois SNFs typically land around 54–67% — the top third Statewide. Below 25% may signal understaffing or heavy agency use — read with Staffing ratings.Click the rank badge to see the full State ranking.Click here to see the full State ranking.
Other operating costs Info All remaining costs needed to run the home, such as food, utilities, building maintenance, supplies and administrative expenses.
$3.3M
Total costs $7.1M

What does this home offer?

Housing options icon

Housing Options: Private Rooms / Semi-Private Rooms

Building type icon
Building type icon

Building Type: Mid-rise

Transportation services icon

Transportation Services

Fitness and recreation icon

Fitness and Recreation

Who this home usually serves

TYPE OF STAY

Mix of rehab and long-term care

This home supports both short-term rehab and long-term care, with residents staying for a wide range of durations.

Places of interest near Alden Courts of Waterford

Address 3.8 miles from city center Info Estimated distance in miles from Aurora's city center to Alden Courts of Waterford's address, calculated via Google Maps. — 0.56 miles to nearest hospital (Rush Copley Medical Center)

Calculate Travel Distance to Alden Courts of Waterford

Add your location

Address

Financial Assistance for
Nursing Home in Illinois

Alden Courts of Waterford is located in Aurora, Illinois.
Here are the financial assistance programs available to residents in Illinois.

Get Financial aid guidance

Community Care Program

Illinois CCP

Age 60+
General Illinois resident, at risk of nursing home placement.
Income Limits (2025) ~$1,215/month individual
Asset Limits $17,500 individual, excludes home, car
IL

High demand in urban areas; waitlists possible.

Benefits
In-home care (3-5 hours/day) Adult day services ($65/day) Emergency home response systems ($30/month)

Illinois Respite Program

IL Respite (via NFCSP)

Age Caregiver of someone 60+ (or with dementia)
General Illinois resident.
Income Limits No strict limit; prioritizes low-income.
Asset Limits Not applicable.
IL

Limited slots; urban/rural balance.

Benefits
In-home respite (4-6 hours/day) Adult day care (~$65/day) Short-term facility care (up to 5 days)

Supportive Living Program (SLP)

Illinois Medicaid Supportive Living Program

Age 65+ or 22-64 with disability
General Illinois resident, Medicaid-eligible, needs moderate assistance (not nursing home-level).
Income Limits (2025) ~$2,829/month (300% FBR, individual); QIT allowed.
Asset Limits $2,000 (individual), $3,000 (couple) (excludes home, car).
IL

~200 SLP sites statewide; room/board not covered.

Benefits
Personal care (5-7 hours/day, e.g., bathing, mobility) Meals Housekeeping Medication management Respite (~240 hours/year)

Persons Who Are Elderly Waiver

Illinois Medicaid Elderly Waiver

Age 65+
General Illinois resident, Medicaid-eligible, nursing home-level care need.
Income Limits (2025) ~$2,829/month 300% FBR, individual
Asset Limits $2,000 (individual), $3,000 (couple).
IL

Part of HealthChoice Illinois; consumer-directed options available.

Benefits
Personal care (5-7 hours/day, e.g., dressing, eating) Homemaker Adult day care (~$60/day) Respite (240 hours/year) Home mods ($1,000 avg.)

Medicare Savings Program (MSP)

Illinois Medicare Savings Program

Age 65+ or disabled
General Illinois resident, Medicare Part A/B.
Income Limits (2025) ~$2,510/month (QMB), ~$3,380/month (SLMB), ~$3,598/month (QI)—individual.
Asset Limits $9,430 (individual), $14,130 (couple).
IL

Three tiers; no waitlist.

Benefits
Covers Part B premiums ($174.70/month) Deductibles ($240/year) Copays (~20%)

Optional State Supplementation (OSS)

Illinois Optional State Supplementation

Age 65+ or disabled
General Illinois resident, in approved facility, SSI recipient or low-income.
Income Limits (2025) ~$1,004/month including SSI
Asset Limits $2,000 (individual), $3,000 (couple).
IL

~$50-$500/month based on facility type.

Benefits
Cash (~$50-$500/month) for room/board in personal care homes or SLFs

VA Aid and Attendance (A&A) and Housebound Benefits

Illinois VA Aid and Attendance/Housebound

Age 65+ or disabled veteran/spouse
General Illinois resident, wartime service, need for ADL help (A&A) or homebound.
Income Limits (2025) Net income < ~$1,984/month (veteran with dependent, A&A); pension offsets income.
Asset Limits ~$155,356 net worth limit
IL

High veteran demand in urban/rural areas.

Benefits
Cash (~$1,433-$2,642/month veteran, ~$951-$1,318 spouse) for care costs (e.g., in-home, assisted living)

Frequently Asked Questions about Alden Courts of Waterford

Is Alden Courts of Waterford in a walkable area?

Alden Courts of Waterford has a walk score of 58. Moderately walkable. Some errands can be accomplished on foot, with a mix of nearby amenities.

What is the occupancy rate at Alden Courts of Waterford?

Alden Courts of Waterford's occupancy is 85.4%.

Are there photos of Alden Courts of Waterford?

Yes — there are 19 photos of Alden Courts of Waterford in the photo gallery on this page.

What is the phone number of Alden Courts of Waterford?

(630) 851-1466 will put you in contact with the team at Alden Courts of Waterford.

Is Alden Courts of Waterford Medicare or Medicaid certified?

Yes — Alden Courts of Waterford is a CMS-certified provider of Medicare and Medicaid.

Guides for Better Senior Living

Care Cost Calculator: See Prices in Your Area

Nursing Home Data Explorer

Don’t Wait Too Long: 7 Red Flag Signs Your Parent Needs Assisted Living Now

The True Cost of Assisted Living in 2025 – And How Families Are Paying For It

Understanding Senior Living Costs: Pricing Models, Discounts & Financial Assistance

Explore Open Rooms
1 Contact details
2 What type of senior care service are you looking for?
3 What budget do you have in mind for senior care?
4 How soon do you need to find care?
5 Additional details

Thank you for your interest!

Our team will be in touch shortly to help with next steps.