Total health inspections
3
Illinois average 10.4
Last Health inspection on Feb 2025

We arrange tours, appointments, and even moving support so you don’t have to
Thank you for your interest!
Our team will be in touch shortly to help with next steps.

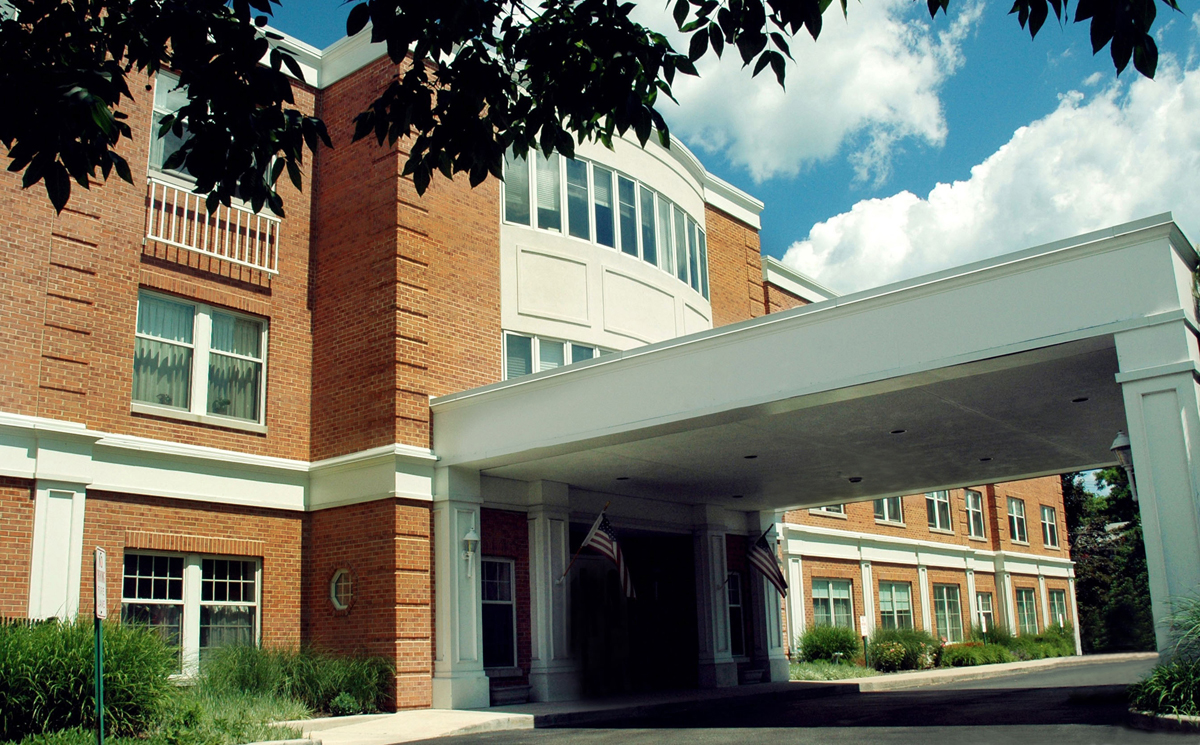


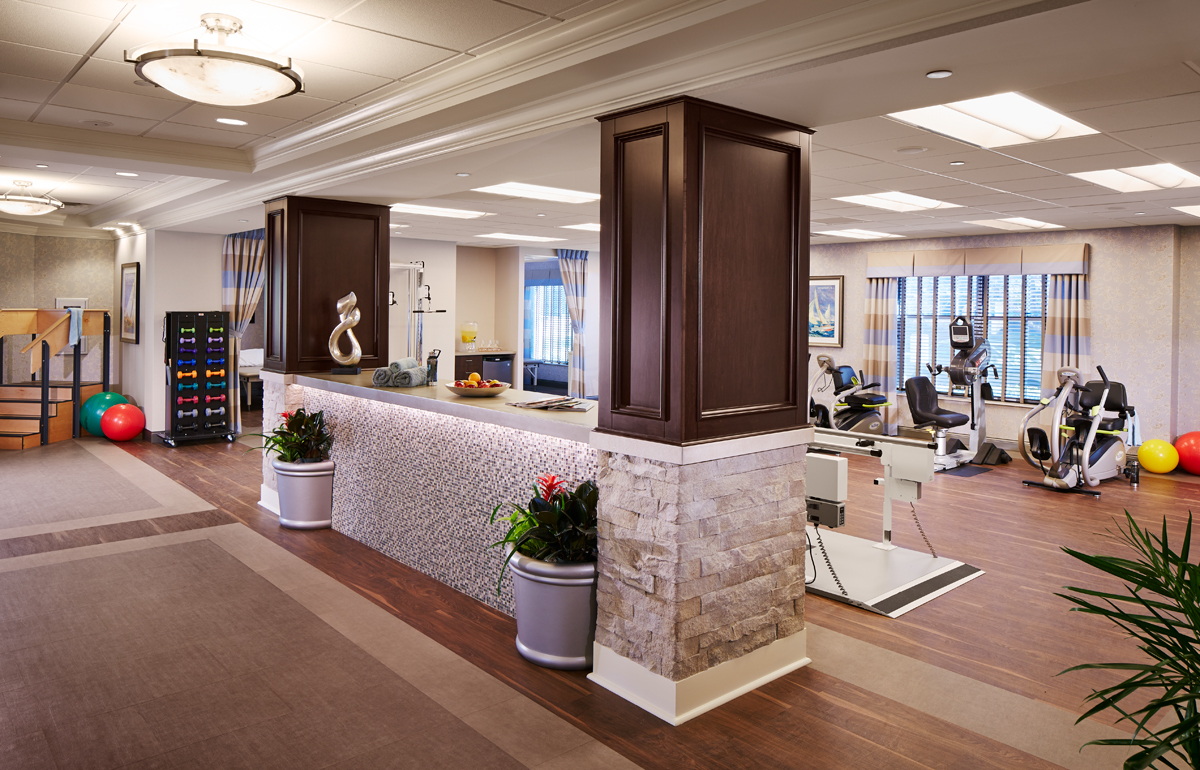


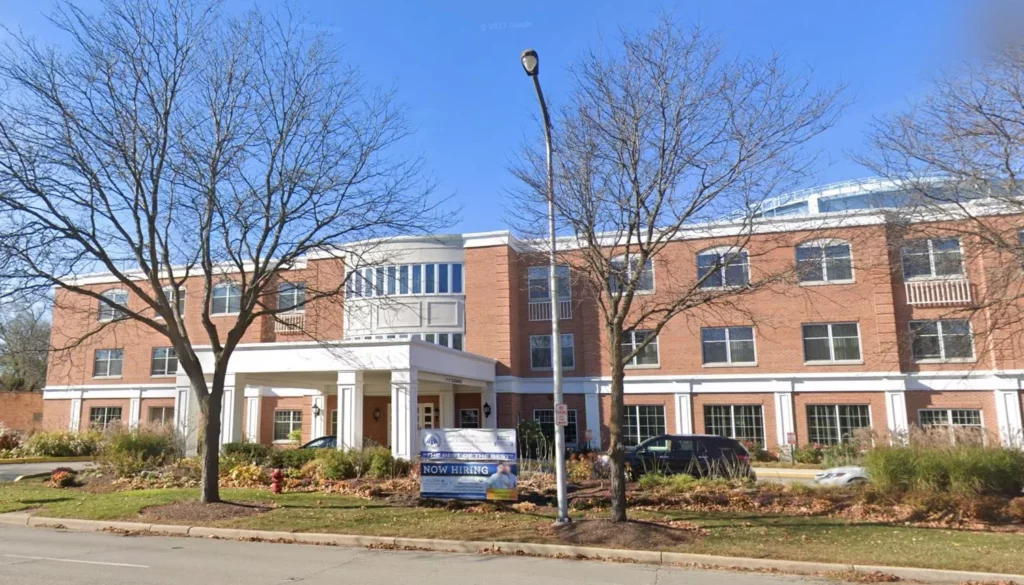
Alden Estates of Evanston offers exceptional personal care for residents of rehabilitation and post-acute care services. Expect elegance and luxury for seniors who want assisted living at its best. The spirited community performs nothing less than exceptional service offered by its professional and compassionate staff. Alden Estates is a home for seniors looking to thrive in the community.
The post-acute health center is all about satisfying the wellness of each senior through comfort, stability, and luxury resort-style features. Their personalized care includes daily health checks, medication management, housekeeping, ADLs, and scheduled activities. Other specific care programs include rehabilitative therapies, comprehensive nursing services, and comprehensive medical assistance.
May offer a more intimate, personalized care environment.
Lower occupancy suggests more openings may be available.
This home supports both short-term rehab and long-term care, with residents staying for a wide range of durations.
36% of new residents, usually for short-term rehab.
54% of new residents, often for short stays.
11% of new residents, often for long-term daily care.
Illinois average 10.4
Last Health inspection on Feb 2025
Illinois average 36.8
Illinois average 3.68
Health citations are formal notices following inspections when they fail to comply with safety and care standards.
8 of 9 citations resulted from standard inspections; and 1 of 9 resulted from complaint investigations.
Illinois average: 0.7
Illinois average: 3.6
Data sourced from CMS Health Deficiencies reports. Citation severity codes range from A (least serious) to L (most serious). Immediate Jeopardy (J-L) citations indicate situations where the facility's noncompliance has placed residents at risk of death or serious harm.
Assisted Living A licensed, long-term care setting for seniors or individuals with disabilities who need help with daily activities — like bathing, dressing, and medication management — but not 24-hour skilled nursing. Offers housing, meals, and around-the-clock support while aiming to maximize resident independence.
Nursing Home Licensed facility providing 24/7 skilled nursing care for residents with complex, ongoing medical needs. Staffed by RNs, LPNs, and CNAs. Inspected and star-rated annually by CMS. Accepts Medicare (short-term rehab) and Medicaid (long-term care).
Assisted Living A licensed, long-term care setting for seniors or individuals with disabilities who need help with daily activities — like bathing, dressing, and medication management — but not 24-hour skilled nursing. Offers housing, meals, and around-the-clock support while aiming to maximize resident independence.
Memory Care Secured, specialized care for people living with Alzheimer's or dementia. Staff trained in cognitive impairment, with higher staff-to-resident ratios and an environment designed to reduce confusion and wandering risk.
Nursing Home Licensed facility providing 24/7 skilled nursing care for residents with complex, ongoing medical needs. Staffed by RNs, LPNs, and CNAs. Inspected and star-rated annually by CMS. Accepts Medicare (short-term rehab) and Medicaid (long-term care).
Assisted Living A licensed, long-term care setting for seniors or individuals with disabilities who need help with daily activities — like bathing, dressing, and medication management — but not 24-hour skilled nursing. Offers housing, meals, and around-the-clock support while aiming to maximize resident independence.
Nursing Home Licensed facility providing 24/7 skilled nursing care for residents with complex, ongoing medical needs. Staffed by RNs, LPNs, and CNAs. Inspected and star-rated annually by CMS. Accepts Medicare (short-term rehab) and Medicaid (long-term care).
![]() 3.4 miles from city center — 6.76 miles to nearest hospital (Resurrection Medical Center - Emergency Fast Track)
3.4 miles from city center — 6.76 miles to nearest hospital (Resurrection Medical Center - Emergency Fast Track)
![]() 2520 Gross Point Rd, Evanston, IL 60201
2520 Gross Point Rd, Evanston, IL 60201
Add your location
This data corresponds to Q2 2025 and is based on CMS Payroll-Based Journal.
Illinois average ratio: 1.90:1
Illinois average: 7.6 hours
Manages medical care and health needs.
This role is partially covered by contractors.
Assists with medical care and medications.
This role is partially covered by contractors.
Helps with daily care and mobility.
This role is partially covered by contractors.
Total hours from contractors
5,288 contractor hours this quarter
| Certified Nursing Assistant | 32 | 23 | 55 | 12,151 | 91 | 100% | 8 |
| Licensed Practical Nurse | 11 | 6 | 17 | 4,728 | 91 | 100% | 8.1 |
| Registered Nurse | 15 | 9 | 24 | 4,554 | 91 | 100% | 7.8 |
| Other Dietary Services Staff | 6 | 0 | 6 | 1,597 | 90 | 99% | 7 |
| Speech Language Pathologist | 0 | 10 | 10 | 1,320 | 77 | 85% | 6.9 |
| Respiratory Therapy Technician | 0 | 8 | 8 | 1,291 | 87 | 96% | 6.9 |
| Physical Therapy Aide | 0 | 6 | 6 | 1,152 | 75 | 82% | 7.7 |
| Physical Therapy Assistant | 0 | 6 | 6 | 707 | 71 | 78% | 8 |
| Administrator | 1 | 0 | 1 | 480 | 60 | 66% | 8 |
| Nurse Practitioner | 1 | 0 | 1 | 448 | 61 | 67% | 7.3 |
| Clinical Nurse Specialist | 1 | 0 | 1 | 410 | 55 | 60% | 7.5 |
| Qualified Social Worker | 0 | 1 | 1 | 247 | 63 | 69% | 3.9 |
| Occupational Therapy Aide | 0 | 1 | 1 | 164 | 25 | 27% | 6.6 |
| Mental Health Service Worker | 1 | 0 | 1 | 136 | 18 | 20% | 7.5 |
| Dental Services Staff | 1 | 0 | 1 | 120 | 15 | 16% | 8 |
| Dietitian | 1 | 0 | 1 | 86 | 11 | 12% | 7.8 |
| Medical Director | 0 | 1 | 1 | 18 | 15 | 16% | 1.2 |
| Therapeutic Recreation Specialist | 0 | 1 | 1 | 8 | 1 | 1% | 8 |
Source: CMS Long-Term Care Facility Characteristics (Data as of Jan 2026)
Residents meet regularly to discuss policies, care quality, and activities
Organized group of residents that meets regularly to discuss facility policies, quality of life, and activities.
Data sourced from CMS Long-Term Care Facility Characteristics quarterly report. Payer mix reflects the current resident census by primary payment source.
These measures show how residents usually do over time at this home, based on health outcomes and preventive care.
Illinois average: 9.7
Illinois average: 18.6
Illinois average: 15.5%
Illinois average: 18.4%
Illinois average: 21.6%
Illinois average: 3.4%
Illinois average: 5.3%
Illinois average: 1.8%
Illinois average: 6.5%
Illinois average: 48.1%
Illinois average: 20.2%
Illinois average: 89.2%
Illinois average: 91.6%
Illinois average: 2.05
Illinois average: 2.25
Illinois average: 68.3%
Illinois average: 2.3%
Illinois average: 63.0%
Illinois average: 26.2%
Illinois average: 14.0%
Illinois average: 0.8%
Illinois average: 53.7%
Illinois average: 50.6%
Quality measures are calculated from Minimum Data Set (MDS) assessments. For most measures, lower percentages indicate better care quality.
Historical financial and operational data for Alden Estates of Evanston Rehabilitation and Post Acute Health Care based on CMS SNF Cost Reports.
Loading trend charts...
Care Cost Calculator: See Prices in Your Area
Nursing Home Data Explorer
Don’t Wait Too Long: 7 Red Flag Signs Your Parent Needs Assisted Living Now
The True Cost of Assisted Living in 2025 – And How Families Are Paying For It
Understanding Senior Living Costs: Pricing Models, Discounts & Financial Assistance

Touring a community? Use this expert-backed checklist to stay organized, ask the right questions, and find the perfect fit.
We'll send you a PDF version of the touring checklist.