Dobson Plaza Rehabilitation and Healthcare
Nursing Home, Nursing Care, Palliative Care & Respite Care · Evanston, IL
CMS overall rating Info CMS (the Centers for Medicare & Medicaid Services) is the federal agency that rates nursing home quality. Its Overall Rating runs from 1 to 5 stars, combining health inspections, staffing, and quality measures, with inspections weighted most heavily.

Dobson Plaza Rehabilitation and Healthcare

Nursing Home, Nursing Care, Palliative Care & Respite Care · Evanston, IL
CMS overall rating Info CMS (the Centers for Medicare & Medicaid Services) is the federal agency that rates nursing home quality. Its Overall Rating runs from 1 to 5 stars, combining health inspections, staffing, and quality measures, with inspections weighted most heavily.
Calculator: See prices in your area
Dobson Plaza Rehabilitation and Healthcare accepts Medicaid, Medicare, and private pay.

Overview of Dobson Plaza Rehabilitation and Healthcare

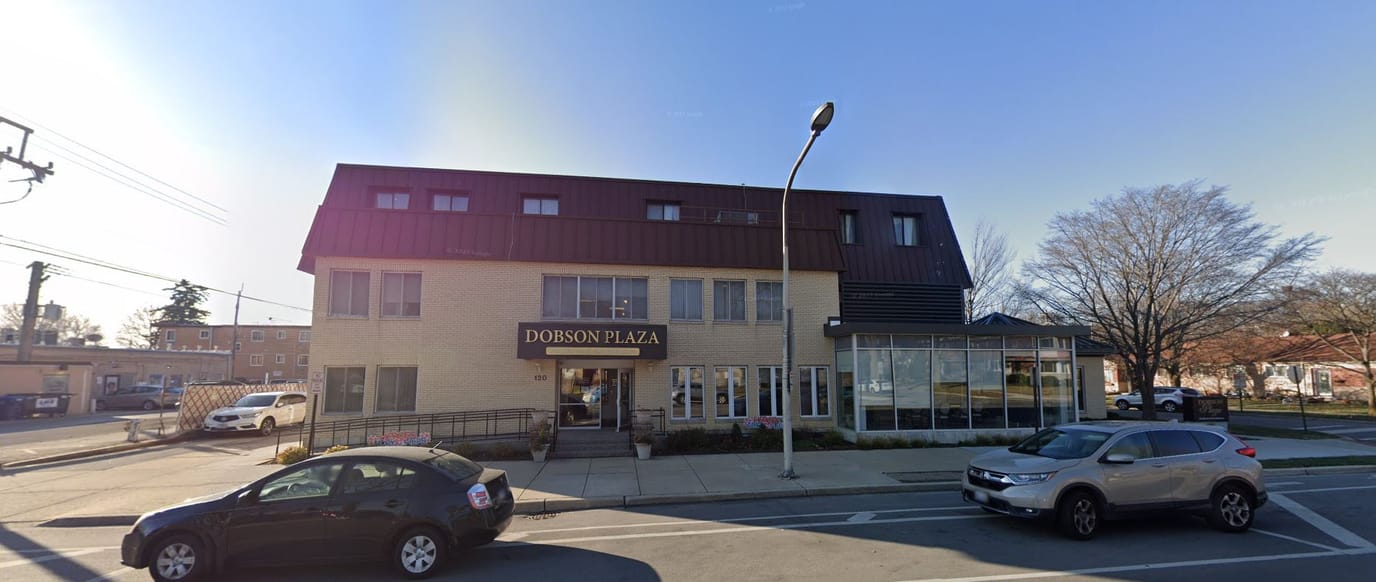
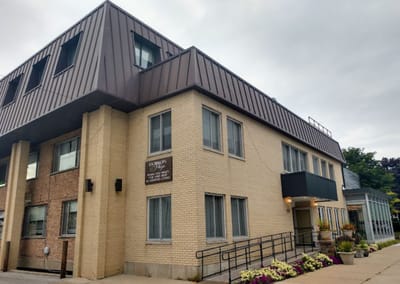
Dobson Plaza Rehabilitation and Healthcare is a skilled nursing facility that extends its services to include memory care living, long-term care, and rehabilitative care. This facility is dedicated to fostering patient well-being, making it more likely for seniors to return home as soon as possible. They operate as a close-knit, family-oriented community, creating an intimate and home-like atmosphere for all. Also conveniently located in Evanston, Illinois, Dobson Plaza offers a range of amenities, including an inviting open courtyard and salon and barber services.

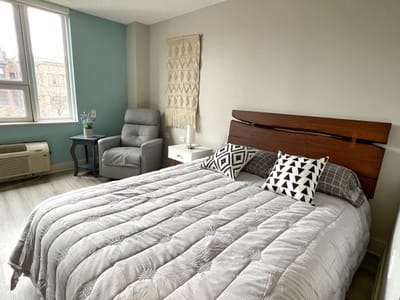
As a memory care center, the home ensures specialized care for those with memory-related needs. The facility’s commitment to enhancing residents’ quality of life is reflected in their diverse range of stimulating recreation activities and spacious visiting areas, both indoors and outdoors, designed to strengthen family bonds. Residents can also unwind in comfortable lounges equipped with flat-screen TVs while enjoying a nutritious dining experience. Dobson Plaza Rehabilitation and Healthcare offers seniors a rejuvenating and worthwhile stay, making it a valuable choice for their healthcare requirements.

Quality ratings

Measured by Centers for Medicare & Medicaid Services (CMS)

Overall rating Info The Overall CMS Rating combines results from health inspections, staffing levels and quality measures. Health inspections carry the most weight. Staffing and quality scores can increase or decrease the final rating based on performance compared to state and national standards.
▲ 98.4% Above IL avg. ▲ 98.4% Above IL avg.IL average: 2.5Click the badge to see the full State ranking.Click here to see the full State ranking.
Health Inspection Info Based on the results of the facility's three most recent standard inspections and any complaint investigations. CMS reviews the number, scope, and severity of deficiencies, with more recent findings weighted more heavily.
▲ 80.1% Above IL avg. ▲ 80.1% Above IL avg.IL average: 2.8Click the badge to see the full State ranking.Click here to see the full State ranking.
Staffing Info Measures average nursing staff hours per resident per day, including Registered Nurses (RNs) and total nursing staff. Ratings are adjusted based on the level of care residents require and are compared to state and national benchmarks.
▲ 40.4% Above IL avg. ▲ 40.4% Above IL avg.IL average: 2.1Click the badge to see the full State ranking.Click here to see the full State ranking.
Quality Measures Info Based on clinical and physical health indicators reported to CMS, such as hospital readmissions, falls, pressure ulcers, and improvements in mobility. These measures reflect how well residents' health needs are being managed.
▲ 6.6% Above IL avg. ▲ 6.6% Above IL avg.IL average: 2.8Click the badge to see the full State ranking.Click here to see the full State ranking.

Staffing hours breakdown

Info Daily nursing hours per resident by staff type, reported to CMS. Higher is generally better — compare this facility to state and national averages to see where staffing stands.

Hours per resident per day — compared to Illinois state averages

Total nursing care / resident Info This home is ranked 137th out of 172 homes in Illinois for nurse hours. Total adjusted nursing hours per resident per day, combining RN, LPN, and aide time. CMS adjusts this for case-mix so facilities can be fairly compared.
2h 24m per day
Rank #137 / 172Nurse hours — State benchmarkedThis home is ranked 137th out of 172 homes in Illinois. Shows adjusted nurse hours per resident per day benchmarked to the Illinois average, with a ranking across 172 Illinois facilities. More hours mean more direct care. The national average is about 3.5 hrs; below 3.0 is a red flag.Rankings are based only on facilities in Illinois that report data for that category. Facilities without available data are excluded from the ranking.Click the rank badge to see the full State ranking.Click here to see the full State ranking.
This facility Illinois avg (3h 6m per day)
vs Illinois avg
-23%

3 of 6 metrics below state avg

Standout metric Physical Therapist is +140% above state avg
Staff typeHours / Day / Residentvs state avg
Registered Nurse (RN) Info RNs hold the highest nursing license and can assess residents, interpret test results, and direct care plans. More RN hours per day often signals stronger clinical oversight and faster response to health changes. 50m per day ▲ 13% State avg: 44m per day · National avg: 41m per day
LPN / LVN Info Licensed Practical Nurses (LPNs) or Licensed Vocational Nurses (LVNs) deliver routine hands-on care — medication administration, wound dressing, and monitoring vital signs. They work under RN supervision and make up a large share of daily bedside care. 5m per day ▼ 86% State avg: 38m per day · National avg: 52m per day
Nurse Aide Info Certified Nurse Aides (CNAs) provide the most direct day-to-day assistance: bathing, dressing, feeding, and mobility. Nurse aide hours are typically the largest staffing category and directly affect residents' quality of life. 1h 58m per day ▼ 7% State avg: 2h 8m per day · National avg: 2h 21m per day
Weekend Total Nursing Info Combined nursing hours (RN + LPN + Nurse Aide) per resident per day on weekends. Staffing often drops on weekends — this figure reveals whether the facility maintains adequate coverage outside of weekday hours. 2h 45m per day ▼ 11% State avg: 3h 5m per day · National avg: 3h 26m per day
Physical Therapist Info Hours per resident per day provided by licensed Physical Therapists (PTs) or PT Assistants. PT services help residents recover mobility after injury or illness and are especially important for post-acute (short-stay) rehabilitation. 7m per day ▲ 140% State avg: 3m per day · National avg: 4m per day
Weekend RN Info Registered nurse hours specifically on weekends. Facilities sometimes reduce RN presence on Saturdays and Sundays — a low weekend RN figure compared to weekday hours can indicate reduced clinical oversight when most administrative staff are absent. 45m per day ▲ 34% State avg: 34m per day · National avg: 29m per day

Capacity and availability

Avg. Length of Stay
135 days
Bed community size
97-bed community Rank #132 / 426Bed count — State benchmarkedThis home is ranked 132nd out of 426 homes in Illinois. Shows this facility's certified or reported bed count compared to other Illinois facilities. Larger communities may offer more amenities, programs, and on-site services for residents and families.Rankings are based only on facilities in Illinois that report data for that category. Facilities without available data are excluded from the ranking.Click the rank badge to see the full State ranking.Click here to see the full State ranking.
A larger shared setting that may offer more common spaces and organized community services.
Years in operation
21 years in operation Rank #64 / 145Years in operation — State benchmarkedThis home is ranked 64th out of 145 homes in Illinois. Shows how long this facility has been in operation compared to other Illinois facilities. Longer operating histories may benefit residents, families, and staff.Rankings are based only on facilities in Illinois that report data for that category. Facilities without available data are excluded from the ranking.Click the rank badge to see the full State ranking.Click here to see the full State ranking.
A longer operating history, which may indicate experience navigating regulations and delivering ongoing care.
Walk Score
Walk Score: 74 / 100 Rank #135 / 648Walk Score — State benchmarkedThis home is ranked 135th out of 648 homes in Illinois. Shows how walkable this facility's neighborhood is compared to the average Walk Score across Illinois facilities. Higher scores benefit residents, families, and staff.Rankings are based only on facilities in Illinois that report data for that category. Facilities without available data are excluded from the ranking.Click the rank badge to see the full State ranking.Click here to see the full State ranking.
Very walkable. Most errands can be accomplished on foot, and many essentials are within a short walk.
BBB Rating
BBB Rating: A+ (Not Accredited)
An independent rating from the Better Business Bureau based on factors such as complaint history, transparency, and business practices.
How BBB ratings work

Staffing

Key information about the people who lead and staff this community.

Leadership

ContactCharlotte Kohn, President

Payment & Insurance

2 services
Accept Medicaid
Accept Medicare

Therapy & Rehabilitation

2 services
Rehabilitation Services
Respite Care

Amenities & Lifestyle

Well-Appointed Patient Rooms
Delectable And Nutritious Dining
Open Courtyard
Bright & Airy Lounges
Complimentary Wifi & Cable
Housekeeping
Laundry
Salon & Barber Services
Religious Services
Stimulating Recreation Activities
Specific ProgramsSubacute Rehab
Religious ServicesYes

Dining & Nutrition

Food DescriptionDelectable and nutritious dining with a variety of menu selections.

Contact Dobson Plaza Rehabilitation and Healthcare

Inspection History

In Illinois, the Department of Public Health, Office of Health Care Regulation conducts annual unannounced surveys to assess compliance with state and federal healthcare facility standards.

Since 2023 · 3 years of data 13 deficiencies 4 inspections

Inspection Scorecard Info This scorecard compares key inspection, citation, and complaint metrics at this facility against the Illinois state average. Metrics rated ≥15% worse than average are highlighted in red; those ≥15% better are highlighted in green.

Since 2023 vs. Illinois state average
Overall vs. IL average 3 Worse Metrics worse than Illinois average:
• Total deficiencies (86% above)
• Deficiencies per year (87% above)
• Deficiencies per inspection (267% above)
1 Better Metrics better than Illinois average:
• Total inspections (50% below)
Latest Inspection August 7, 2025 Other An inspection that falls outside standard annual surveys and formal complaint investigations. May include administrative compliance checks, documentation reviews, focused surveys on specific concerns, or revisit surveys to verify prior corrections.

Deficiencies Info Deficiencies are formal regulatory issues recorded during state inspections.

This FacilityIL Averagevs. IL Avg
Total deficiencies Info Formal regulatory issues recorded by inspectors across all inspection types. 137 This facility has 86% more total deficiencies than a typical Illinois nursing home (13 vs. IL avg 7).↑ 86% worse
Deficiencies per year Info Average deficiencies per year since 2023. 4.32.3 This facility has 87% more deficiencies per year than a typical Illinois nursing home (4.3 vs. IL avg 2.3).↑ 87% worse
Deficiencies per inspection Info Average deficiencies per inspection. 3.30.9 This facility has 267% more deficiencies per inspection than a typical Illinois nursing home (3.3 vs. IL avg 0.9).↑ 267% worse

Inspections Info State inspections evaluate whether the facility meets health and safety standards.

This FacilityIL Averagevs. IL Avg
Total inspections Info Combined count of all routine and focused inspections. Excludes complaint investigations. 48 This facility has 50% fewer total inspections than a typical Illinois nursing home (4 vs. IL avg 8).↓ 50% better

Health Inspection History

Inspections since 2022
Total health inspections 3

Illinois average 10.4


Last Health inspection on Jun 2024

Total health citations
16 Rank #24 / 172Health citations — State benchmarkedThis home is ranked 24th out of 172 homes in Illinois. Shows this facility's total health deficiency citations benchmarked to the Illinois State average, with a ranking across all 172 IL facilities. Lower citation counts earn a better rank.Rankings are based only on facilities in Illinois that report data for that category. Facilities without available data are excluded from the ranking.Click the rank badge to see the full State ranking.Click here to see the full State ranking.

Illinois average 36.8

Citations per inspection
5.33 Rank #154 / 172Citations per inspection — State benchmarkedThis home is ranked 154th out of 172 homes in Illinois. Shows average deficiency citations per CMS inspection for this facility versus the Illinois mean across 172 facilities with citation data. Lower is better.Rankings are based only on facilities in Illinois that report data for that category. Facilities without available data are excluded from the ranking.Click the rank badge to see the full State ranking.Click here to see the full State ranking.

Illinois average 3.68


Health citations are formal notices following inspections when they fail to comply with safety and care standards.

All 16 citations resulted from standard inspections.

Breakdown of citation severity (last 4 years)
Critical health citations
0
100% better than Illinois average

Illinois average: 0.7


Serious health citations
1
72% better than Illinois average

Illinois average: 3.6

0 critical citations Illinois average: 0.7

1 serious citation Illinois average: 3.6

14 moderate citations Illinois average: 32

1 minor citation Illinois average: 0.5
Citations history (last 4 years)
Abuse/Neglect moderate citation Jun 13, 2024
Corrected

Abuse/Neglect moderate citation Jun 13, 2024
Corrected

Nutrition moderate citation Jun 13, 2024
Corrected

Care Planning moderate citation Jun 13, 2024
Corrected

Staffing Data

Reporting period: October 1 – December 31, 2025 (Q4 2025). Source: CMS Payroll-Based Journal report.

Total staff 88
Employees 82
Contractors 6
Staff to resident ratio 1.06 : 1
41% fewer staff per resident than Illinois average
Illinois average ratio: 1.80 : 1 Illinois average ratio: 1.80 : 1See full Illinois ranking
Avg staff/day 40
Average shift 7.2 hours
5% worse than Illinois average
Illinois average: 7.6 hours Illinois average shift: 7.6 hoursSee full Illinois ranking
Total staff hours (quarter) 26,646

Nursing staff breakdown

Q4 2025 · Oct 1 – Dec 31 More info This data comes from the CMS Payroll-Based Journal report covering October 1 – December 31, 2025.
Registered Nurse

Manages medical care and health needs.

RN Staff Info All 18 RN Staff are full-time employees. No contractors work on this role. 18
Average shift length Info Average shift length. Calculated as total hours divided by days worked and average staff per day. 8.3 hours
Licensed Practical Nurse

Assists with medical care and medications.

LPN Staff Info All 2 LPN Staff are full-time employees. No contractors work on this role. 2
Average shift length Info Average shift length. Calculated as total hours divided by days worked and average staff per day. 8 hours
Certified Nursing Assistant

Helps with daily care and mobility.

CNA Staff Info All 38 CNA Staff are full-time employees. No contractors work on this role. 38
Average shift length Info Average shift length. Calculated as total hours divided by days worked and average staff per day. 7.6 hours

Contractor staffing

Q4 2025 · Oct 1 – Dec 31 More info This data comes from the CMS Payroll-Based Journal report covering October 1 – December 31, 2025.

Total hours from contractors

0.5%

127 contractor hours this quarter

Dietitian: 3 Medical Director: 1 Occupational Therapy Aide: 1 Physician Assistant: 1

Staff by category

Q4 2025 · Oct 1 – Dec 31 More info This data comes from the CMS Payroll-Based Journal report covering October 1 – December 31, 2025.
Certified Nursing Assistant3803815,23492100%7.6
Registered Nurse180186,04392100%8.3
Other Dietary Services Staff6061,61092100%6.9
Respiratory Therapy Technician5059257784%6.3
Licensed Practical Nurse2027017582%8
Mental Health Service Worker1015286672%8
Administrator1013806672%5.8
Nurse Practitioner1013704549%8.2
Physical Therapy Assistant2023686773%5.4
Qualified Social Worker4041495054%3
Speech Language Pathologist2021383538%3.6
Physical Therapy Aide101722325%3.1
Occupational Therapy Aide112641415%4.5
Dietitian033402729%1
Medical Director011131314%1
Physician Assistant011131314%1
38 Certified Nursing Assistant
% of Days 100%
18 Registered Nurse
% of Days 100%
6 Other Dietary Services Staff
% of Days 100%
5 Respiratory Therapy Technician
% of Days 84%
2 Licensed Practical Nurse
% of Days 82%
1 Mental Health Service Worker
% of Days 72%
1 Administrator
% of Days 72%
1 Nurse Practitioner
% of Days 49%
2 Physical Therapy Assistant
% of Days 73%
4 Qualified Social Worker
% of Days 54%
2 Speech Language Pathologist
% of Days 38%
1 Physical Therapy Aide
% of Days 25%
2 Occupational Therapy Aide
% of Days 15%
3 Dietitian
% of Days 29%
1 Medical Director
% of Days 14%
1 Physician Assistant
% of Days 14%

Penalties and fines

Federal penalties imposed by CMS for regulatory violations, including civil money penalties (fines) and denials of payment for new Medicare/Medicaid admissions.

Source: CMS Penalties Database (Data as of Jan 2026)

Total fines amount $19K Rank #1 / 173Federal fines — State benchmarkedThis home is ranked 1st out of 173 homes in Illinois. Shows this facility's cumulative CMS federal fine dollars versus the Illinois average among facilities with fines, and where it ranks among 173 facilities in the pool. Lower total dollars mean a better rank.Rankings are based only on facilities in Illinois that report data for that category. Facilities without available data are excluded from the ranking.Click the rank badge to see the full State ranking.Click here to see the full State ranking.
86% lower than Illinois average

Illinois average: $143K

Number of fines 1
66% fewer fines than Illinois average

Illinois average: 3.0

Payment Denials Info Serious action where Medicare and/or Medicaid temporarily stops payments for new residents until issues are fixed. 0
100% fewer payment denials than Illinois average

Illinois average: 1.1

Fines amount comparison
This facility $19K
Illinois average $143K

No penalties in the past 3 years

No civil money penalties or payment denials were reported in the last 3 years.

Quality of care over time

These measures show how residents usually do over time at this home, based on health outcomes and preventive care.

High-risk clinical events score Info A composite score based on pressure ulcers, falls with injury, weight loss, walking ability decline, and activities of daily living decline. 8.0
17% better than Illinois average

Illinois average: 9.7

Functional decline score Info A composite score based on activities of daily living decline, walking ability decline, and incontinence. 10.3
45% better than Illinois average

Illinois average: 18.6

Long-stay resident measures
Above average Info CMS star rating based on long-stay quality measure performance. 5 stars = significantly above average, 1 star = significantly below average.
Need for Help with Daily Activities Increased Info Percent of long-stay residents whose need for help with daily activities has increased 11.4%
26% better than Illinois average

Illinois average: 15.5%

Walking Ability Worsened Info Percent of long-stay residents whose ability to move independently worsened 13.3%
28% better than Illinois average

Illinois average: 18.4%

Low Risk Residents with Bowel/Bladder Incontinence Info Percent of low risk long-stay residents who lose control of their bowels or bladder 6.1%
72% better than Illinois average

Illinois average: 21.6%

Falls with Major Injury Info Percent of long-stay residents experiencing one or more falls with major injury 3.6%
7% worse than Illinois average

Illinois average: 3.4%

High Risk Residents with Pressure Ulcers Info Percent of long-stay high risk residents with pressure ulcers 5.2%
In line with Illinois average

Illinois average: 5.3%

Urinary Tract Infection Info Percent of long-stay residents with a urinary tract infection 8.1%
350% worse than Illinois average

Illinois average: 1.8%

Lost Too Much Weight Info Percent of long-stay residents who lose too much weight 6.5%
In line with Illinois average

Illinois average: 6.5%

Depressive Symptoms Info Percent of long-stay residents who have depressive symptoms 82.5%
71% worse than Illinois average

Illinois average: 48.1%

Antipsychotic Use Info Percent of long-stay residents who received an antipsychotic medication 24.3%
20% worse than Illinois average

Illinois average: 20.2%

Pneumococcal Vaccine Info Percent of long-stay residents assessed and appropriately given the pneumococcal vaccine 91.5%
In line with Illinois average

Illinois average: 89.2%

Influenza Vaccine Info Percent of long-stay residents assessed and appropriately given the seasonal influenza vaccine 91.9%
In line with Illinois average

Illinois average: 91.6%

Hospitalizations per 1,000 days Info Number of hospitalizations per 1,000 long-stay resident days. 1.66
19% better than Illinois average

Illinois average: 2.05

ED visits per 1,000 days Info Number of outpatient emergency department visits per 1,000 long-stay resident days. 1.03
54% better than Illinois average

Illinois average: 2.25

Short-stay resident measures
Below average Info CMS star rating based on short-stay quality measure performance. 5 stars = much above average, 1 star = much below average.
Pneumococcal Vaccine Info Percent of short-stay residents assessed and appropriately given the pneumococcal vaccine 92.5%
35% better than Illinois average

Illinois average: 68.3%

Antipsychotic medication increase Info Percent of short-stay residents who newly received an antipsychotic medication 10.9%
365% worse than Illinois average

Illinois average: 2.3%

Influenza Vaccine Info Percent of short-stay residents assessed and appropriately given the seasonal influenza vaccine 50.0%
21% worse than Illinois average

Illinois average: 63.0%

Re-hospitalized after SNF stay Info Percentage of short-stay residents who were re-hospitalized after their nursing home admission. 13.9%
47% better than Illinois average

Illinois average: 26.2%

Emergency department visits Info Percentage of short-stay residents who had an outpatient emergency department visit. 12.2%
13% better than Illinois average

Illinois average: 14.0%

Falls with major injury Info Percentage of SNF residents who experience falls with major injury during their stay. 0.0%
100% better than Illinois average

Illinois average: 0.8%

Ability to care for self at discharge Info Percentage of residents at or above expected ability to care for themselves at discharge. 38.9%
28% worse than Illinois average

Illinois average: 53.7%

Successful return to home or community Info Rate of successful return to home or community from a skilled nursing facility. 42.6%
16% worse than Illinois average

Illinois average: 50.6%

Breakdown by payment type

Medicare

13% of new residents, usually for short-term rehab.

Typical stay 2 - 3 months

Private pay

44% of new residents, often for short stays.

Typical stay 5 - 6 months

Medicaid

44% of new residents, often for long-term daily care.

Typical stay 22 days

Facility Characteristics

Source: CMS Long-Term Care Facility Characteristics (Data as of Jan 2026)

Total residents 83
Medicare
7
8.4% of residents
Medicaid
37
44.6% of residents
Private pay or other
39
47% of residents
Programs & Services
Residents Group

Residents meet regularly to discuss policies, care quality, and activities

Active Resident Council

Organized group of residents that meets regularly to discuss facility policies, quality of life, and activities.

Finances and operations

Based on CMS SNF Cost Report for fiscal year ending in 12/2023.

Privately-owned community
Operated by a single business entity.
Net patient revenue Info Net patient revenue — what the home actually collects for resident care, after contractual allowances, bad debt and discounts are subtracted from its gross charges (CMS cost report, Worksheet G-3). It covers resident care only; money the home earns from other sources is shown separately as "Other income."
-$8.4M
Net patient income Info Net patient income: net patient revenue minus the home's total operating expenses. A positive figure means it earns more from resident care than it spends to deliver it; a negative figure means the opposite. It excludes non-operating "other income."
-$16.8M
Privately-owned community Operated by a single business entity.
Net patient revenue Info Net patient revenue — what the home actually collects for resident care, after contractual allowances, bad debt and discounts are subtracted from its gross charges (CMS cost report, Worksheet G-3). It covers resident care only; money the home earns from other sources is shown separately as "Other income."
-$8.4M Rank #171 / 171Revenue — State benchmarkedThis home is ranked 171st out of 171 homes in Illinois. Shows this facility's annual revenue compared to the Illinois average. Higher revenue generally means more resources for staffing and capital — read alongside Payroll %.Rankings are based only on facilities in Illinois that report data for that category. Facilities without available data are excluded from the ranking.Click the rank badge to see the full State ranking.Click here to see the full State ranking.
Net patient income Info Net patient income: net patient revenue minus the home's total operating expenses. A positive figure means it earns more from resident care than it spends to deliver it; a negative figure means the opposite. It excludes non-operating "other income."
-$16.8M
Other income Info Money the home earns outside of resident care — such as investments, grants, rentals and other non-operating sources (CMS cost report, Worksheet G-3). It is tracked separately from net patient revenue: it is not part of that figure, and it is not included in net patient income.
$209.7K
Payroll costs Info Staff salaries plus wage-related costs — benefits such as payroll taxes, health insurance and retirement — from the home's own accounting records (CMS cost report, Worksheet A). Contract or agency labor is counted separately, under other operating costs. Rank #147 / 171Payroll — State benchmarkedThis home is ranked 147th out of 171 homes in Illinois. Shows total annual staff payroll benchmarked to the Illinois average. Higher payroll investment relative to peers often signals better staffing and less reliance on cheaper contract labor.Rankings are based only on facilities in Illinois that report data for that category. Facilities without available data are excluded from the ranking.Click the rank badge to see the full State ranking.Click here to see the full State ranking.
$4.5M -53.7% of net patient revenue Info Payroll as a share of revenue: staff salaries and wage-related benefits divided by net patient revenue. A higher figure means more of each revenue dollar goes to staff pay. Rank #1 / 171Payroll % — State benchmarkedThis home is ranked 1st out of 171 homes in Illinois. Shows payroll as a percentage of revenue versus the Illinois average. Well-run Illinois facilities typically land around 54–67% — the top third Statewide. Below 25% may signal understaffing or heavy agency use — read with Staffing ratings.Rankings are based only on facilities in Illinois that report data for that category. Facilities without available data are excluded from the ranking.Click the rank badge to see the full State ranking.Click here to see the full State ranking.
Other operating costs Info Everything it costs to run the home apart from payroll — food, utilities, supplies, maintenance, contract labor and administration. Calculated as total operating expense minus payroll (staff salaries and wage-related benefits).
$3.8M
Total costs Info The home's total operating expense for the year — all the costs of running it, salaries included (CMS cost report, Worksheet G-3).
$8.3M

What does this home offer?

Housing options icon

Housing Options: Private Rooms

Building type icon
Building type icon

Building Type: 3-story

Transportation services icon

Transportation Services

Fitness and recreation icon

Fitness and Recreation

Who this home usually serves

TYPE OF STAY

Mostly long-term care residents

Most residents stay for extended periods and receive ongoing daily care.

New residents most often arrive under private pay (44% of admissions), and a typical private pay stay runs around 5 - 6 months.

Admissions
229 total

Coverage residents most often arrive under.

Medicare 13%
Private pay 44%
Medicaid 44%
Discharges
229 total

Coverage residents most often leave under.

Medicare 13%
Private pay 44%
Medicaid 44%

Places of interest near Dobson Plaza Rehabilitation and Healthcare

Address 2.3 miles from city center Info Estimated distance in miles from Evanston's city center to Dobson Plaza Rehabilitation and Healthcare's address, calculated via Google Maps. — 6.25 miles to nearest hospital (Resurrection Medical Center - Emergency Fast Track)

Calculate Travel Distance to Dobson Plaza Rehabilitation and Healthcare

Add your location

Address

Compare Nursing Homes around Evanston

The information below is reported by the Illinois Department of Public Health, Office of Health Care Regulation.

5 facilities compared · CMS & IL Dept. of Health data

Westminster Place
NH
AL
IL
MC
RC
Evanston (Grant Street)
105
Facility 105
IL AVG 86
Rank #116 / 426
64.8%
Facility 64.8%
IL AVG 69.3%
Rank #140 / 204
-6%
5.50
Facility 5.50
IL AVG 3.10
Rank #9 / 172
+47%+77%
$0
Facility $0
IL AVG $151.3k
Rank #1 / 173
7
Facility 7
IL AVG 36.8
Rank #5 / 172
2.3
Facility 2.3
IL AVG 3.7
Rank #15 / 172
-60-
44
Facility 44
IL AVG 51
Rank #392 / 648
Presbyterian Homes
$26.3M
Facility $26.3M
IL AVG $12.2M
Rank #2 / 171
$15.3M
Facility $15.3M
IL AVG $4.8M
Rank #8 / 171
58.2%
Facility 58.2%
IL AVG 44.3%
Rank #167 / 171
145026
The Mather
NH
AL
IL
MC
Evanston (Davis Street)
22
Facility 22
IL AVG 86
Rank #401 / 426
76.3%
Facility 76.3%
IL AVG 69.3%
Rank #95 / 204
+10%
5.88
Facility 5.88
IL AVG 3.10
Rank #5 / 172
+102%+90%
$0
Facility $0
IL AVG $151.3k
Rank #1 / 173
7
Facility 7
IL AVG 36.8
Rank #5 / 172
3.5
Facility 3.5
IL AVG 3.7
Rank #82 / 172
-30-
95
Facility 95
IL AVG 51
Rank #18 / 648
Mather Senior Living Communities LLC
$24.7M
Facility $24.7M
IL AVG $12.2M
Rank #41 / 171
$10.8M
Facility $10.8M
IL AVG $4.8M
Rank #29 / 171
43.6%
Facility 43.6%
IL AVG 44.3%
Rank #90 / 171
146145
Dobson Plaza Rehabilitation and Healthcare
NH
NC
PC
RC
Evanston (Dodge Avenue)
97
Facility 97
IL AVG 86
Rank #132 / 426
--
2.39
Facility 2.39
IL AVG 3.10
Rank #137 / 172
+45%-23%
$0
Facility $0
IL AVG $151.3k
Rank #1 / 173
16
Facility 16
IL AVG 36.8
Rank #24 / 172
5.3
Facility 5.3
IL AVG 3.7
Rank #154 / 172
184A+
74
Facility 74
IL AVG 51
Rank #135 / 648
Charlotte Kohn
-
Facility -
IL AVG $12.2M
Rank #171 / 171
$4.5M
Facility $4.5M
IL AVG $4.8M
Rank #147 / 171
-
Facility -
IL AVG 44.3%
Rank #1 / 171
145122
Alden Estates of Evanston Rehabilitation and Post Acute Health Care
NH
Evanston
99
Facility 99
IL AVG 86
Rank #125 / 426
61.3%
Facility 61.3%
IL AVG 69.3%
Rank #153 / 204
-12%
2.99
Facility 2.99
IL AVG 3.10
Rank #74 / 172
+11%-4%
$0
Facility $0
IL AVG $151.3k
Rank #1 / 173
9
Facility 9
IL AVG 36.8
Rank #11 / 172
3.0
Facility 3.0
IL AVG 3.7
Rank #45 / 172
-64-
70
Facility 70
IL AVG 51
Rank #153 / 648
Joshua Molitor
$11.6M
Facility $11.6M
IL AVG $12.2M
Rank #110 / 171
$5.6M
Facility $5.6M
IL AVG $4.8M
Rank #120 / 171
48.3%
Facility 48.3%
IL AVG 44.3%
Rank #88 / 171
145907
Three Crowns Park
NH
AL
MC
RC
Evanston (Mcdaniel Avenue)
18
Facility 18
IL AVG 86
Rank #405 / 426
--
7.33
Facility 7.33
IL AVG 3.10
Rank #2 / 172
+68%+137%
$0
Facility $0
IL AVG $151.3k
Rank #1 / 173
2
Facility 2
IL AVG 36.8
Rank #1 / 172
1.0
Facility 1.0
IL AVG 3.7
Rank #1 / 172
125-
68
Facility 68
IL AVG 51
Rank #163 / 648
Three Crowns Park---146199

Financial Assistance for
Nursing Home in Illinois

Dobson Plaza Rehabilitation and Healthcare is located in Evanston, Illinois.
Here are the financial assistance programs available to residents in Illinois.

Get Financial aid guidance

Community Care Program

Illinois CCP

Age 60+
General Illinois resident, at risk of nursing home placement.
Income Limits (2025) ~$1,215/month individual
Asset Limits $17,500 individual, excludes home, car
IL

High demand in urban areas; waitlists possible.

Benefits
In-home care (3-5 hours/day) Adult day services ($65/day) Emergency home response systems ($30/month)

Illinois Respite Program

IL Respite (via NFCSP)

Age Caregiver of someone 60+ (or with dementia)
General Illinois resident.
Income Limits No strict limit; prioritizes low-income.
Asset Limits Not applicable.
IL

Limited slots; urban/rural balance.

Benefits
In-home respite (4-6 hours/day) Adult day care (~$65/day) Short-term facility care (up to 5 days)

Supportive Living Program (SLP)

Illinois Medicaid Supportive Living Program

Age 65+ or 22-64 with disability
General Illinois resident, Medicaid-eligible, needs moderate assistance (not nursing home-level).
Income Limits (2025) ~$2,829/month (300% FBR, individual); QIT allowed.
Asset Limits $2,000 (individual), $3,000 (couple) (excludes home, car).
IL

~200 SLP sites statewide; room/board not covered.

Benefits
Personal care (5-7 hours/day, e.g., bathing, mobility) Meals Housekeeping Medication management Respite (~240 hours/year)

Persons Who Are Elderly Waiver

Illinois Medicaid Elderly Waiver

Age 65+
General Illinois resident, Medicaid-eligible, nursing home-level care need.
Income Limits (2025) ~$2,829/month 300% FBR, individual
Asset Limits $2,000 (individual), $3,000 (couple).
IL

Part of HealthChoice Illinois; consumer-directed options available.

Benefits
Personal care (5-7 hours/day, e.g., dressing, eating) Homemaker Adult day care (~$60/day) Respite (240 hours/year) Home mods ($1,000 avg.)

Medicare Savings Program (MSP)

Illinois Medicare Savings Program

Age 65+ or disabled
General Illinois resident, Medicare Part A/B.
Income Limits (2025) ~$2,510/month (QMB), ~$3,380/month (SLMB), ~$3,598/month (QI)—individual.
Asset Limits $9,430 (individual), $14,130 (couple).
IL

Three tiers; no waitlist.

Benefits
Covers Part B premiums ($174.70/month) Deductibles ($240/year) Copays (~20%)

Optional State Supplementation (OSS)

Illinois Optional State Supplementation

Age 65+ or disabled
General Illinois resident, in approved facility, SSI recipient or low-income.
Income Limits (2025) ~$1,004/month including SSI
Asset Limits $2,000 (individual), $3,000 (couple).
IL

~$50-$500/month based on facility type.

Benefits
Cash (~$50-$500/month) for room/board in personal care homes or SLFs

VA Aid and Attendance (A&A) and Housebound Benefits

Illinois VA Aid and Attendance/Housebound

Age 65+ or disabled veteran/spouse
General Illinois resident, wartime service, need for ADL help (A&A) or homebound.
Income Limits (2025) Net income < ~$1,984/month (veteran with dependent, A&A); pension offsets income.
Asset Limits ~$155,356 net worth limit
IL

High veteran demand in urban/rural areas.

Benefits
Cash (~$1,433-$2,642/month veteran, ~$951-$1,318 spouse) for care costs (e.g., in-home, assisted living)

Frequently Asked Questions about Dobson Plaza Rehabilitation and Healthcare

What neighborhood is Dobson Plaza Rehabilitation and Healthcare in?

Dobson Plaza Rehabilitation and Healthcare is in the Dodge Avenue neighborhood of Evanston.

Is Dobson Plaza Rehabilitation and Healthcare in a walkable area?

Dobson Plaza Rehabilitation and Healthcare has a walk score of 74. Very walkable. Most errands can be accomplished on foot, and many essentials are within a short walk.

What is the occupancy rate at Dobson Plaza Rehabilitation and Healthcare?

Dobson Plaza Rehabilitation and Healthcare's occupancy is 7.1%.

Are there photos of Dobson Plaza Rehabilitation and Healthcare?

Yes — there are 6 photos of Dobson Plaza Rehabilitation and Healthcare in the photo gallery on this page.

What is the address of Dobson Plaza Rehabilitation and Healthcare?

Dobson Plaza Rehabilitation and Healthcare is located at 120 Dodge Ave, Evanston, IL 60202.

What is the phone number of Dobson Plaza Rehabilitation and Healthcare?

(847) 869-7744 will put you in contact with the team at Dobson Plaza Rehabilitation and Healthcare.

Is Dobson Plaza Rehabilitation and Healthcare Medicare or Medicaid certified?

Yes — Dobson Plaza Rehabilitation and Healthcare is a CMS-certified provider of Medicare and Medicaid.

Guides for Better Senior Living

Care Cost Calculator: See Prices in Your Area

Nursing Home Data Explorer

Don’t Wait Too Long: 7 Red Flag Signs Your Parent Needs Assisted Living Now

The True Cost of Assisted Living in 2025 – And How Families Are Paying For It

Understanding Senior Living Costs: Pricing Models, Discounts & Financial Assistance