Allaire Rehab and Nursing

Nursing Home
Overview of Allaire Rehab and Nursing

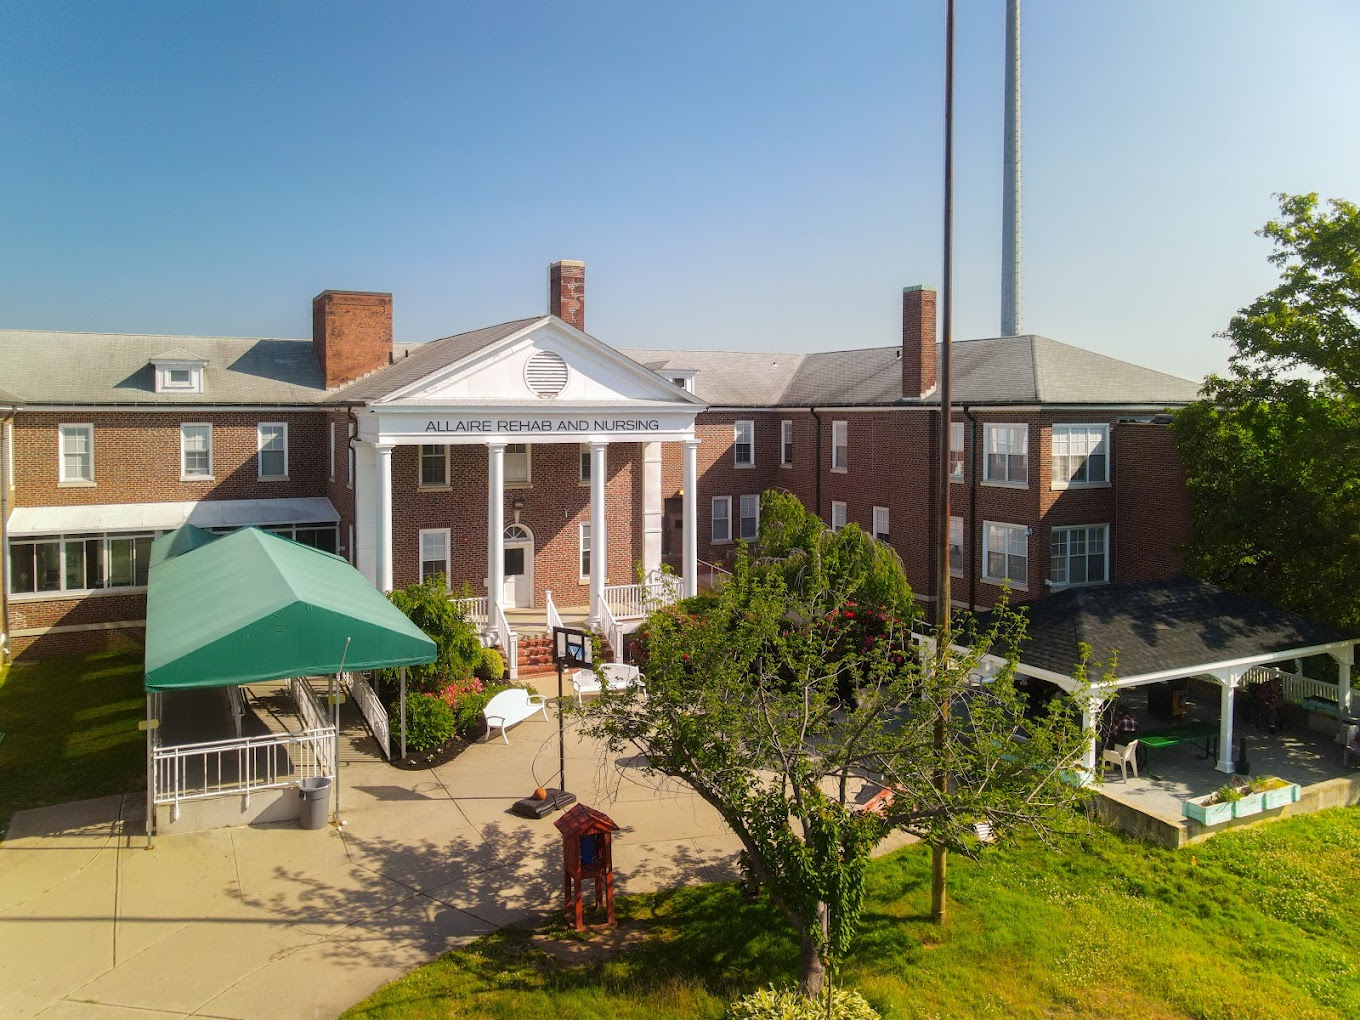
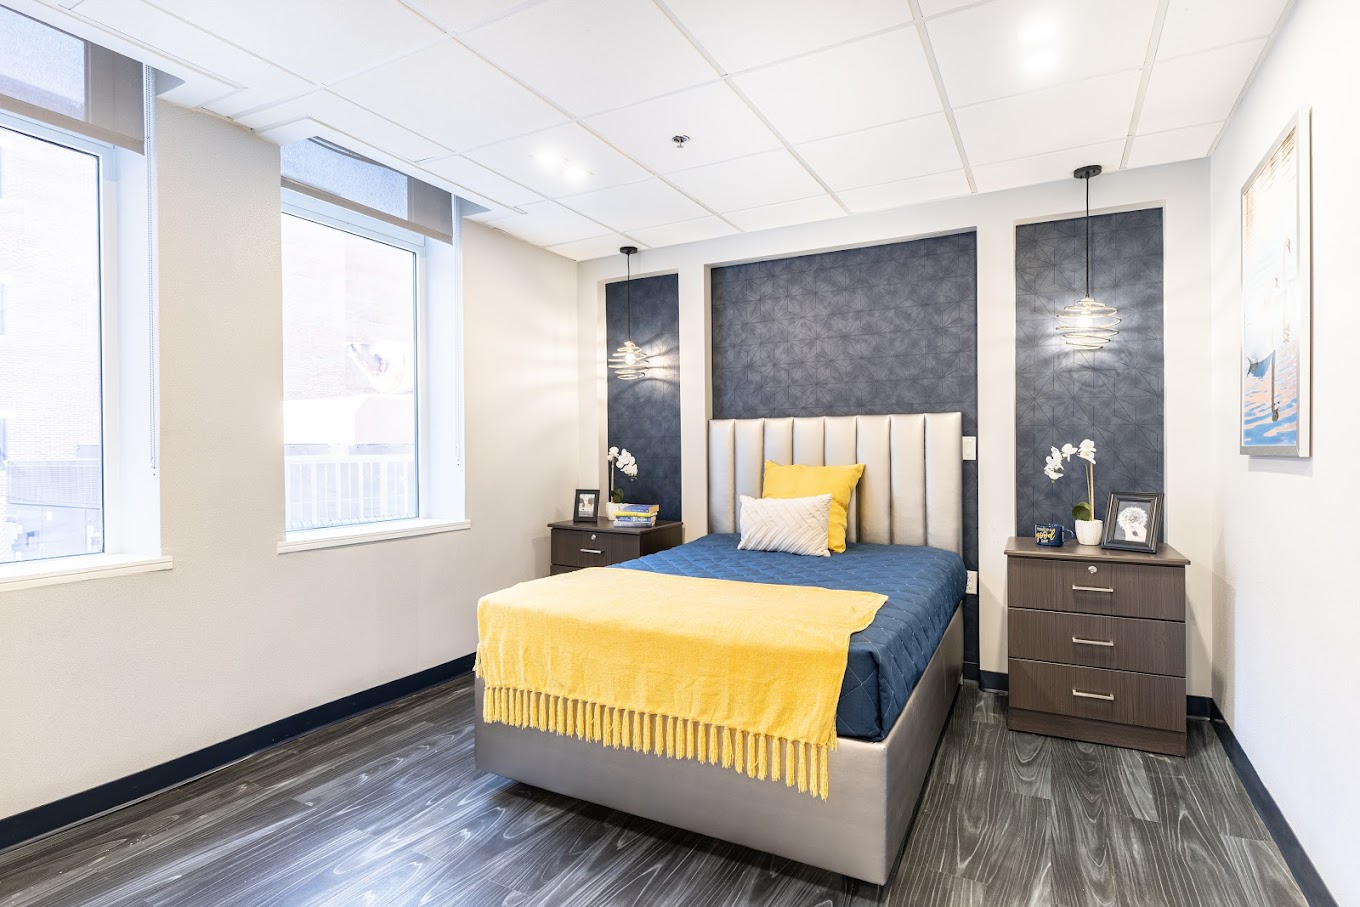
Located on Dutch Lane Road in Freehold Township, NJ, Allaire Rehab and Nursing provides a wide range of care options including subacute rehabilitation, long-term care, palliative care, pain management, telemedicine, and respite care. Live worry-free retirement with the cozy and stunning accommodations of Allaire Rehab and Nursing, meticulously crafted for optimum comfort and security. With a team of reliable and extremely talented professionals, the community strives to deliver round-the-clock care and assistance for seniors to thrive in their healing journey.

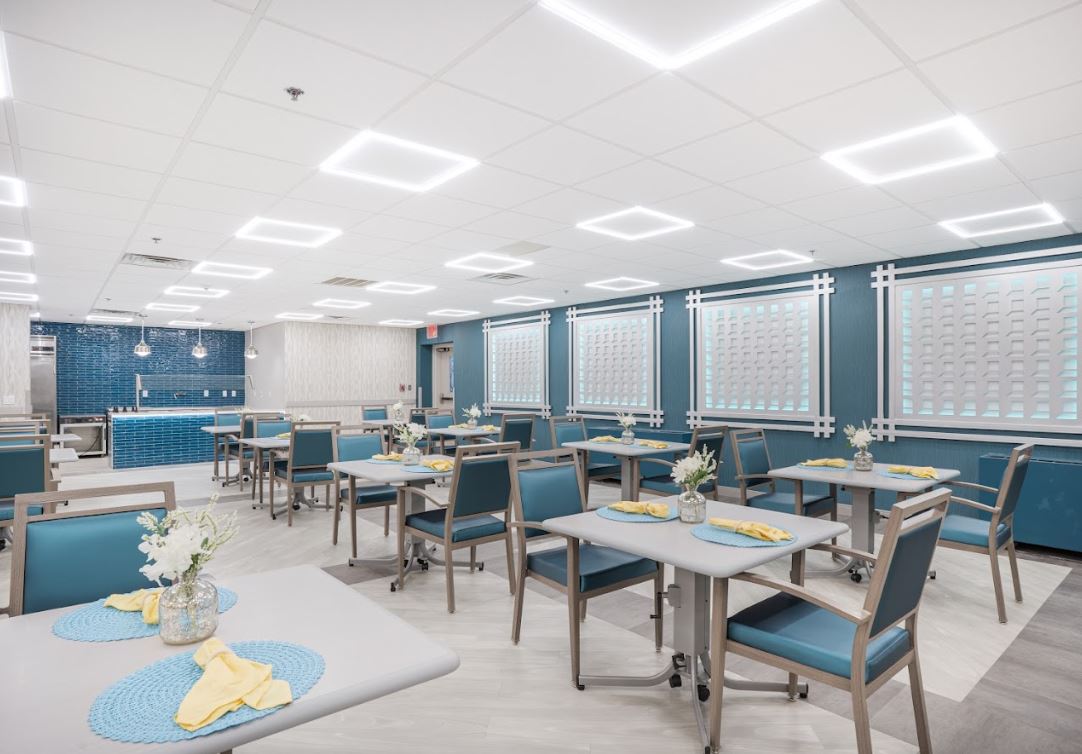
The community conducts a jam-packed calendar of events to ensure seniors live a well-balanced lifestyle. Have an unparalleled dining experience with carefully prepared meals that cater to dietary needs and tastes. Allaire Rehab and Nursing strives to provide a haven for seniors to flourish in their golden years surrounded by a supportive environment and wonderful amenities.

Quality ratings

Measured by Centers for Medicare & Medicaid Services (CMS)

Overall rating Info Official CMS rating based on health inspections, staffing and quality measures.
2/5
New Jersey average: 3.3/5
Health Inspection Info Official CMS rating based on deficiencies found during state health inspections.
1/5
New Jersey average: 2.8/5
Staffing Info Official CMS rating based on nurse staffing hours per resident per day.
3/5
New Jersey average: 3.0/5
Quality Measures Info Official CMS rating based on clinical outcomes for residents.
5/5
New Jersey average: 4.3/5

Nursing care per resident

Info Average daily nursing hours per resident (adjusted for acuity). Higher values indicate more nursing time per resident.
5h 21m per day

This home provides 38% more nursing time per resident than the state average.

New Jersey average: 3h 53m per day

Staffing hours breakdown

Info Hours of care per resident per day, broken down by staff type. Data from CMS Medicare.
Staff type Facility State avg National avg
Registered Nurse (RN) Info Registered nurse hours per resident per day. 30m per day 41m per day 41m per day
LPN / LVN Info Licensed Practical Nurse / Licensed Vocational Nurse hours per resident per day. 1h 11m per day 56m per day 52m per day
Nurse Aide Info Nurse aide hours per resident per day. 3h 26m per day 2h 14m per day 2h 21m per day
Total Nursing (Weekend) Info Total number of nurse staff hours per resident per day on weekends. 4h 0m per day 3h 27m per day 3h 26m per day
Physical Therapist Info Physical therapist staff hours per resident per day. 11m per day 6m per day 4m per day
RN (Weekend) Info Registered nurse hours per resident per day on weekends. 12m per day 29m per day 29m per day

Capacity and availability

Medium-capacity home

Offers a balance of services and community atmosphere.

Total beds 174

This home usually has availability

Lower occupancy suggests more openings may be available.

Lower demand than the New Jersey average
Occupancy rate 79%
Residents per day (avg) 133
Occupancy rate
79%
Residents per day (avg)
133

Who this home usually serves

TYPE OF STAY

Mostly long-term care residents

Most residents stay for extended periods and receive ongoing daily care.

Might be optimal for
Long-term daily care Ongoing support needs

Breakdown by payment type

Medicare

9% of new residents, usually for short-term rehab.

Typical stay 26 days

Private pay

13% of new residents, often for short stays.

Typical stay 3 - 4 months

Medicaid

78% of new residents, often for long-term daily care.

Typical stay 5 - 6 months

Finances and operations

Proprietary home
Other
Home revenue
$35.0M
Profit
$1.5M
Proprietary home Other
Home revenue
$34,956,818.00
Profit
$1,543,559.00
Payroll costs Info The portion of the home's budget spent on staff, including nurses, caregivers, and other employees who support care and operations.
$7.7M
22% of revenue
Other operating costs Info All remaining costs needed to run the home, such as food, utilities, building maintenance, supplies and administrative expenses.
$25.7M
Total costs $33.4M
Bed community size
174-bed community
A large-scale community that may provide a wide range of amenities, services, and structured programs.
Walk Score
Walk Score: 21 / 100
Car-dependent. Most errands require a car, with limited nearby walkable options.

About this community

Occupancy Rate
78%
Occupied Beds
135 of 174
Percentage of available beds currently in use by residents.
Facility Type
Long Term Care Facility
License Expiration
December 31, 2025

Additional licensing details

License number: 61314
CMS Certification Number: 315387

Ownership & operating entity

Allaire Rehab and Nursing is legally operated by ALLAIRE HEALTHCARE GROUP, LLC, and administrated by Mr.. MARTIN GRUEN.

Officers

Info Officers are individuals or entities with formal legal or financial responsibility for the organization that owns this facility

Benjamin Kurland, Naomi Kurland

Type Of Units

Long Term Care
174 units
Total beds
174 units

Safety & Compliance

Safety Features: Wanderguard Security System

Care Services

Nursing Services
Rehabilitation Services
Respite Care
Skilled Nursing
Licensed Nurses/CNAs
24-Hour Staffing

All Levels of Care

Subacute Rehab
Neurological Care
Long-Term Care

Amenities & Lifestyle

Beautiful Atrium Dining Room
Complimentary Cable & Wi-Fi
Patient Concierge Available 24/7
Kosher Services
Nice Outdoor Space
Full Calendar of Activities & Local Field Trips
Assistive Technology Computer & Communication Center
Beauty & Barber Salon
Weekly Religious Services
Out-of-Facility Transportation

Programs & Activities

Activities
Full Calendar of Activities and Events
Specific Programs
Neurological Care, Pain Management, Cardiac Care, Long Term Care, Palliative Care, Respiratory Care, Respite Care, Wound Care
Religious Services
Weekly Religious Services

Dining & Nutrition

Food Description
Home cooked meals, just like you remember!

What does this home offer?

Housing options icon

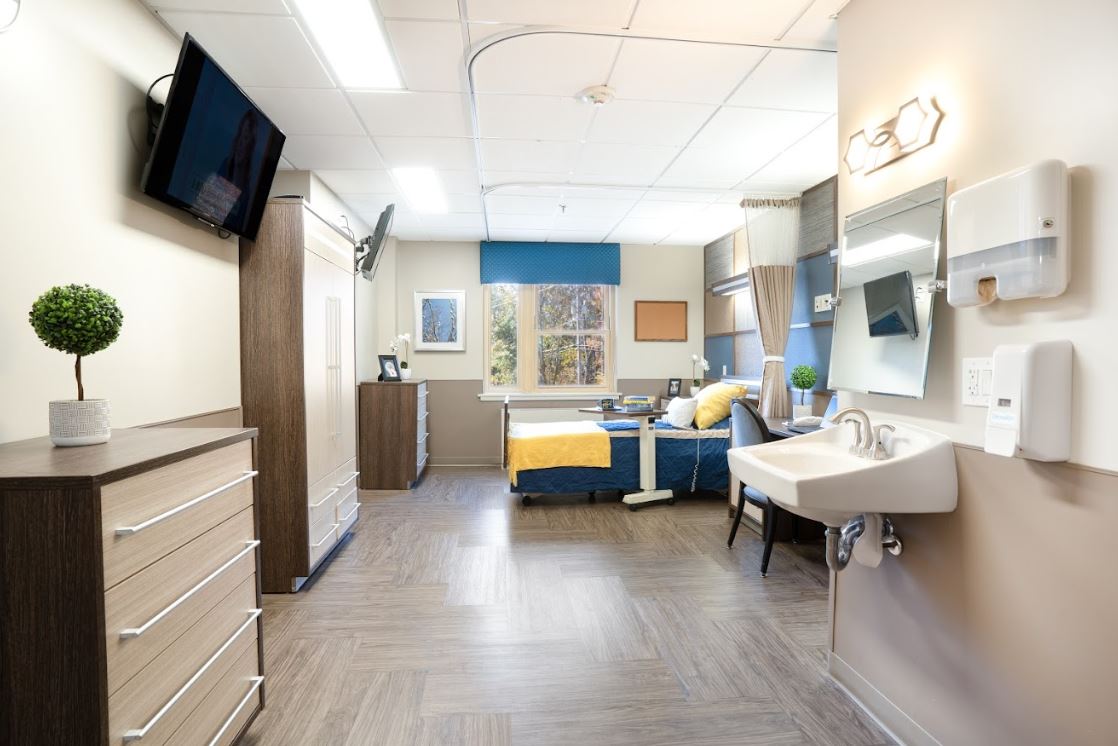
Housing Options: Private Rooms / Semi-Private Rooms

Building type icon
Building type icon

Building Type: Mid-rise

Transportation services icon

Transportation Services

Types of Care at Allaire Rehab and Nursing

Nursing Home

Inspection History

In New Jersey, the Department of Health, Health Facilities Evaluation and Licensing conducts mandatory unannounced surveys to ensure facilities provide safe and effective resident care.

16 visits/inspections

7 complaint inspections

9 routine inspections

Routine Scope And Severity L – Most Severe

On a scale from A (least severe) to L (most severe).

Latest inspection

Date:November 20, 2025

45 deficiencies

Deficiencies indicate regulatory issues. A higher number implies the facility had several areas requiring improvement.

17 deficiencies identified during routine visits

Deficiencies indicate regulatory issues. A higher number implies the facility had several areas requiring improvement.

Compare Nursing Homes around Freehold

The information below is reported by the New Jersey Department of Health, Health Facilities Evaluation and Licensing.
Allaire Rehab and Nursing
SNF

Nursing Homes 24/7 care needed

Freehold
174
No
21
ALLAIRE HEALTHCARE GROUP, LLC
79.0%
$33,572,061.00
$7,686,226.00
22.9%
133.20
2/5
5.3537
1/5
3/5
5/5
3
32
10
-75%
+38%
+3%
Private Rooms / Semi-Private Rooms

Places of interest near Allaire Rehab and Nursing

Address 1.1 miles from city center

Address 115 Dutch Lane Rd, Freehold, NJ 07728

Calculate Travel Distance to Allaire Rehab and Nursing

Add your location

Address

Staffing Data

Source: CMS Payroll-Based Journal (Q2 2025)

336
Total Staff
206
Employees
130
Contractors
74,790
Total Hours (Quarter)
99
Avg Staff/Day
8.3
Avg Shift (hrs)
Nursing Staff Breakdown
Role Count Avg Shift (hrs) Uses Contractors?
Registered Nurse88.2 Yes
Licensed Practical Nurse758.6 Yes
Certified Nursing Assistant1938.7 Yes
Staff by Category
Administration
1 staff
8hs shift avg
Nursing Staff
281 staff
8.6hs shift avg
Physicians & Practitioners
8 staff
7.9hs shift avg
Therapy Services
24 staff
7.5hs shift avg
Activities & Recreation
1 staff
2.1hs shift avg
Social Services
10 staff
7.1hs shift avg
Dietary Services
9 staff
6.3hs shift avg
Other Services
2 staff
8hs shift avg
Contractor Analysis
17.4%
of total hours from contractors
13,015 contractor hours this quarter
Certified Nursing Assistant: 80 Respiratory Therapy Technician: 2 Licensed Practical Nurse: 46 Registered Nurse: 1 Qualified Activities Professional: 1
Role Employees Contractors Total Staff Total Hours Days Worked % of Days Avg Shift (hrs)
Certified Nursing Assistant1138019342,35591100%8.7
Licensed Practical Nurse29467515,12791100%8.6
Clinical Nurse Specialist7073,1237582%7.9
Physical Therapy Assistant7072,4877582%7.5
Respiratory Therapy Technician4262,1626673%7.8
Registered Nurse7182,1409099%8.2
Dietitian9092,03991100%6.3
Qualified Social Worker100101,4397886%7.1
Mental Health Service Worker2021,0066470%8
Physical Therapy Aide7079317380%6.9
Speech Language Pathologist4046927380%7
Administrator1014725965%8
Nurse Practitioner1014645864%8
Nurse Aide in Training5053511516%7.5
Qualified Activities Professional011422%2.2

Health Inspection History

Inspections
Total health inspections 8

New Jersey average 4


Last Health inspection on Oct 2025

Total health citations 32
Citations per inspection
4

Health citations are formal notices following inspections when they fail to comply with safety and care standards.

17 of 32 citations resulted from standard inspections; and 15 of 32 resulted from complaint investigations.

Breakdown of citation severity (last 3 years)
Critical Health citations More info 10
1329% worse than New Jersey average

New Jersey average: 0.7


Serious Health citations More info 0
100% better than New Jersey average

New Jersey average: 0.4

10 critical citations More info New Jersey average: 0.7

0 serious citations More info New Jersey average: 0.4

22 moderate citations More info New Jersey average: 19.3

0 minor citations More info New Jersey average: 0.5
Citations history (last 3 years)
Nutrition moderate citation Oct 30, 2025
Corrected

Abuse/Neglect critical citation Aug 12, 2025
Corrected

Abuse/Neglect critical citation Aug 12, 2025
Corrected

Administration critical citation Aug 12, 2025
Corrected

Facility Characteristics

Source: CMS Long-Term Care Facility Characteristics (Data as of Jan 2026)

Ownership: For-Profit LLC
Resident Census by Payment Source
131 Total Residents
Medicaid 124 (94.7%)
Private Pay/Other 7 (5.3%)
Programs & Services
Residents' Group
Family Engagement

Active councils help families stay involved in care decisions and facility operations.

Quality of care over time

These measures show how residents usually do over time at this home, based on health outcomes and preventive care.

High-risk clinical events score Info A composite score based on pressure ulcers, falls with injury, weight loss, walking ability decline, and activities of daily living decline. 2.3
66% better than New Jersey average

New Jersey average: 6.8

Functional decline score Info A composite score based on activities of daily living decline, walking ability decline, and incontinence. 0.6
95% better than New Jersey average

New Jersey average: 12.4

Long-stay resident measures
Need for Help with Daily Activities Increased Info Percent of long-stay residents whose need for help with daily activities has increased 1.0%
90% better than New Jersey average

New Jersey average: 10.1%

Walking Ability Worsened Info Percent of long-stay residents whose ability to move independently worsened 0.9%
92% better than New Jersey average

New Jersey average: 11.0%

Low Risk Residents with Bowel/Bladder Incontinence Info Percent of low risk long-stay residents who lose control of their bowels or bladder 0.0%
100% better than New Jersey average

New Jersey average: 16.0%

Falls with Major Injury Info Percent of long-stay residents experiencing one or more falls with major injury 1.1%
53% better than New Jersey average

New Jersey average: 2.4%

High Risk Residents with Pressure Ulcers Info Percent of long-stay high risk residents with pressure ulcers 7.4%
22% worse than New Jersey average

New Jersey average: 6.1%

Urinary Tract Infection Info Percent of long-stay residents with a urinary tract infection 1.2%
20% worse than New Jersey average

New Jersey average: 1.0%

Lost Too Much Weight Info Percent of long-stay residents who lose too much weight 1.0%
79% better than New Jersey average

New Jersey average: 4.6%

Depressive Symptoms Info Percent of long-stay residents who have depressive symptoms 5.7%
50% better than New Jersey average

New Jersey average: 11.3%

Antipsychotic Use Info Percent of long-stay residents who received an antipsychotic medication 15.0%
35% worse than New Jersey average

New Jersey average: 11.1%

Pneumococcal Vaccine Info Percent of long-stay residents assessed and appropriately given the pneumococcal vaccine 99.8%
7% better than New Jersey average

New Jersey average: 93.0%

Influenza Vaccine Info Percent of long-stay residents assessed and appropriately given the seasonal influenza vaccine 99.3%
In line with New Jersey average

New Jersey average: 97.2%

Hospitalizations per 1,000 days Info Number of hospitalizations per 1,000 long-stay resident days. 3.37
62% worse than New Jersey average

New Jersey average: 2.08

ED visits per 1,000 days Info Number of outpatient emergency department visits per 1,000 long-stay resident days. 1.73
54% worse than New Jersey average

New Jersey average: 1.12

Short-stay resident measures
Pneumococcal Vaccine Info Percent of short-stay residents assessed and appropriately given the pneumococcal vaccine 94.4%
20% better than New Jersey average

New Jersey average: 78.9%

Antipsychotic medication increase Info Percent of short-stay residents who newly received an antipsychotic medication 0.0%
100% better than New Jersey average

New Jersey average: 1.2%

Influenza Vaccine Info Percent of short-stay residents assessed and appropriately given the seasonal influenza vaccine 82.4%
In line with New Jersey average

New Jersey average: 80.1%

Re-hospitalized after SNF stay Info Percentage of short-stay residents who were re-hospitalized after their nursing home admission. 29.5%
16% worse than New Jersey average

New Jersey average: 25.4%

Emergency department visits Info Percentage of short-stay residents who had an outpatient emergency department visit. 13.7%
67% worse than New Jersey average

New Jersey average: 8.2%

Falls with major injury Info Percentage of SNF residents who experience falls with major injury during their stay. 0.0%
100% better than New Jersey average

New Jersey average: 0.8%

Penalties and fines

Federal penalties imposed by CMS for regulatory violations, including civil money penalties (fines) and denials of payment for new Medicare/Medicaid admissions.

Source: CMS Penalties Database (Data as of Jan 2026)

Total fines amount $238K
209% higher than New Jersey average

New Jersey average: $77K

Number of fines 3
49% more fines than New Jersey average

New Jersey average: 2.0

Payment Denials Info Serious action where Medicare and/or Medicaid temporarily stops payments for new residents until issues are fixed. 0
100% fewer payment denials than New Jersey average

New Jersey average: 0.1

Fines amount comparison
This facility $238K
New Jersey average $77K
Penalty History

Penalties are imposed by CMS for violations of federal nursing home regulations.

Civil Money Penalty Info Fines imposed for noncompliance, which can be assessed per day or per instance of violation. Jul 2, 2025
$141K
Civil Money Penalty Info Fines imposed for noncompliance, which can be assessed per day or per instance of violation. Nov 1, 2024
$85K
Civil Money Penalty Info Fines imposed for noncompliance, which can be assessed per day or per instance of violation. Aug 19, 2024
$12K

Last updated: Jan 2026

Guides for Better Senior Living

Care Cost Calculator: See Prices in Your Area

Nursing Home Data Explorer

Don’t Wait Too Long: 7 Red Flag Signs Your Parent Needs Assisted Living Now

The True Cost of Assisted Living in 2025 – And How Families Are Paying For It

Understanding Senior Living Costs: Pricing Models, Discounts & Financial Assistance

Financial Aid for New Jersey Seniors

Get financial aid guidance

Managed Long Term Services and Supports

NJ Medicaid MLTSS

Age 65+ or disabled, New Jersey resident, Medicaid- eligible, nursing home-level care need.

~$2,829/month (300% FBR, individual).

$2,000 (individual), $3,000 (couple).

High urban demand; managed care model.

JACC (Jersey Assistance for Community Caregiving)

NJ JACC

Age 60+, New Jersey resident, at risk of nursing home.

~$2,500/month (individual, varies).

$40,000 (individual).

Higher asset limit; limited funding.

Pharmaceutical Assistance to the Aged and Disabled (PAAD)

New Jersey PAAD

Age 65+, NJ resident, enrolled in Medicare Part D or eligible.

~$42,142/year (individual), ~$49,209/year (couple).

Not assessed.

Copays $5 (generic), $7 (brand); covers Part D premiums up to benchmark.

Senior Gold Prescription Discount Program

New Jersey Senior Gold

Age 65+, NJ resident, enrolled in Medicare Part D or eligible.

~$42,142-$52,142/year (individual), ~$49,209-$59,209/year (couple).

Not assessed.

Copays $15 + 50% of remaining cost; no premium assistance.

Medicare Savings Program (MSP)

New Jersey Medicare Savings Program

Age 65+ or disabled, NJ resident, Medicare Part A/B.

~$2,510/month (QMB), ~$3,380/month (SLMB), ~$3,598/month (QI)—individual.

$9,430 (individual), $14,130 (couple).

Three tiers; no waitlist; includes Extra Help for Part D.

Senior Freeze (Property Tax Reimbursement)

New Jersey Senior Freeze

Age 65+ by Dec 31 prior year, NJ resident, homeowner, paid property taxes.

~$150,000/year (combined household, projected).

Not assessed; home ownership required.

Combines with ANCHOR/Stay NJ via PAS-1; annual application.

ANCHOR (Affordable NJ Communities for Homeowners and Renters)

New Jersey ANCHOR

Age 65+ prioritized, NJ resident, homeowner/renter, paid property taxes/rent.

~$150,000/year (homeowners), ~$75,000/year (renters).

Not assessed.

Combines with Senior Freeze/Stay NJ; broader than prior Homestead program.

Stay NJ

New Jersey Stay NJ

Age 65+ by Dec 31 prior year, NJ resident, homeowner, lived in home 10+ years.

~$500,000/year (projected, subject to final regs).

Not assessed; home ownership required.

Up to 50% tax credit (max $6,500); phased implementation.

Universal Service Fund (USF)

New Jersey Universal Service Fund

Age 65+ prioritized, NJ resident, utility customer, low-income.

~$3,970/month (individual, 185% FPL).

Not assessed; income-focused.

Must owe >$25 on bill; combines with LIHEAP if eligible.

Home Energy Assistance Program (LIHEAP)

New Jersey LIHEAP

Age 60+ prioritized, NJ resident, low-income household.

~$3,970/month (individual, 185% FPL).

Not assessed; income-focused.

Covers oil, gas, electric; emergency aid available.

NJ Family Caregiver Support Program (via NFCSP)

New Jersey Family Caregiver Support Program

Caregivers of 60+ needing care or 55+ caregivers of others; NJ resident; functional needs (2+ ADLs).

Prioritizes ~$24,980/year (individual); no strict cap.

Not assessed; need-based.

21 AAAs; rural/low-income priority.

VA Aid and Attendance (A&A) and Housebound Benefits

New Jersey VA Aid and Attendance/Housebound

Age 65+ or disabled veteran/spouse, NJ resident, wartime service, need for ADL help (A&A) or homebound.

Net income < ~$1,984/month (veteran with dependent, A&A); pension offsets income.

~$155,356 (net worth limit).

High veteran demand in urban/rural areas.

Who we are

Your Senior Care Partner, Every Step of the Way

We help families find affordable senior communities and unlock same day discounts, Medicaid, and Medicare options tailored to your needs.

Contact us Today
Tour Icon
Planning a tour? Check our touring checklist.
Chat Icon
Thinking of living here? We can help you speak to a current resident