Alliance Health at Marina Bay

Assisted Living Home
Overview of Alliance Health at Marina Bay

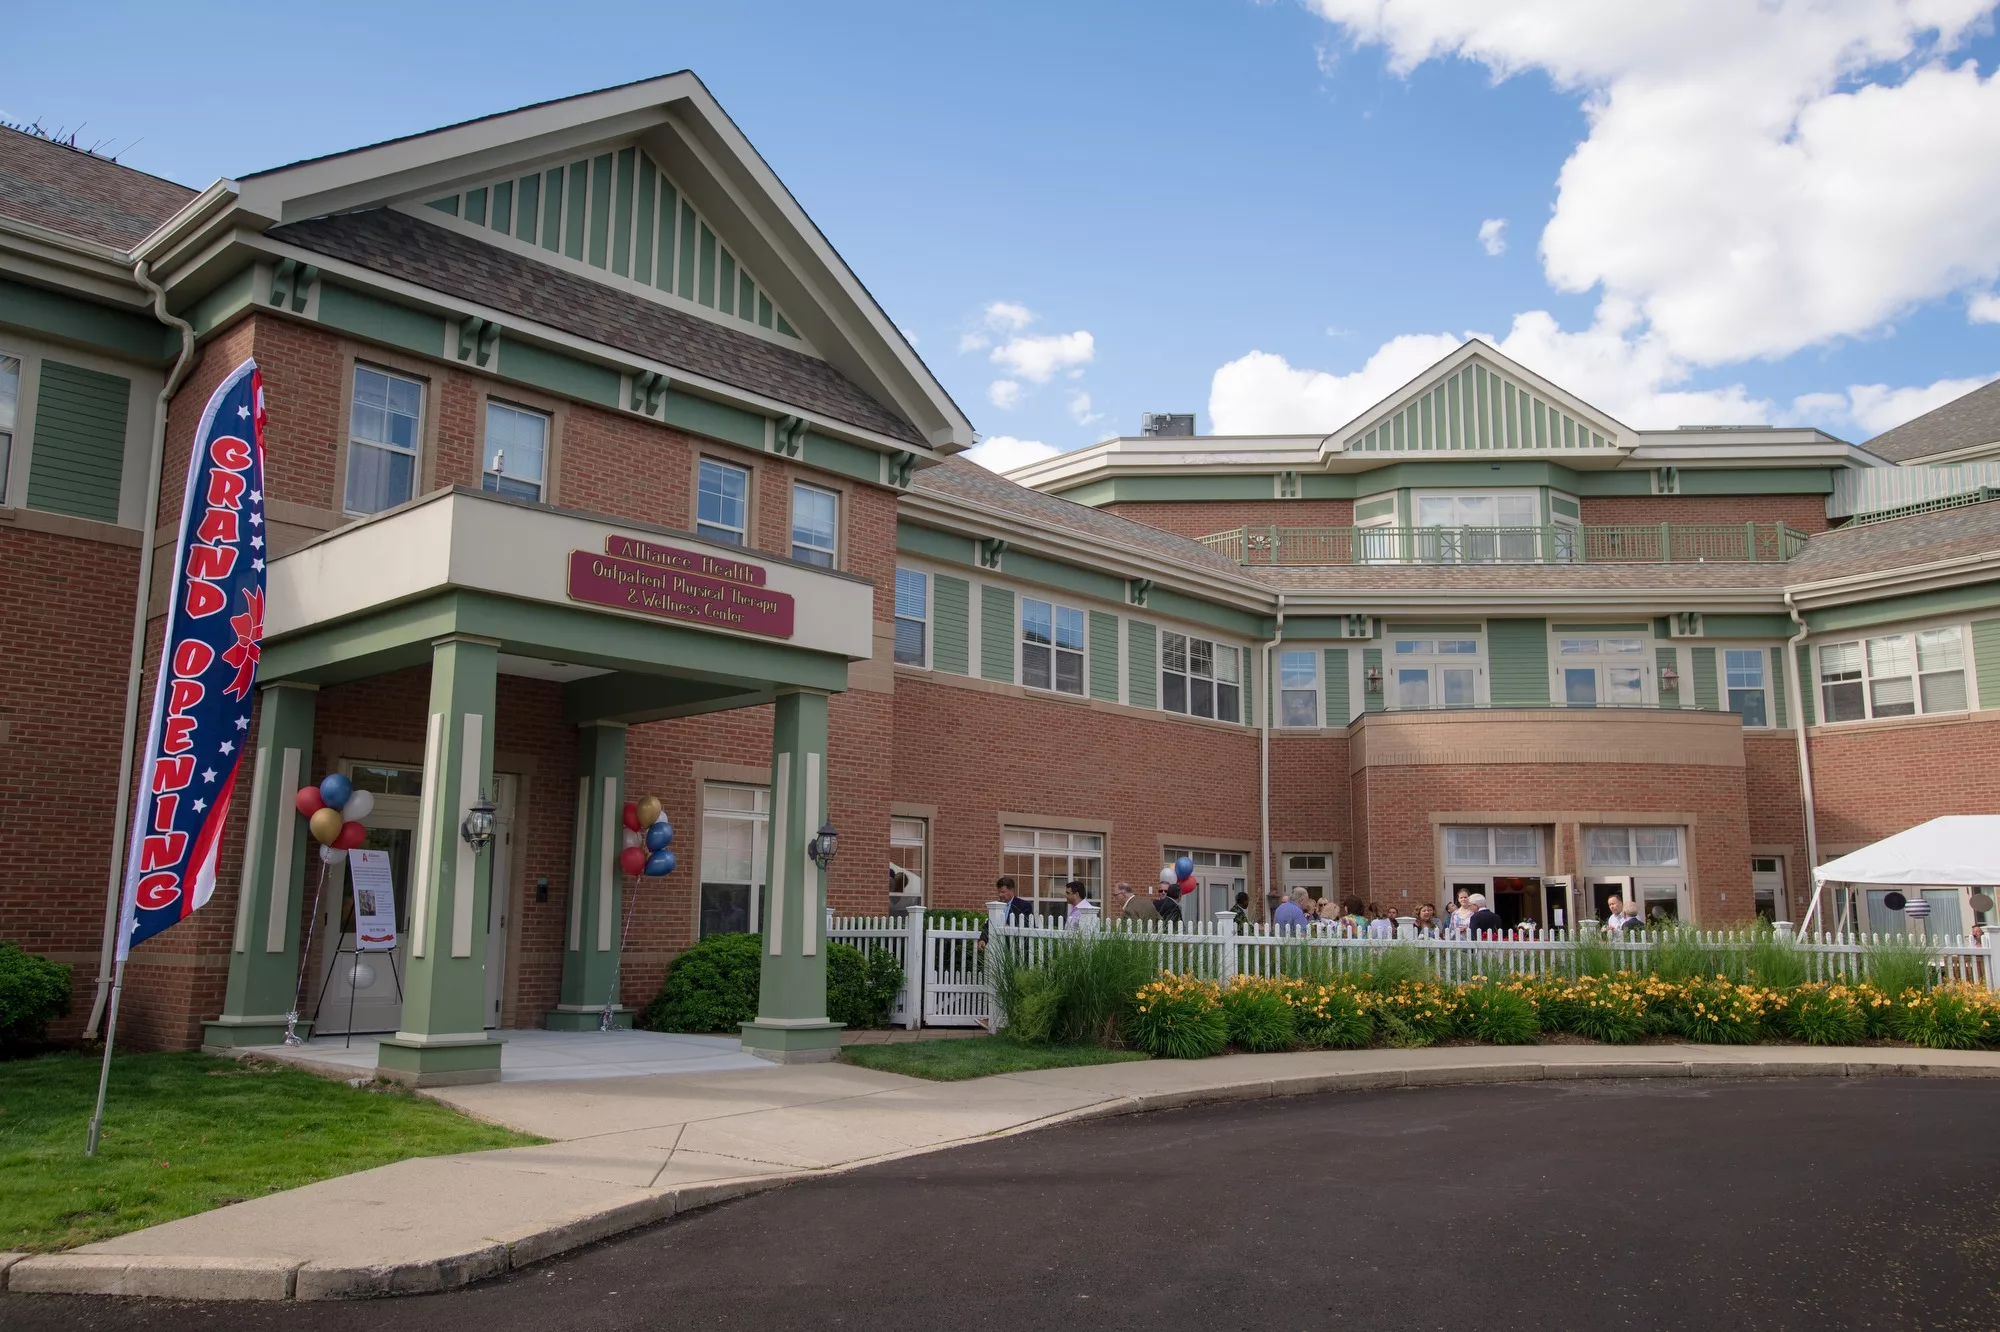
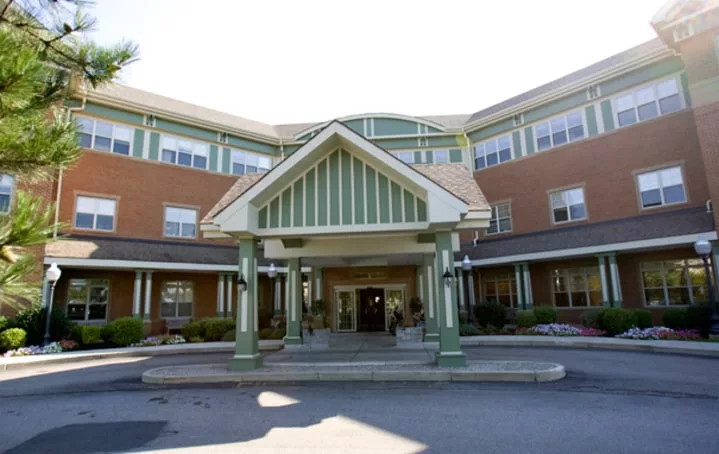
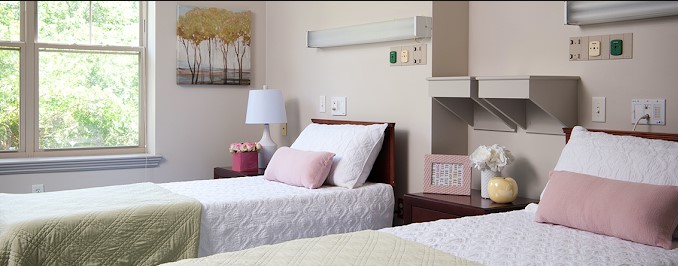
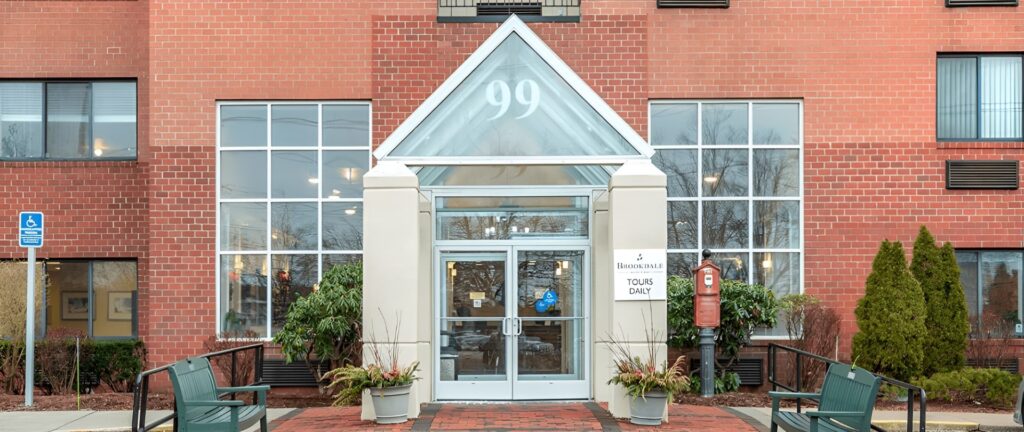
Situated amidst Quincy’s marina, Alliance Health at Marina Bay has undergone a recent transformative renovation, evolving into a state-of-the-art 167-bed rehabilitation facility that upholds residents’ dignity and well-being. The center is committed to providing a secure, comfortable environment with comprehensive medical care, ensuring each resident’s stay is safe, enjoyable, and dignified. 
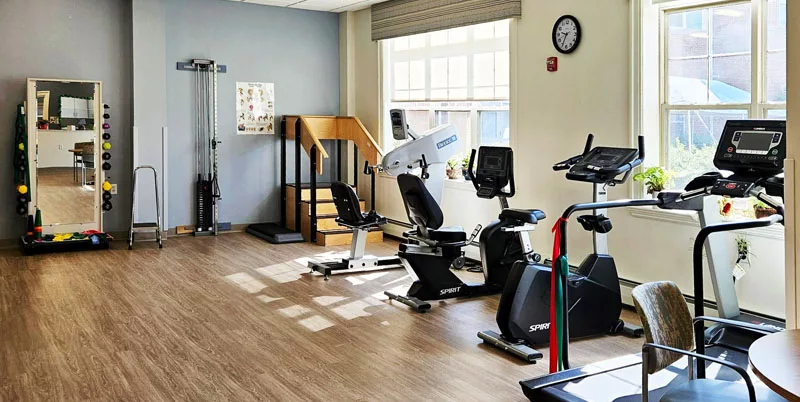
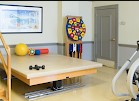
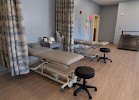
Marina Bay stands at the forefront of innovation, employing cutting-edge techniques and advanced equipment to elevate resident care. At Alliance Health at Marina Bay, the core belief revolves around nurturing every facet of the resident experience. With licensed therapists offering personalized evaluation and treatment plans, the focus remains on fostering the highest level of independence for those recuperating from illness or injury. The facility houses an on-site Outpatient Rehab Gym and proudly holds a prestigious 5-star rating from the Department of Health. Recognized for excellence, it has been honored with the 2023 Silver Award from AHCA/NCAL and holds esteemed JCAHO certification. 

(617) 769-5100

Quality ratings

Measured by Centers for Medicare & Medicaid Services (CMS)

Overall rating Info Official CMS rating based on health inspections, staffing and quality measures.
3/5
Massachusetts average: 2.9/5
Health Inspection Info Official CMS rating based on deficiencies found during state health inspections.
3/5
Massachusetts average: 2.8/5
Staffing Info Official CMS rating based on nurse staffing hours per resident per day.
4/5
Massachusetts average: 3.0/5
Quality Measures Info Official CMS rating based on clinical outcomes for residents.
4/5
Massachusetts average: 3.2/5

Nursing care per resident

Info Average daily nursing hours per resident (adjusted for acuity). Higher values indicate more nursing time per resident.
4h 20m per day

This home provides 10% more nursing time per resident than the state average.

Massachusetts average: 3h 56m per day

Capacity and availability

Medium-capacity home

Offers a balance of services and community atmosphere.

Total beds 167

This home usually has limited availability

Occupancy is moderate, suggesting balanced demand.

Similar demand to the Massachusetts average
Occupancy rate 89.8%
Residents per day (avg) 143
Occupancy rate
89.8%
Residents per day (avg)
143

Who this home usually serves

TYPE OF STAY

Mix of rehab and long-term care

This home supports both short-term rehab and long-term care, with residents staying for a wide range of durations.

Breakdown by payment type

Medicare

42% of new residents, usually for short-term rehab.

Typical stay 25 days

Private pay

57% of new residents, often for short stays.

Typical stay 1 - 2 months

Medicaid

2% of new residents, often for long-term daily care.

Typical stay 5 - 6 years

Finances and operations

Voluntary non-profit home
Other
Home revenue
$39.3M
Surplus of revenue
$273.8K
Voluntary non-profit home Other
Home revenue
$39,290,965.00
Surplus of revenue
$273,848.00
Payroll costs Info The portion of the home's budget spent on staff, including nurses, caregivers, and other employees who support care and operations.
$10.3M
26.1% of revenue
Other operating costs Info All remaining costs needed to run the home, such as food, utilities, building maintenance, supplies and administrative expenses.
$28.8M
Total costs $39.0M

Types of Care at Alliance Health at Marina Bay

Assisted Living Hospice Care
Contact Alliance Health at Marina Bay

Compare Assisted Living around Quincy

The information below is reported by the Massachusetts Executive Office of Elder Affairs and Department of Public Health.
Alliance Health at Marina Bay
SNF

Nursing Home 24/7 care needed

AL

Assisted Living For seniors needing help with daily tasks but not full-time nursing.

HC

Hospice Care

Quincy (Marina Bay)
167
No
13
GALLEGO, CAILIN
89.8%
$38,080,186.00
$10,266,120.00
27%
143.20
3/5
4.3355
3/5
4/5
4/5
1
24
1
+113%
+10%
+10%
Sunrise of Cohasset
AL

Assisted Living For seniors needing help with daily tasks but not full-time nursing.

MC

Memory Care Specialized care for those with Memory Loss, Alzheimer's, or dementia, ensuring safety and support.

Cohasset
62
Yes
45
-
-
-
-
-
-
-
-
-
-
-
-
-
-
-
-
-
Brookdale Quincy Bay
AL

Assisted Living For seniors needing help with daily tasks but not full-time nursing.

IL

Independent Living For self-sufficient seniors seeking community and minimal assistance.

Quincy
-
No
79
-
-
-
-
-
-
-
-
-
-
-
-
-
-
-
-
-

Places of interest near Alliance Health at Marina Bay

Address 4.5 miles from city center — 3.76 miles to nearest hospital (Beth Israel Deaconess Hospitalu2013Milton)

Address 2 Seaport Dr, Quincy, MA 02171

Calculate Travel Distance to Alliance Health at Marina Bay

Add your location

Address

Staffing Data

Source: CMS Payroll-Based Journal (Q2 2025)

262
Total Staff
189
Employees
73
Contractors
65,850
Total Hours (Quarter)
89
Avg Staff/Day
8.1
Avg Shift (hrs)
Nursing Staff Breakdown
Role Count Avg Shift (hrs) Uses Contractors?
Registered Nurse727.5 Yes
Licensed Practical Nurse447.8 Yes
Certified Nursing Assistant878.7 No
Staff by Category
Administration
2 staff
7.7hs shift avg
Nursing Staff
209 staff
8.3hs shift avg
Physicians & Practitioners
9 staff
8.5hs shift avg
Therapy Services
24 staff
7.3hs shift avg
Activities & Recreation
1 staff
3.4hs shift avg
Social Services
5 staff
7.1hs shift avg
Dietary Services
7 staff
6.9hs shift avg
Other Services
5 staff
8hs shift avg
Contractor Analysis
6.8%
of total hours from contractors
4,445 contractor hours this quarter
Licensed Practical Nurse: 21 Registered Nurse: 41 Mental Health Service Worker: 3 Occupational Therapy Aide: 5 Qualified Activities Professional: 1 Medical Director: 1 Occupational Therapy Assistant: 1
Role Employees Contractors Total Staff Total Hours Days Worked % of Days Avg Shift (hrs)
Certified Nursing Assistant8708732,80091100%8.7
Registered Nurse3141729,22491100%7.5
Licensed Practical Nurse2321448,95491100%7.8
Physical Therapy Assistant8082,5708897%7.5
Clinical Nurse Specialist8082,2597684%8.6
RN Director of Nursing5052,0966774%8.6
Respiratory Therapy Technician6061,7788593%7.4
Speech Language Pathologist4041,28791100%7.9
Other Dietary Services Staff6061,2039099%6.6
Mental Health Service Worker2359096470%8
Qualified Social Worker5056767481%7.1
Administrator1015046369%8
Nurse Practitioner1014886167%8
Dietitian1014886167%8
Occupational Therapy Aide0554376976%5.2
Nurse Aide in Training10172910%8
Occupational Therapy Assistant0114867%8
Medical Director0114089%5
Qualified Activities Professional0111755%3.4

Health Inspection History

Inspections
Total health inspections 4

Massachusetts average 4.5


Last Health inspection on Sep 2024

Total health citations 24
Citations per inspection
6

Health citations are formal notices following inspections when they fail to comply with safety and care standards.

23 of 24 citations resulted from standard inspections; and 1 of 24 resulted from complaint investigations.

Breakdown of citation severity (last 3 years)
Critical Health citations More info 0
100% better than Massachusetts average

Massachusetts average: 0.3


Serious Health citations More info 1
33% better than Massachusetts average

Massachusetts average: 1.5

0 critical citations More info Massachusetts average: 0.3

1 serious citation More info Massachusetts average: 1.5

23 moderate citations More info Massachusetts average: 29.7

0 minor citations More info Massachusetts average: 1.3
Citations history (last 3 years)
Infection Control moderate citation Sep 23, 2024
Corrected

Nutrition moderate citation Sep 23, 2024
Corrected

Nutrition moderate citation Sep 23, 2024
Corrected

Pharmacy moderate citation Sep 23, 2024
Corrected

Facility Characteristics

Source: CMS Long-Term Care Facility Characteristics (Data as of Jan 2026)

Ownership: Non-Profit Corporation
Part of: Alliance Health and Human Services
Resident Census by Payment Source
158 Total Residents
Medicare 17 (10.8%)
Medicaid 76 (48.1%)
Private Pay/Other 65 (41.1%)
Programs & Services
Residents' Group
Family Member Group
Clinical Research
CCRC
Family Engagement

Active councils help families stay involved in care decisions and facility operations.

Quality of care over time

These measures show how residents usually do over time at this home, based on health outcomes and preventive care.

High-risk clinical events score Info A composite score based on pressure ulcers, falls with injury, weight loss, walking ability decline, and activities of daily living decline. 8.2
20% better than Massachusetts average

Massachusetts average: 10.2

Functional decline score Info A composite score based on activities of daily living decline, walking ability decline, and incontinence. 13.2
34% better than Massachusetts average

Massachusetts average: 20.0

Long-stay resident measures
Need for Help with Daily Activities Increased Info Percent of long-stay residents whose need for help with daily activities has increased 16.7%
11% better than Massachusetts average

Massachusetts average: 18.7%

Walking Ability Worsened Info Percent of long-stay residents whose ability to move independently worsened 12.4%
36% better than Massachusetts average

Massachusetts average: 19.3%

Low Risk Residents with Bowel/Bladder Incontinence Info Percent of low risk long-stay residents who lose control of their bowels or bladder 10.5%
53% better than Massachusetts average

Massachusetts average: 22.1%

Falls with Major Injury Info Percent of long-stay residents experiencing one or more falls with major injury 1.9%
47% better than Massachusetts average

Massachusetts average: 3.6%

High Risk Residents with Pressure Ulcers Info Percent of long-stay high risk residents with pressure ulcers 3.7%
21% better than Massachusetts average

Massachusetts average: 4.7%

Urinary Tract Infection Info Percent of long-stay residents with a urinary tract infection 1.8%
15% better than Massachusetts average

Massachusetts average: 2.1%

Lost Too Much Weight Info Percent of long-stay residents who lose too much weight 6.2%
19% worse than Massachusetts average

Massachusetts average: 5.2%

Depressive Symptoms Info Percent of long-stay residents who have depressive symptoms 5.2%
51% better than Massachusetts average

Massachusetts average: 10.7%

Antipsychotic Use Info Percent of long-stay residents who received an antipsychotic medication 12.0%
41% better than Massachusetts average

Massachusetts average: 20.3%

Pneumococcal Vaccine Info Percent of long-stay residents assessed and appropriately given the pneumococcal vaccine 98.9%
8% better than Massachusetts average

Massachusetts average: 91.9%

Influenza Vaccine Info Percent of long-stay residents assessed and appropriately given the seasonal influenza vaccine 96.1%
In line with Massachusetts average

Massachusetts average: 94.8%

Short-stay resident measures
Pneumococcal Vaccine Info Percent of short-stay residents assessed and appropriately given the pneumococcal vaccine 88.4%
15% better than Massachusetts average

Massachusetts average: 76.7%

Antipsychotic medication increase Info Percent of short-stay residents who newly received an antipsychotic medication 0.3%
80% better than Massachusetts average

Massachusetts average: 1.3%

Influenza Vaccine Info Percent of short-stay residents assessed and appropriately given the seasonal influenza vaccine 81.2%
In line with Massachusetts average

Massachusetts average: 77.7%

Penalties and fines

Federal penalties imposed by CMS for regulatory violations, including civil money penalties (fines) and denials of payment for new Medicare/Medicaid admissions.

Source: CMS Penalties Database (Data as of Jan 2026)

Total fines amount $10K
86% lower than Massachusetts average

Massachusetts average: $72K

Number of fines 1
42% fewer fines than Massachusetts average

Massachusetts average: 1.7

Payment Denials Info Serious action where Medicare and/or Medicaid temporarily stops payments for new residents until issues are fixed. 0
100% fewer payment denials than Massachusetts average

Massachusetts average: 0.1

Fines amount comparison
This facility $10K
Massachusetts average $72K
Penalty History

Penalties are imposed by CMS for violations of federal nursing home regulations.

Civil Money Penalty Info Fines imposed for noncompliance, which can be assessed per day or per instance of violation. Jun 14, 2023
$10K

Last updated: Jan 2026

Guides for Better Senior Living

Care Cost Calculator: See Prices in Your Area

Nursing Home Data Explorer

Don’t Wait Too Long: 7 Red Flag Signs Your Parent Needs Assisted Living Now

The True Cost of Assisted Living in 2025 – And How Families Are Paying For It

Understanding Senior Living Costs: Pricing Models, Discounts & Financial Assistance

Financial Aid for Massachusetts Seniors

Get financial aid guidance

Home Care Program

MassHealth Home Care

Age 60+, Massachusetts resident, at risk of nursing home placement.

~$1,500/month (individual, varies by region).

$2,000 (individual, excludes home, car).

Coordinated through Aging Services Access Points (ASAPs); high demand in urban areas.

Frail Elder Waiver

Massachusetts Medicaid FE Waiver

Age 65+, Massachusetts resident, Medicaid-eligible, nursing home-level care need.

~$2,829/month (300% FBR, individual).

$2,000 (individual), $3,000 (couple).

Requires clinical eligibility determination.

Senior Care Options (SCO)

Massachusetts Senior Care Options

Age 65+, Massachusetts resident, eligible for MassHealth (Medicare optional), nursing home-level care need.

~$2,829/month (300% FBR, individual); QIT allowed.

$2,000 (individual), $3,000 (couple) (excludes home up to $713,000, car).

Not available in Dukes/Nantucket Counties; multiple SCO providers (e.g., CCA, Tufts).

Medicare Savings Program (MSP)

Massachusetts Medicare Savings Program (MassHealth Buy-In)

Age 65+ or disabled, Massachusetts resident, Medicare Part A/B.

~$2,510/month (QMB), ~$3,380/month (SLMB), ~$3,598/month (QI)—individual.

$9,430 (individual), $14,130 (couple).

Three tiers; no waitlist; includes Extra Help for Part D.

National Family Caregiver Support Program (NFCSP) Respite

Massachusetts NFCSP Respite Care

Caregivers of 60+ needing care or 55+ caregivers of others; Massachusetts resident; functional needs (2+ ADLs).

Prioritizes ~$24,980/year (individual); no strict cap.

Not assessed; need-based.

27 ASAPs; prioritizes low-income, rural caregivers.

Prescription Advantage

Massachusetts Prescription Advantage

Age 65+ or disabled, Massachusetts resident, enrolled in Medicare Part D (or ineligible for Medicare).

No strict limit; copays vary by income (~$24,980-$75,000/year individual).

Not assessed.

Supplements Medicare Part D; no enrollment fee for low-income.

Senior Community Service Employment Program (SCSEP)

Massachusetts SCSEP

Age 55+, unemployed, low-income, Massachusetts resident.

~$1,983/month (125% FPL).

Not specified; income-focused.

Priority for veterans, rural residents; AARP partnership.

VA Aid and Attendance (A&A) and Housebound Benefits

Massachusetts VA Aid and Attendance/Housebound

Age 65+ or disabled veteran/spouse, Massachusetts resident, wartime service, need for ADL help (A&A) or homebound.

Net income < ~$1,984/month (veteran with dependent, A&A); pension offsets income.

~$155,356 (net worth limit).

High veteran demand statewide.

Who we are

Your Senior Care Partner, Every Step of the Way

We help families find affordable senior communities and unlock same day discounts, Medicaid, and Medicare options tailored to your needs.

Contact us Today
Tour Icon
Planning a tour? Check our touring checklist.
Chat Icon
Thinking of living here? We can help you speak to a current resident