Almond Vista Healthcare

Nursing Home
Overview of Almond Vista Healthcare

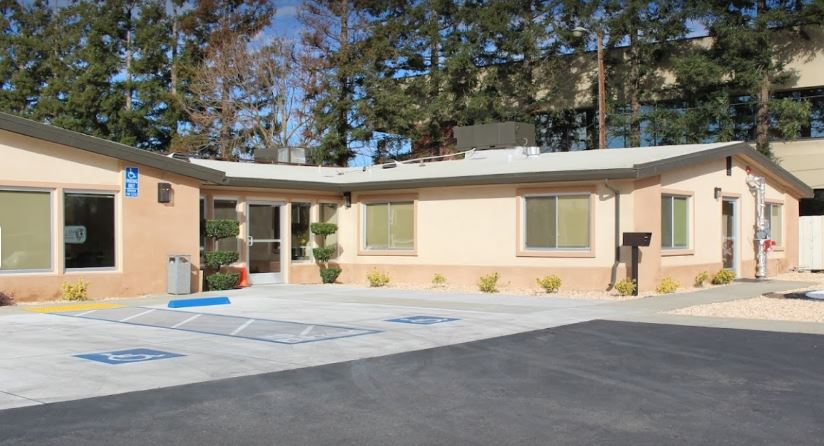
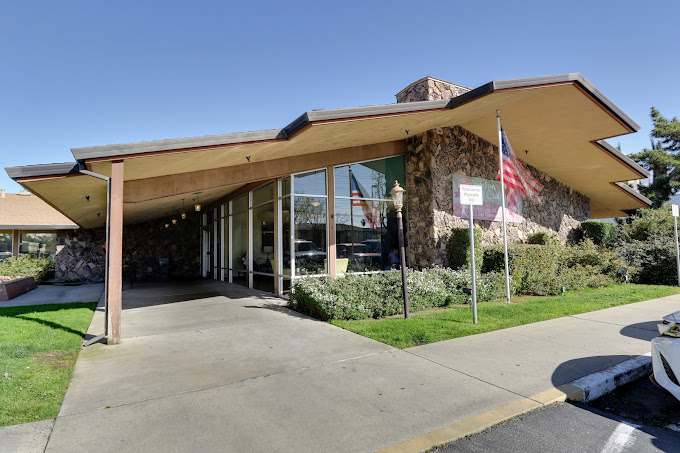
Almond Vista Healthcare is one Modesto’s skilled nursing facilities offering skilled nursing and rehabilitative services. They take pride in their quality skilled nursing services, where their residents receive 24/7 care and supervision, medication management, incontinence care, as well as memory care for residents living with Alzheimer’s and other forms of dementia. For residents or patients in their final stages of life, hospice care is also available.

This skilled nursing facility also provides weekly and monthly health monitoring and lab testing. They also provide a dietary program wherein they provide meals that are dietician approved, as well as oral supplements if required. 

Managed by Harris LaChance

Administrator

Harris LaChance serves as the Administrator at Almond Vista Healthcare, leading the community with a focus on providing quality care and support. As the community's Administrator, Harris ensures smooth operations and fosters a welcoming environment for residents and their families.

Quality ratings

Measured by Centers for Medicare & Medicaid Services (CMS)

Overall rating Info Official CMS rating based on health inspections, staffing and quality measures.
1/5
California average: 3.1/5
Health Inspection Info Official CMS rating based on deficiencies found during state health inspections.
1/5
California average: 2.8/5
Staffing Info Official CMS rating based on nurse staffing hours per resident per day.
3/5
California average: 3.1/5
Quality Measures Info Official CMS rating based on clinical outcomes for residents.
4/5
California average: 4.1/5

Nursing care per resident

Info Average daily nursing hours per resident (adjusted for acuity). Higher values indicate more nursing time per resident.
4h 0m per day

This home provides 5% less nursing time per resident than the state average.

California average: 4h 13m per day

Staffing hours breakdown

Info Hours of care per resident per day, broken down by staff type. Data from CMS Medicare.
Staff type Facility State avg National avg
Registered Nurse (RN) Info Registered nurse hours per resident per day. 22m per day 39m per day 41m per day
LPN / LVN Info Licensed Practical Nurse / Licensed Vocational Nurse hours per resident per day. 1h 23m per day 1h 13m per day 52m per day
Nurse Aide Info Nurse aide hours per resident per day. 2h 18m per day 2h 39m per day 2h 21m per day
Total Nursing (Weekend) Info Total number of nurse staff hours per resident per day on weekends. 3h 36m per day 4h 5m per day 3h 26m per day
Physical Therapist Info Physical therapist staff hours per resident per day. 4m per day 5m per day 4m per day
RN (Weekend) Info Registered nurse hours per resident per day on weekends. 14m per day 30m per day 29m per day

Capacity and availability

Medium-capacity home

Offers a balance of services and community atmosphere.

Total beds 175

This home usually has limited availability

Occupancy is moderate, suggesting balanced demand.

Similar demand to the California average
Occupancy rate 88.1%
Residents per day (avg) 165
Occupancy rate
88.1%
Residents per day (avg)
165

Who this home usually serves

TYPE OF STAY

Primarily short stays

Residents typically stay for brief periods, with frequent admissions and discharges throughout the year.

Might be optimal for
Post-acute recovery Temporary care Transitional stays

Breakdown by payment type

Medicare

20% of new residents, usually for short-term rehab.

Typical stay 29 days

Private pay

77% of new residents, often for short stays.

Typical stay 20 days

Medicaid

3% of new residents, often for long-term daily care.

Typical stay 4 years

Finances and operations

Proprietary home
Other
Home revenue
$29.9M
Operating loss
-$1.2M
Proprietary home Other
Home revenue
$29,882,161.00
Operating loss
$-1,194,430.00
Payroll costs Info The portion of the home's budget spent on staff, including nurses, caregivers, and other employees who support care and operations.
$12.0M
40.3% of revenue
Other operating costs Info All remaining costs needed to run the home, such as food, utilities, building maintenance, supplies and administrative expenses.
$19.0M
Total costs $31.1M
Walk Score
Walk Score: 76 / 100
Very walkable. Most errands can be accomplished on foot, and many essentials are within a short walk.

About this community

Care Services

Nursing Services
Rehabilitation Services
Skilled Nursing
Licensed Nurses/CNAs
24-Hour Staffing

Programs & Activities

Specific Programs
Skilled Nursing, Rehabilitation, Activities, Social Services
Religious Services
Yes
Operating Hours
Visiting hours from 8 am until 8 pm; 24-hour access with prior arrangement.

Types of Care at Almond Vista Healthcare

Nursing Home
Contact Almond Vista Healthcare

Compare Nursing Homes around Modesto

The information below is reported by the California Department of Social Services and Department of Public Health.
English Oaks Convalescent & Rehabilitation Hospital
MC

Memory Care Specialized care for those with Memory Loss, Alzheimer's, or dementia, ensuring safety and support.

SNF

Nursing Homes 24/7 care needed

Modesto
180
No
-
69
HILL, DEANNA
80.2%
$27,345,654.00
$12,385,632.00
45.3%
161.60
3/5
4.2746
3/5
4/5
3/5
-
56
1
-45%
+1%
-5%
Valley Skilled Nursing
SNF

Nursing Homes 24/7 care needed

Modesto
70
No
A+
65
-
62.2%
$12,300,502.00
$4,932,577.00
40.1%
52.00
3/5
3.3816
3/5
2/5
4/5
-
46
-
-6%
-20%
-27%
Golden Modesto
SNF

Nursing Homes 24/7 care needed

Modesto
120
No
-
74
-
77.7%
$11,357,047.00
$4,482,675.00
39.5%
107.30
2/5
4.4216
2/5
3/5
4/5
14
77
10
-33%
+5%
-8%
Almond Vista Healthcare
SNF

Nursing Homes 24/7 care needed

Modesto
175
No
-
76
-
88.1%
$29,663,379.00
$12,030,877.00
40.6%
164.50
1/5
4.0073
1/5
3/5
4/5
6
63
7
-45%
-5%
+4%
Garden City Healthcare Center
SNF

Nursing Homes 24/7 care needed

Modesto
104
No
A+
63
MORADKHANI, LAWRENCE
92.9%
$24,270,351.00
$7,933,803.00
32.7%
95.20
1/5
3.8858
1/5
3/5
3/5
2
60
2
-9%
-8%
+10%

Places of interest near Almond Vista Healthcare

Address 3.4 miles from city center — 1.7 miles to nearest hospital (Doctors Medical Center: Garcia Bonilla Julio C MD)

Address 2030 Evergreen Ave, Modesto, CA 95350

Calculate Travel Distance to Almond Vista Healthcare

Add your location

Address

Staffing Data

Source: CMS Payroll-Based Journal (Q2 2025)

256
Total Staff
254
Employees
2
Contractors
75,408
Total Hours (Quarter)
95
Avg Staff/Day
8.7
Avg Shift (hrs)
Nursing Staff Breakdown
Role Count Avg Shift (hrs) Uses Contractors?
Registered Nurse1210 No
Licensed Practical Nurse639.4 No
Certified Nursing Assistant1289.2 No
Staff by Category
Administration
2 staff
5.5hs shift avg
Nursing Staff
211 staff
9.3hs shift avg
Physicians & Practitioners
4 staff
8.2hs shift avg
Therapy Services
29 staff
6.4hs shift avg
Activities & Recreation
2 staff
8.5hs shift avg
Social Services
1 staff
4.8hs shift avg
Dietary Services
5 staff
8hs shift avg
Other Services
2 staff
8.4hs shift avg
Contractor Analysis
0.7%
of total hours from contractors
557 contractor hours this quarter
Occupational Therapy Assistant: 1 Medical Director: 1
Role Employees Contractors Total Staff Total Hours Days Worked % of Days Avg Shift (hrs)
Certified Nursing Assistant128012837,20391100%9.2
Licensed Practical Nurse6306319,39591100%9.4
Registered Nurse120123,52991100%10
Speech Language Pathologist7072,5088998%6.9
RN Director of Nursing8082,0346673%7.8
Other Dietary Services Staff4041,70891100%7.9
Clinical Nurse Specialist3031,4996673%8.3
Physical Therapy Aide5051,3036673%6.5
Respiratory Therapy Technician8081,1427987%6.6
Qualified Activities Professional2027817178%8.5
Physical Therapy Assistant7077758593%4.6
Dental Services Staff1016267481%8.5
Administrator1015206571%8
Nurse Practitioner1015206571%8
Occupational Therapy Aide1015206571%8
Dietitian1014605662%8.2
Occupational Therapy Assistant0114366571%6.7
Qualified Social Worker1012966268%4.8
Medical Director0111215156%2.4
Mental Health Service Worker1013244%8

Health Inspection History

Inspections
Total health inspections 10

California average 12.5


Last Health inspection on May 2025

Total health citations 63
Citations per inspection
6.3

Health citations are formal notices following inspections when they fail to comply with safety and care standards.

55 of 63 citations resulted from standard inspections; and 8 of 63 resulted from complaint investigations.

Breakdown of citation severity (last 3 years)
Critical Health citations More info 2
400% worse than California average

California average: 0.4


Serious Health citations More info 5
400% worse than California average

California average: 1

2 critical citations More info California average: 0.4

5 serious citations More info California average: 1

56 moderate citations More info California average: 47.2

0 minor citations More info California average: 1.5
Citations history (last 3 years)
Environmental moderate citation May 06, 2025
Corrected

Infection Control moderate citation May 06, 2025
Corrected

Infection Control moderate citation May 06, 2025
Corrected

Nursing Services moderate citation May 06, 2025
Corrected

Facility Characteristics

Source: CMS Long-Term Care Facility Characteristics (Data as of Jan 2026)

Ownership: For-Profit LLC
Resident Census by Payment Source
159 Total Residents
Medicare 19 (11.9%)
Medicaid 112 (70.4%)
Private Pay/Other 28 (17.6%)
Programs & Services
Residents' Group
Family Engagement

Active councils help families stay involved in care decisions and facility operations.

Quality of care over time

These measures show how residents usually do over time at this home, based on health outcomes and preventive care.

High-risk clinical events score Info A composite score based on pressure ulcers, falls with injury, weight loss, walking ability decline, and activities of daily living decline. 6.9
In line with California average

California average: 6.6

Functional decline score Info A composite score based on activities of daily living decline, walking ability decline, and incontinence. 10.8
In line with California average

California average: 11.3

Long-stay resident measures
Need for Help with Daily Activities Increased Info Percent of long-stay residents whose need for help with daily activities has increased 6.2%
44% better than California average

California average: 11.1%

Walking Ability Worsened Info Percent of long-stay residents whose ability to move independently worsened 13.5%
12% worse than California average

California average: 12.0%

Low Risk Residents with Bowel/Bladder Incontinence Info Percent of low risk long-stay residents who lose control of their bowels or bladder 12.9%
14% worse than California average

California average: 11.3%

Falls with Major Injury Info Percent of long-stay residents experiencing one or more falls with major injury 3.1%
85% worse than California average

California average: 1.7%

High Risk Residents with Pressure Ulcers Info Percent of long-stay high risk residents with pressure ulcers 7.6%
53% worse than California average

California average: 5.0%

Urinary Tract Infection Info Percent of long-stay residents with a urinary tract infection 0.7%
46% better than California average

California average: 1.2%

Lost Too Much Weight Info Percent of long-stay residents who lose too much weight 4.0%
6% better than California average

California average: 4.2%

Depressive Symptoms Info Percent of long-stay residents who have depressive symptoms 0.8%
88% better than California average

California average: 6.7%

Antipsychotic Use Info Percent of long-stay residents who received an antipsychotic medication 9.1%
10% better than California average

California average: 10.1%

Pneumococcal Vaccine Info Percent of long-stay residents assessed and appropriately given the pneumococcal vaccine 98.7%
In line with California average

California average: 98.5%

Influenza Vaccine Info Percent of long-stay residents assessed and appropriately given the seasonal influenza vaccine 98.4%
In line with California average

California average: 98.2%

Hospitalizations per 1,000 days Info Number of hospitalizations per 1,000 long-stay resident days. 3.60
60% worse than California average

California average: 2.25

ED visits per 1,000 days Info Number of outpatient emergency department visits per 1,000 long-stay resident days. 2.16
36% worse than California average

California average: 1.59

Short-stay resident measures
Pneumococcal Vaccine Info Percent of short-stay residents assessed and appropriately given the pneumococcal vaccine 99.7%
6% better than California average

California average: 94.0%

Antipsychotic medication increase Info Percent of short-stay residents who newly received an antipsychotic medication 0.6%
56% better than California average

California average: 1.5%

Influenza Vaccine Info Percent of short-stay residents assessed and appropriately given the seasonal influenza vaccine 96.0%
In line with California average

California average: 93.2%

Re-hospitalized after SNF stay Info Percentage of short-stay residents who were re-hospitalized after their nursing home admission. 30.9%
33% worse than California average

California average: 23.2%

Emergency department visits Info Percentage of short-stay residents who had an outpatient emergency department visit. 17.3%
54% worse than California average

California average: 11.2%

Falls with major injury Info Percentage of SNF residents who experience falls with major injury during their stay. 0.6%
29% better than California average

California average: 0.8%

Ability to care for self at discharge Info Percentage of residents at or above expected ability to care for themselves at discharge. 61.2%
14% better than California average

California average: 53.7%

Successful return to home or community Info Rate of successful return to home or community from a skilled nursing facility. 66.5%
32% better than California average

California average: 50.6%

Penalties and fines

Federal penalties imposed by CMS for regulatory violations, including civil money penalties (fines) and denials of payment for new Medicare/Medicaid admissions.

Source: CMS Penalties Database (Data as of Jan 2026)

Total fines amount $34K
38% lower than California average

California average: $55K

Number of fines 6
154% more fines than California average

California average: 2.4

Payment Denials Info Serious action where Medicare and/or Medicaid temporarily stops payments for new residents until issues are fixed. 0
100% fewer payment denials than California average

California average: 0.5

Fines amount comparison
This facility $34K
California average $55K
Penalty History

Penalties are imposed by CMS for violations of federal nursing home regulations.

Civil Money Penalty Info Fines imposed for noncompliance, which can be assessed per day or per instance of violation. Jan 16, 2025
$10K
Civil Money Penalty Info Fines imposed for noncompliance, which can be assessed per day or per instance of violation. Jan 2, 2024
$3K
Civil Money Penalty Info Fines imposed for noncompliance, which can be assessed per day or per instance of violation. Dec 11, 2023
$7K
Civil Money Penalty Info Fines imposed for noncompliance, which can be assessed per day or per instance of violation. Nov 20, 2023
$2K

Last updated: Jan 2026

Guides for Better Senior Living

Care Cost Calculator: See Prices in Your Area

Nursing Home Data Explorer

Don’t Wait Too Long: 7 Red Flag Signs Your Parent Needs Assisted Living Now

The True Cost of Assisted Living in 2025 – And How Families Are Paying For It

Understanding Senior Living Costs: Pricing Models, Discounts & Financial Assistance

Financial Aid for California Seniors

Get financial aid guidance

Multipurpose Senior Services Program

MSSP (Medi-Cal Waiver)

Age 65+, California resident, Medi-Cal eligible, nursing home risk.

~$2,829/month (300% FBR, individual).

$2,000 (individual), $3,000 (couple).

County-managed; waitlists possible.

In-Home Supportive Services (IHSS)

California IHSS

Age 65+, California resident, Medicaid-eligible or low-income.

~$1,732/month (individual, Medi-Cal threshold).

$2,000 (individual).

Can hire family as caregivers.

Multipurpose Senior Services Program (MSSP)

CA MSSP

Age 65+, California resident, Medi-Cal-eligible, nursing home-eligible but community-capable.

~$2,829/month (300% FBR, individual).

$2,000 (individual).

Available in 38 counties; waitlists common.

Property Tax Postponement Program (PTP)

CA PTP

Age 62+, California resident, own and live in home, 40% equity.

~$51,500/year (household, adjusted annually).

Equity-based; no strict asset cap.

Deferred taxes accrue interest (5% as of 2024); repaid upon sale/death.

Assisted Living Waiver (ALW)

CA ALW

Age 65+ or disabled, California resident, Medi-Cal-eligible, nursing home-eligible.

~$2,829/month (300% FBR, individual).

$2,000 (individual).

Available in 15 counties (e.g., LA, Sacramento); waitlists common.

California CARES Program

CA CARES

Caregivers of California residents 60+ needing help with 3+ daily activities; no caregiver age limit.

No strict limit; cost-sharing above ~$2,500/month threshold.

Not applicable; need-based.

High demand in urban areas; complements IHSS respite.

Low-Income Home Energy Assistance Program (LIHEAP)

CA LIHEAP

Age 60+ priority, California resident, low-income, utility/heating need.

~$2,510/month (200% of poverty level, individual).

Not applicable; income-focused.

High demand in inland/coastal extremes; weatherization capped at $5,000/home.

Who we are

Your Senior Care Partner, Every Step of the Way

We help families find affordable senior communities and unlock same day discounts, Medicaid, and Medicare options tailored to your needs.

Contact us Today
Tour Icon
Planning a tour? Check our touring checklist.
Chat Icon
Thinking of living here? We can help you speak to a current resident