Anchor Care & Rehabilitation Center

Nursing Home

Anchor Care & Rehabilitation Center

3325 NJ-35, Hazlet, NJ 07730 View Map
Nursing Home
icon
Care Cost Calculator: See Prices in Your Area Care Cost Calculator: See Prices in Your Area icon
Overview of Anchor Care & Rehabilitation Center

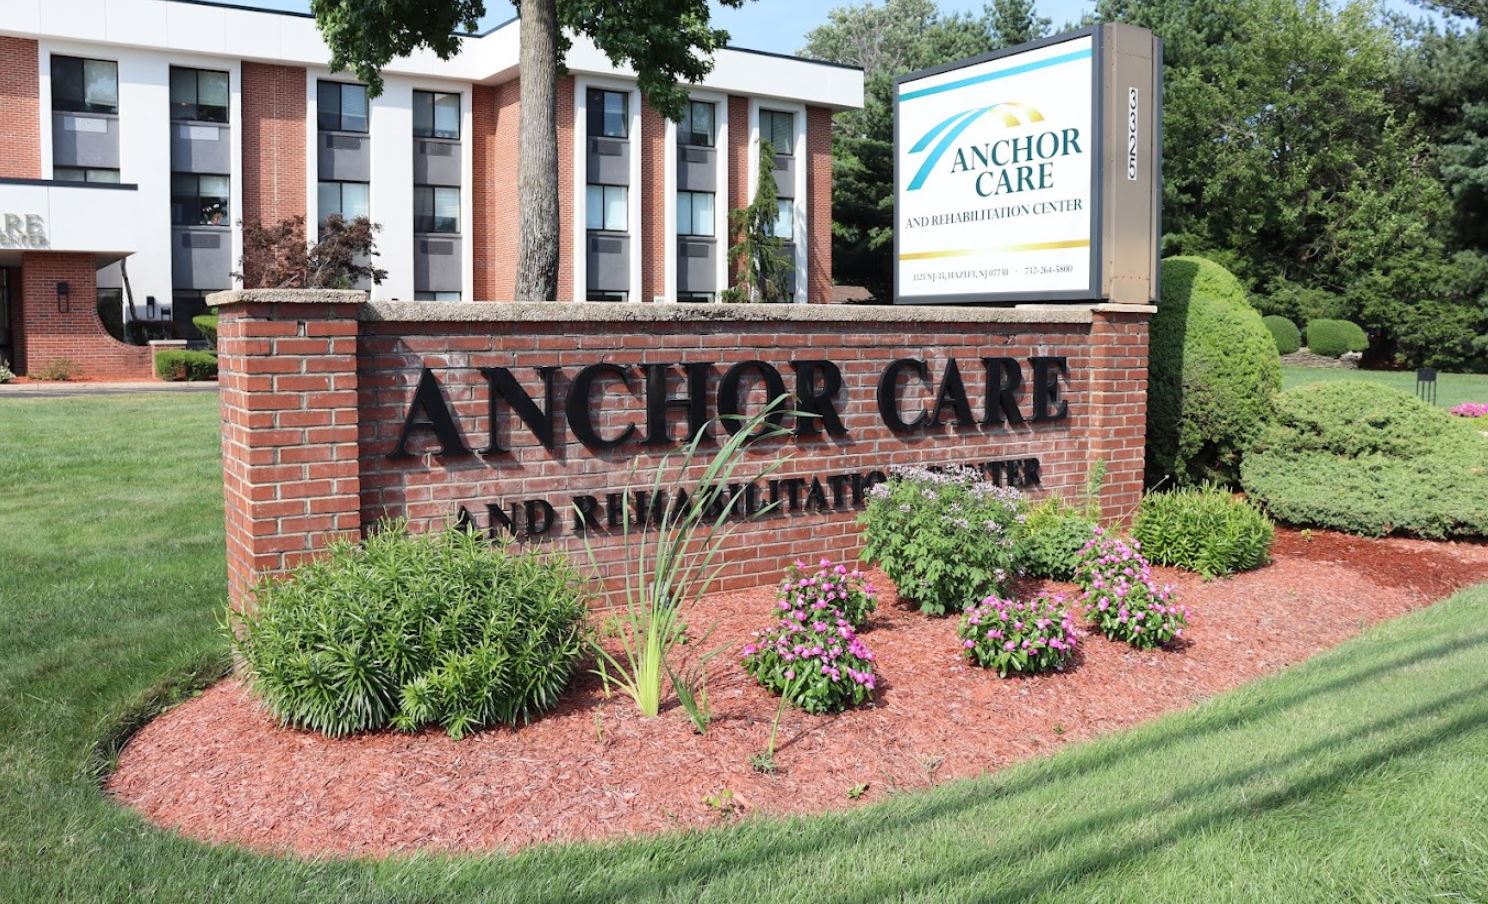
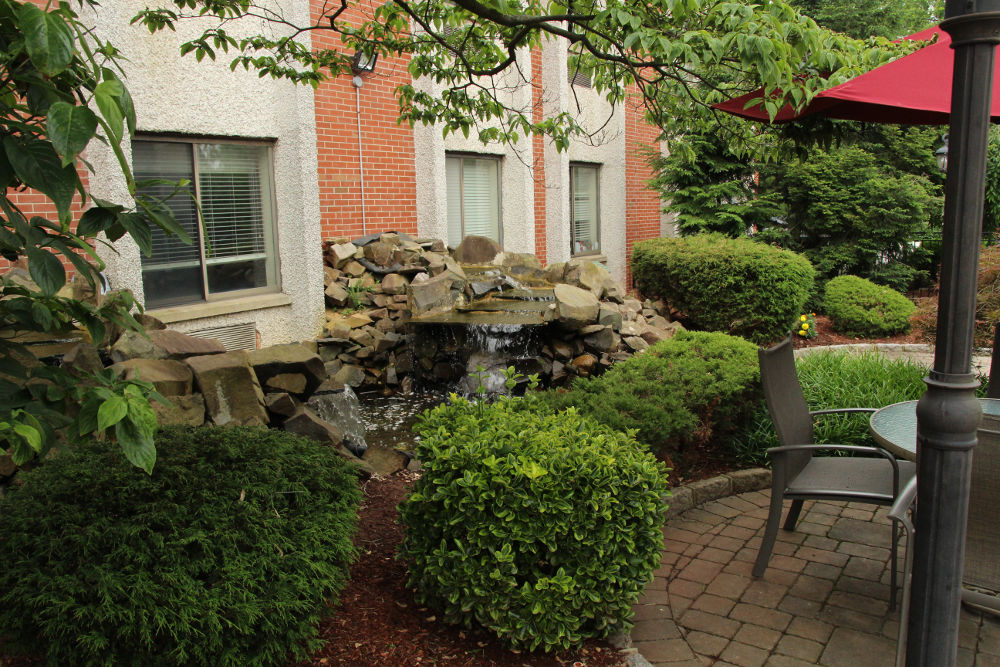
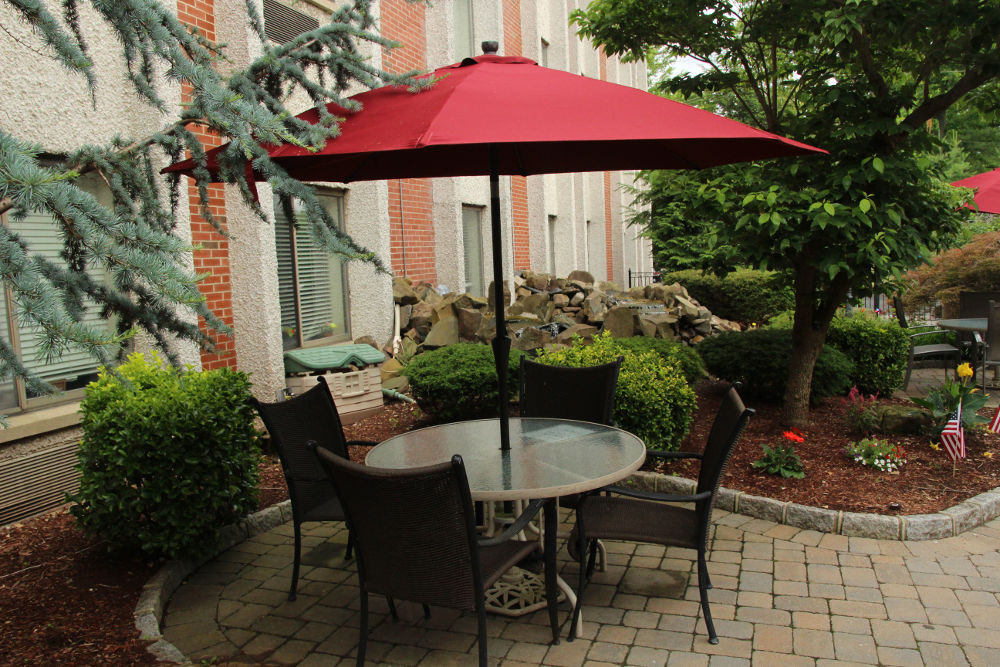
An esteemed senior living community set in the beautiful Hazlet, NJ, Anchor Care and Rehabilitation Center offers subacute rehab, cardiopulmonary rehab, and peritoneal dialysis. The community features welcoming and purposely built residences, maximizing seniors’ comfort and security. With a fusion of clinical expertise and the utmost care and assistance, Anchor Care and Rehabilitation Center exceeds expectations in ensuring seniors’ needs are well provided. Let go of your woes with a team of reliable and highly trained professionals providing exceptional care 24/7.

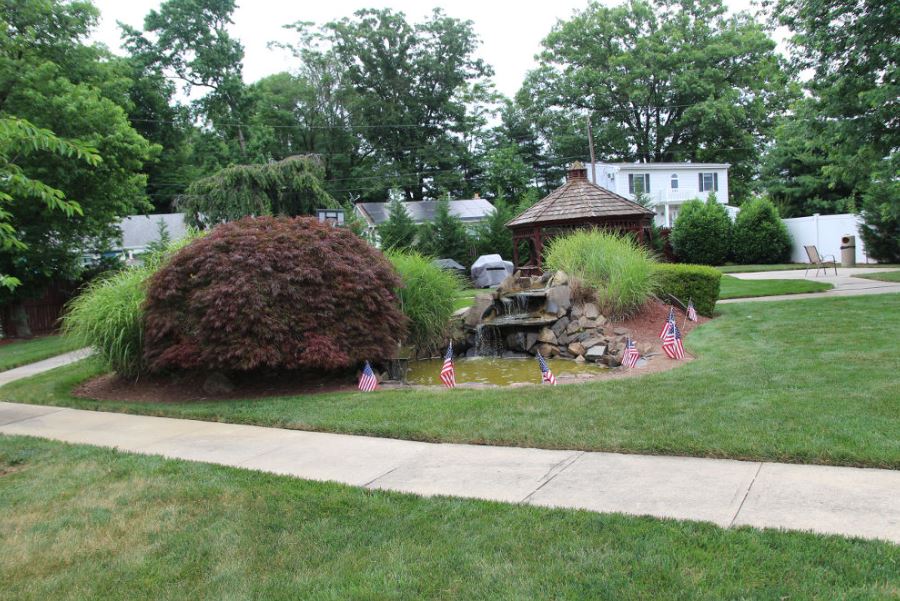
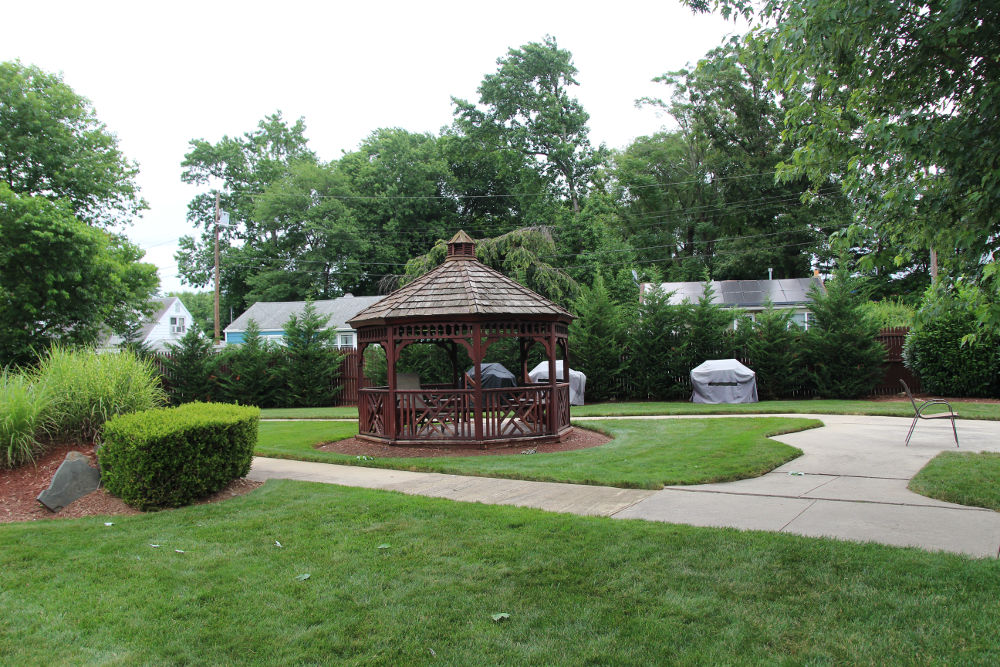
Reignite passions and seek for new knowledge with engaging activities and enjoyable learning programs. The community highly encourages seniors to live an active lifestyle surrounded by a supportive environment. Catering to residents’ dietary needs and preferences, the community serves healthy and tasty meals. Anchor Care and Rehabilitation Center is a place to find solace in your healing journey with its ethereal grounds embraced by lush gardens and peaceful views.

Quality ratings

Measured by Centers for Medicare & Medicaid Services (CMS)

Overall rating Info Official CMS rating based on health inspections, staffing and quality measures.
5/5
New Jersey average: 3.3/5
Health Inspection Info Official CMS rating based on deficiencies found during state health inspections.
4/5
New Jersey average: 2.8/5
Staffing Info Official CMS rating based on nurse staffing hours per resident per day.
2/5
New Jersey average: 3.0/5
Quality Measures Info Official CMS rating based on clinical outcomes for residents.
5/5
New Jersey average: 4.3/5

Nursing care per resident

Info Average daily nursing hours per resident (adjusted for acuity). Higher values indicate more nursing time per resident.
3h 15m per day

This home provides 16% less nursing time per resident than the state average.

New Jersey average: 3h 53m per day

Staffing hours breakdown

Info Hours of care per resident per day, broken down by staff type. Data from CMS Medicare.
Staff type Facility State avg National avg
Registered Nurse (RN) Info Registered nurse hours per resident per day. 32m per day 41m per day 41m per day
LPN / LVN Info Licensed Practical Nurse / Licensed Vocational Nurse hours per resident per day. 43m per day 56m per day 52m per day
Nurse Aide Info Nurse aide hours per resident per day. 2h 4m per day 2h 14m per day 2h 21m per day
Total Nursing (Weekend) Info Total number of nurse staff hours per resident per day on weekends. 3h 2m per day 3h 27m per day 3h 26m per day
Physical Therapist Info Physical therapist staff hours per resident per day. 4m per day 6m per day 4m per day
RN (Weekend) Info Registered nurse hours per resident per day on weekends. 17m per day 29m per day 29m per day

Capacity and availability

Medium-capacity home

Offers a balance of services and community atmosphere.

Total beds 170

This home usually has availability

Lower occupancy suggests more openings may be available.

Lower demand than the New Jersey average
Occupancy rate 82.4%
Residents per day (avg) 143
Occupancy rate
82.4%
Residents per day (avg)
143

Who this home usually serves

TYPE OF STAY

Mostly long-term care residents

Most residents stay for extended periods and receive ongoing daily care.

Might be optimal for
Long-term daily care Ongoing support needs

Breakdown by payment type

Medicare

47% of new residents, usually for short-term rehab.

Typical stay 1 - 2 months

Private pay

3% of new residents, often for short stays.

Typical stay 1 years

Medicaid

50% of new residents, often for long-term daily care.

Typical stay 6 - 7 months

Finances and operations

Proprietary home
Corporation
Home revenue
$22.5M
Operating loss
-$1.1M
Proprietary home Corporation
Home revenue
$22,455,785.00
Operating loss
$-1,059,578.00
Payroll costs Info The portion of the home's budget spent on staff, including nurses, caregivers, and other employees who support care and operations.
$4.9M
21.7% of revenue
Other operating costs Info All remaining costs needed to run the home, such as food, utilities, building maintenance, supplies and administrative expenses.
$18.6M
Total costs $23.5M
Bed community size
170-bed community
A large-scale community that may provide a wide range of amenities, services, and structured programs.
Walk Score
Walk Score: 69 / 100
Moderately walkable. Some errands can be accomplished on foot, with a mix of nearby amenities.

About this community

Occupancy Rate
81%
Occupied Beds
138 of 170
Percentage of available beds currently in use by residents.
License Status
Active
Facility Type
Long Term Care Facility
License Expiration
May 31, 2026

Additional licensing details

License number: 61303
CMS Certification Number: 315314

Ownership & operating entity

Anchor Care & Rehabilitation Center is legally operated by HAZLET GARDEN GROUP LLC, and administrated by REUVEN FURER.

Officers

Info Officers are individuals or entities with formal legal or financial responsibility for the organization that owns this facility

Mr . Cheskel Berkowitz, Mr . Isaac Wiener, Mr . Joel Zupnick, Mr . Joel Liefer, Samuel Berkowitz

Type Of Units

Long Term Care
170 units
Total beds
170 units

Care Services

Nursing Services
Rehabilitation Services
Respite Care
Skilled Nursing
24-Hour Staffing

Dining & Nutrition

Food Description
Restaurant Style Dining Room with 3 Daily Meals and Individualized Nutritional Program offered.
Meals Included
Yes
Meals Per Day
3
Meal Plan Options
Individualized Nutritional Program offered.

What does this home offer?

Housing options icon

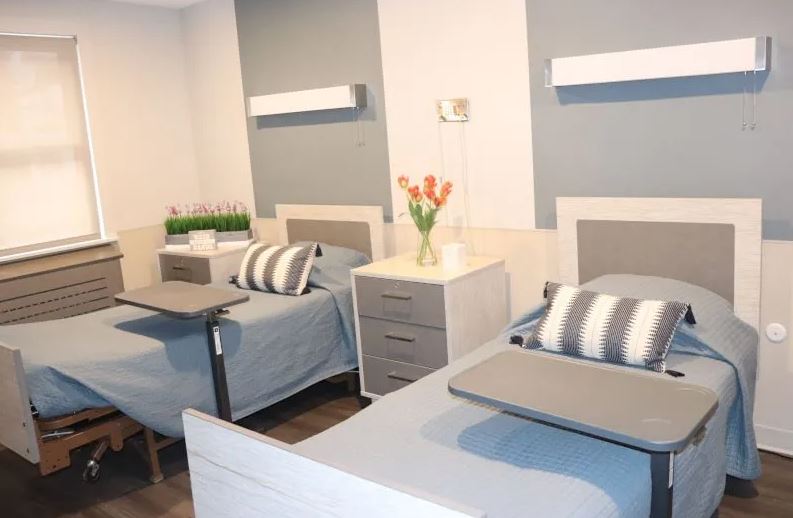
Housing Options: 1 Bed / 2 Bed

Building type icon
Building type icon

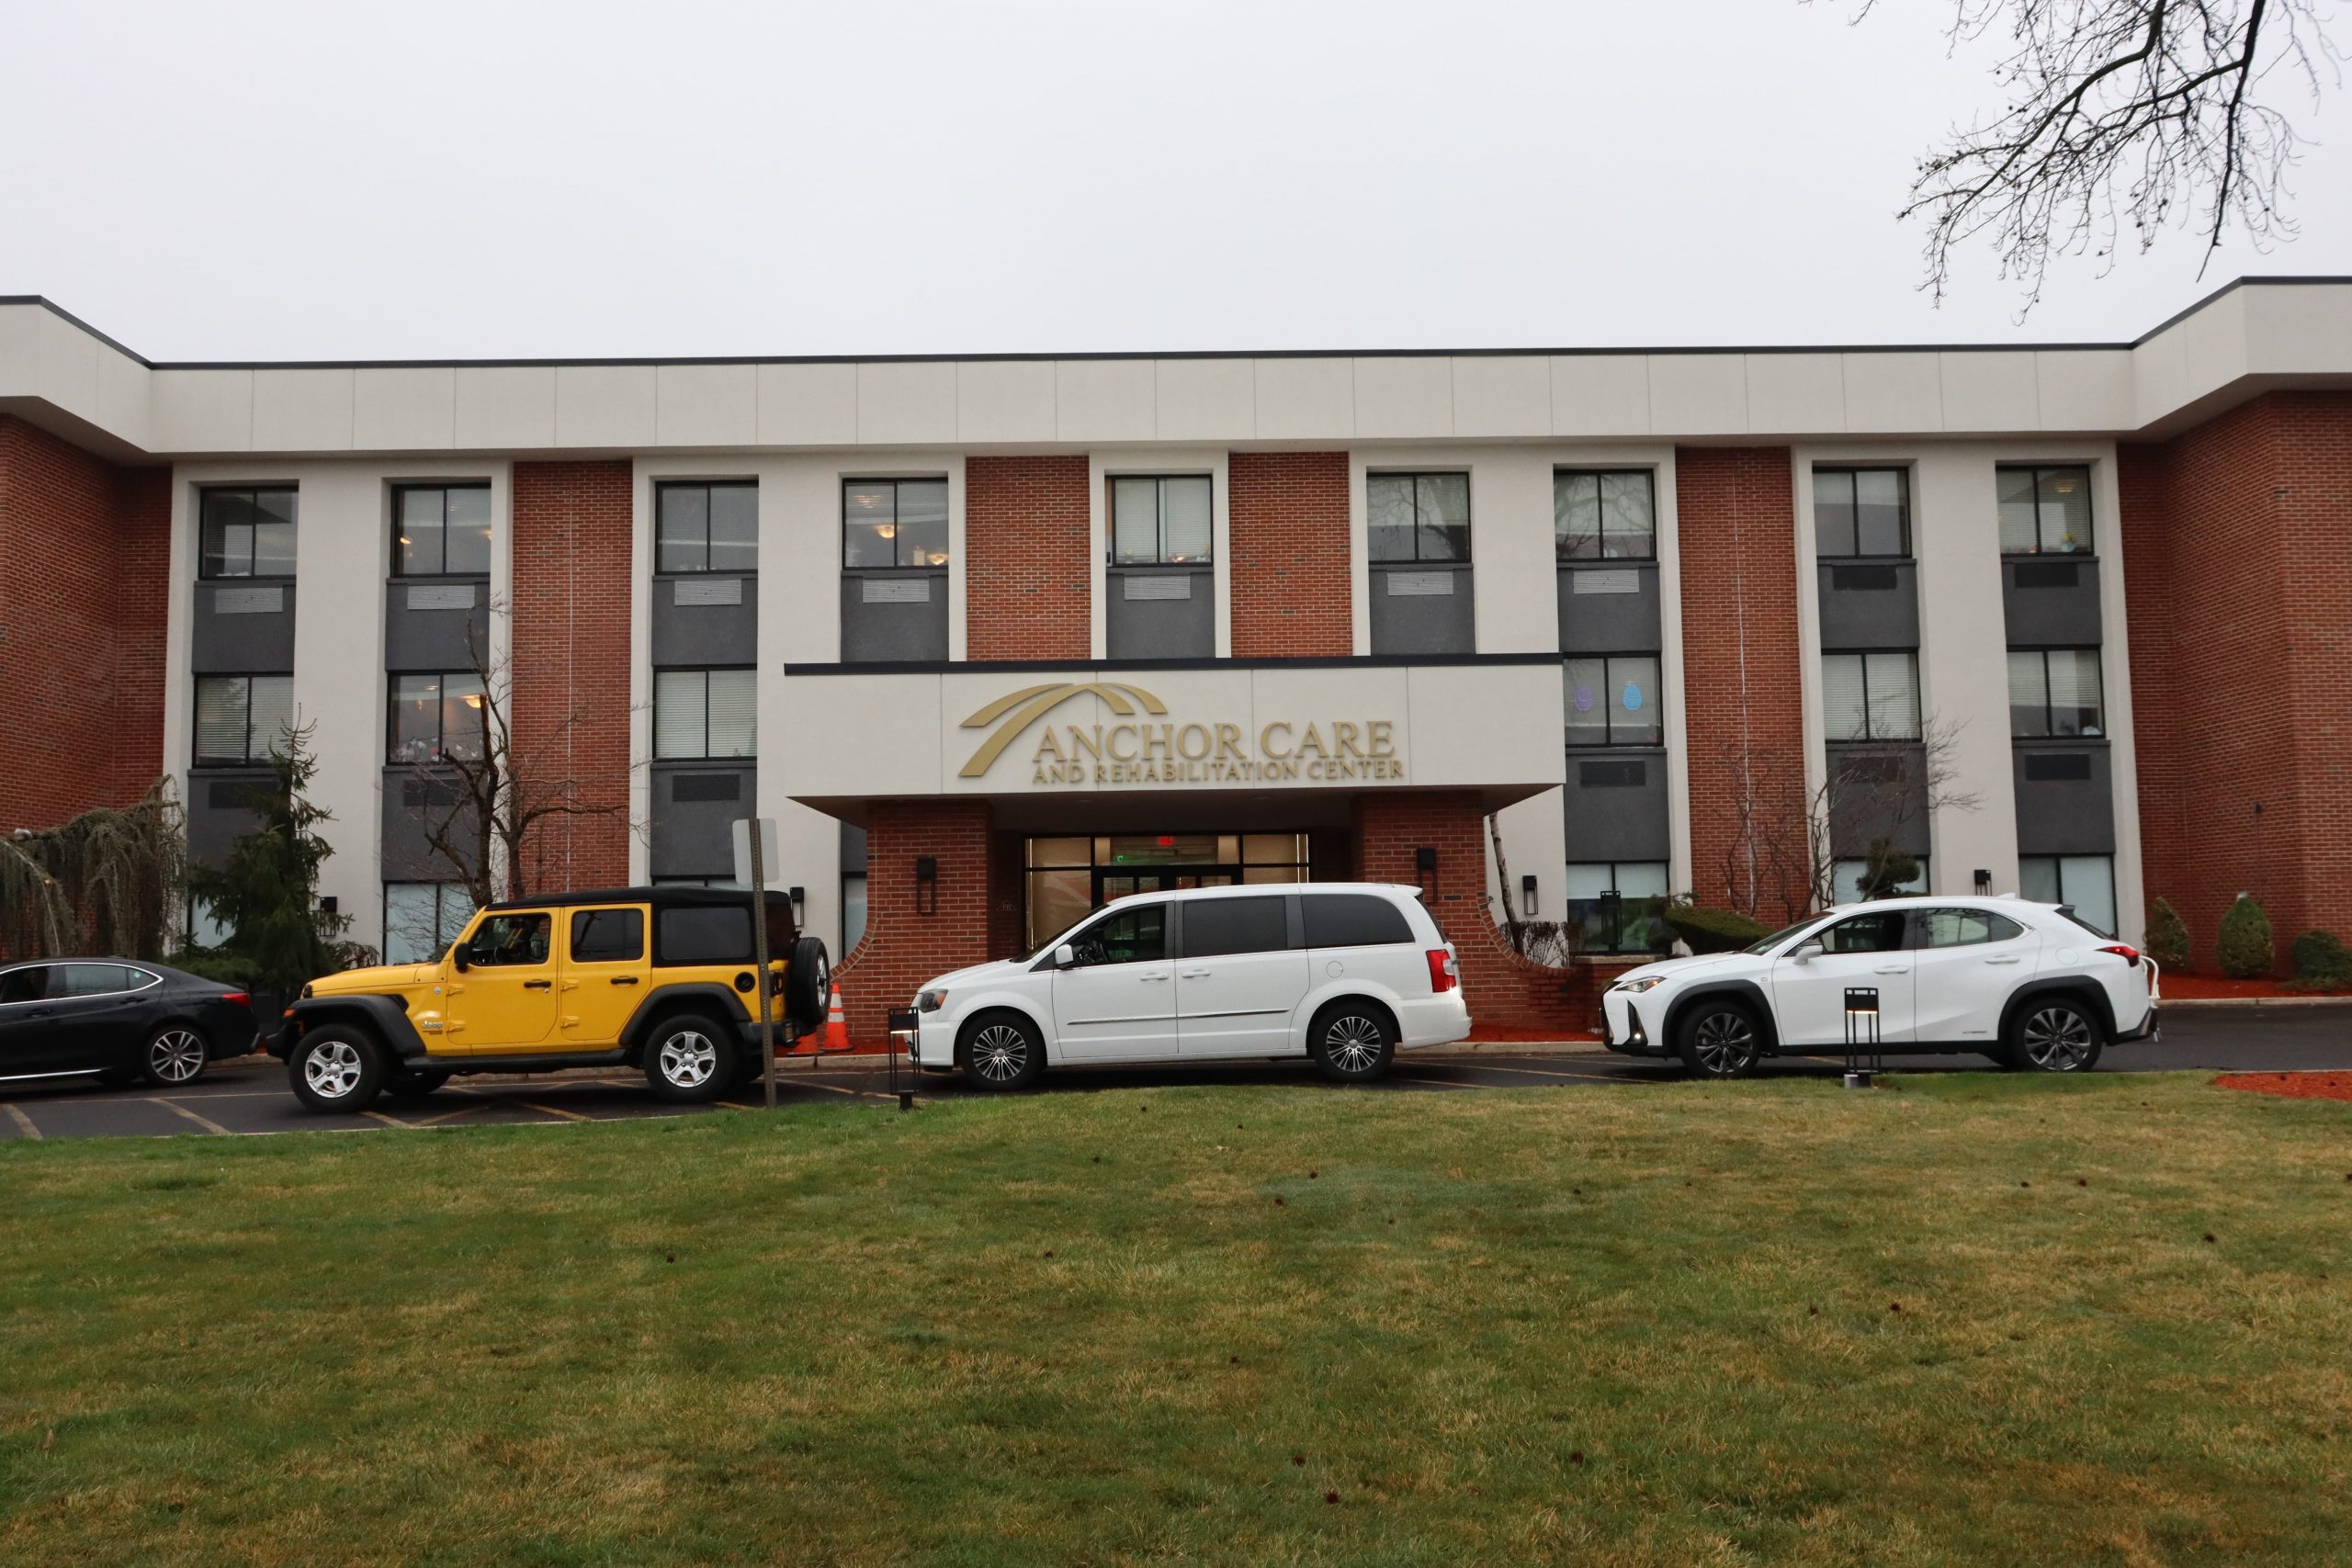
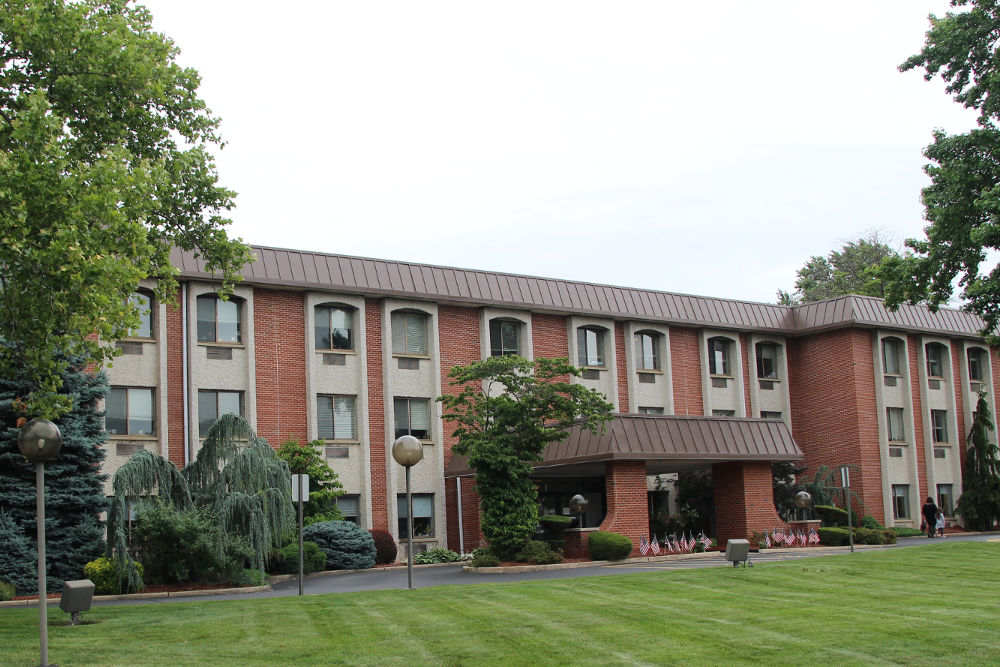
Building Type: 3-story

Fitness and recreation icon

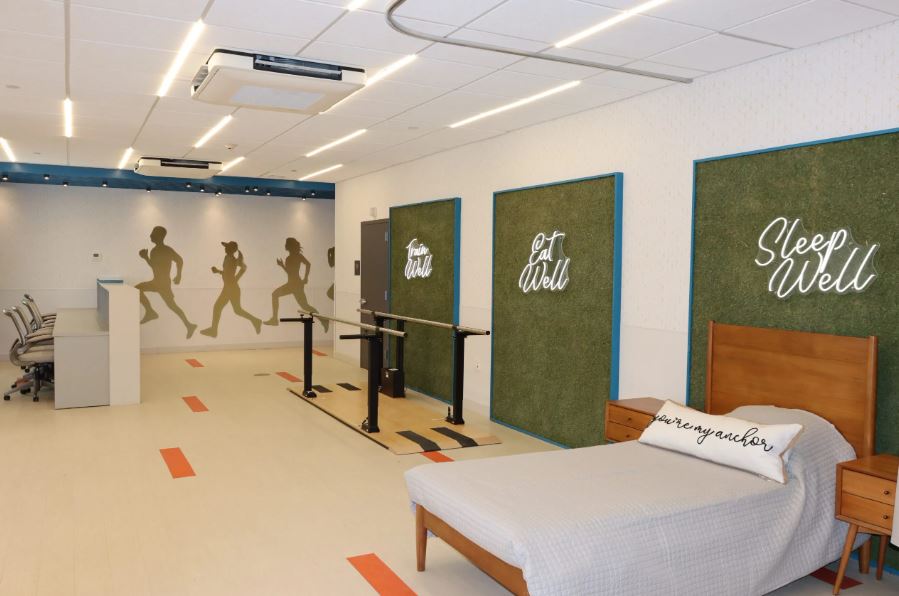
Fitness and Recreation

Types of Care at Anchor Care & Rehabilitation Center

Nursing Home

Inspection History

In New Jersey, the Department of Health, Health Facilities Evaluation and Licensing conducts mandatory unannounced surveys to ensure facilities provide safe and effective resident care.

20 visits/inspections

7 complaint inspections

13 routine inspections

Routine Scope And Severity F – Moderate Concern

On a scale from A (least severe) to L (most severe).

Latest inspection

Date:November 20, 2025

24 deficiencies

Deficiencies indicate regulatory issues. A higher number implies the facility had several areas requiring improvement.

15 deficiencies identified during routine visits

Deficiencies indicate regulatory issues. A higher number implies the facility had several areas requiring improvement.

Compare Nursing Homes around Hazlet

The information below is reported by the New Jersey Department of Health, Health Facilities Evaluation and Licensing.
Anchor Care & Rehabilitation Center
SNF

Nursing Homes 24/7 care needed

Hazlet
170
No
69
HAZLET GARDEN GROUP, LLC
82.4%
$21,398,341.00
$4,874,359.00
22.8%
142.70
5/5
3.2521
4/5
2/5
5/5
18
-49%
-16%
+7%
1 Bed / 2 Bed

Places of interest near Anchor Care & Rehabilitation Center

Address 2.1 miles from city center

Address 3325 NJ-35, Hazlet, NJ 07730

Calculate Travel Distance to Anchor Care & Rehabilitation Center

Add your location

Address

Staffing Data

Source: CMS Payroll-Based Journal (Q2 2025)

267
Total Staff
101
Employees
166
Contractors
52,599
Total Hours (Quarter)
78
Avg Staff/Day
7.4
Avg Shift (hrs)
Nursing Staff Breakdown
Role Count Avg Shift (hrs) Uses Contractors?
Registered Nurse137.4 Yes
Licensed Practical Nurse608 Yes
Certified Nursing Assistant1667.2 Yes
Staff by Category
Administration
1 staff
7.5hs shift avg
Nursing Staff
239 staff
7.4hs shift avg
Physicians & Practitioners
5 staff
7.7hs shift avg
Therapy Services
10 staff
7.8hs shift avg
Activities & Recreation
0 staff
0hs shift avg
Social Services
2 staff
6.9hs shift avg
Dietary Services
8 staff
7.6hs shift avg
Other Services
2 staff
7.7hs shift avg
Contractor Analysis
27.3%
of total hours from contractors
14,353 contractor hours this quarter
Certified Nursing Assistant: 129 Licensed Practical Nurse: 35 Registered Nurse: 1 Respiratory Therapy Technician: 1
Role Employees Contractors Total Staff Total Hours Days Worked % of Days Avg Shift (hrs)
Certified Nursing Assistant3712916627,11091100%7.2
Licensed Practical Nurse2535609,53091100%8
Registered Nurse121135,03291100%7.4
Other Dietary Services Staff8082,78591100%7.6
Clinical Nurse Specialist4041,9267380%7.7
Physical Therapy Assistant3031,4197077%7.8
Respiratory Therapy Technician3141,1136976%7.8
Mental Health Service Worker2029396875%7.7
Nurse Practitioner1015006571%7.7
Administrator1014886571%7.5
Speech Language Pathologist1014796066%8
Other Social Services Staff1014646066%7.7
Occupational Therapy Aide1014456066%7.4
Qualified Social Worker1013545965%6
Physical Therapy Aide1011522%7.5

Health Inspection History

Inspections
Total health inspections 5

New Jersey average 4


Last Health inspection on Jun 2025

Total health citations 18
Citations per inspection
3.6

Health citations are formal notices following inspections when they fail to comply with safety and care standards.

16 of 18 citations resulted from standard inspections; and 2 of 18 resulted from complaint investigations.

Breakdown of citation severity (last 3 years)
Critical Health citations More info 0
100% better than New Jersey average

New Jersey average: 0.7


Serious Health citations More info 0
100% better than New Jersey average

New Jersey average: 0.4

0 critical citations More info New Jersey average: 0.7

0 serious citations More info New Jersey average: 0.4

18 moderate citations More info New Jersey average: 19.3

0 minor citations More info New Jersey average: 0.5
Citations history (last 3 years)
Infection Control moderate citation Jun 19, 2025
Corrected

Pharmacy moderate citation Jun 19, 2025
Corrected

Quality of Care moderate citation Jun 19, 2025
Corrected

Quality of Care moderate citation Jun 19, 2025
Corrected

Facility Characteristics

Source: CMS Long-Term Care Facility Characteristics (Data as of Jan 2026)

Ownership: For-Profit LLC
Part of: Excelsior Care Group
Resident Census by Payment Source
146 Total Residents
Medicare 46 (31.5%)
Medicaid 84 (57.5%)
Private Pay/Other 16 (11%)

Quality of care over time

These measures show how residents usually do over time at this home, based on health outcomes and preventive care.

High-risk clinical events score Info A composite score based on pressure ulcers, falls with injury, weight loss, walking ability decline, and activities of daily living decline. 6.4
6% better than New Jersey average

New Jersey average: 6.8

Functional decline score Info A composite score based on activities of daily living decline, walking ability decline, and incontinence. 8.0
36% better than New Jersey average

New Jersey average: 12.4

Long-stay resident measures
Need for Help with Daily Activities Increased Info Percent of long-stay residents whose need for help with daily activities has increased 11.2%
12% worse than New Jersey average

New Jersey average: 10.1%

Walking Ability Worsened Info Percent of long-stay residents whose ability to move independently worsened 8.2%
25% better than New Jersey average

New Jersey average: 11.0%

Low Risk Residents with Bowel/Bladder Incontinence Info Percent of low risk long-stay residents who lose control of their bowels or bladder 4.5%
72% better than New Jersey average

New Jersey average: 16.0%

Falls with Major Injury Info Percent of long-stay residents experiencing one or more falls with major injury 2.7%
10% worse than New Jersey average

New Jersey average: 2.4%

High Risk Residents with Pressure Ulcers Info Percent of long-stay high risk residents with pressure ulcers 6.3%
In line with New Jersey average

New Jersey average: 6.1%

Urinary Tract Infection Info Percent of long-stay residents with a urinary tract infection 1.1%
17% worse than New Jersey average

New Jersey average: 1.0%

Lost Too Much Weight Info Percent of long-stay residents who lose too much weight 3.5%
25% better than New Jersey average

New Jersey average: 4.6%

Depressive Symptoms Info Percent of long-stay residents who have depressive symptoms 52.9%
368% worse than New Jersey average

New Jersey average: 11.3%

Antipsychotic Use Info Percent of long-stay residents who received an antipsychotic medication 13.6%
23% worse than New Jersey average

New Jersey average: 11.1%

Pneumococcal Vaccine Info Percent of long-stay residents assessed and appropriately given the pneumococcal vaccine 100.0%
8% better than New Jersey average

New Jersey average: 93.0%

Influenza Vaccine Info Percent of long-stay residents assessed and appropriately given the seasonal influenza vaccine 100.0%
In line with New Jersey average

New Jersey average: 97.2%

Hospitalizations per 1,000 days Info Number of hospitalizations per 1,000 long-stay resident days. 1.48
29% better than New Jersey average

New Jersey average: 2.08

ED visits per 1,000 days Info Number of outpatient emergency department visits per 1,000 long-stay resident days. 0.83
26% better than New Jersey average

New Jersey average: 1.12

Short-stay resident measures
Pneumococcal Vaccine Info Percent of short-stay residents assessed and appropriately given the pneumococcal vaccine 100.0%
27% better than New Jersey average

New Jersey average: 78.9%

Antipsychotic medication increase Info Percent of short-stay residents who newly received an antipsychotic medication 1.6%
36% worse than New Jersey average

New Jersey average: 1.2%

Influenza Vaccine Info Percent of short-stay residents assessed and appropriately given the seasonal influenza vaccine 100.0%
25% better than New Jersey average

New Jersey average: 80.1%

Re-hospitalized after SNF stay Info Percentage of short-stay residents who were re-hospitalized after their nursing home admission. 17.3%
32% better than New Jersey average

New Jersey average: 25.4%

Emergency department visits Info Percentage of short-stay residents who had an outpatient emergency department visit. 5.3%
35% better than New Jersey average

New Jersey average: 8.2%

Falls with major injury Info Percentage of SNF residents who experience falls with major injury during their stay. 0.4%
49% better than New Jersey average

New Jersey average: 0.8%

Ability to care for self at discharge Info Percentage of residents at or above expected ability to care for themselves at discharge. 53.1%
In line with New Jersey average

New Jersey average: 53.7%

Successful return to home or community Info Rate of successful return to home or community from a skilled nursing facility. 49.1%
In line with New Jersey average

New Jersey average: 50.6%

Guides for Better Senior Living

Care Cost Calculator: See Prices in Your Area

Nursing Home Data Explorer

Don’t Wait Too Long: 7 Red Flag Signs Your Parent Needs Assisted Living Now

The True Cost of Assisted Living in 2025 – And How Families Are Paying For It

Understanding Senior Living Costs: Pricing Models, Discounts & Financial Assistance

Financial Aid for New Jersey Seniors

Get financial aid guidance

Managed Long Term Services and Supports

NJ Medicaid MLTSS

Age 65+ or disabled, New Jersey resident, Medicaid- eligible, nursing home-level care need.

~$2,829/month (300% FBR, individual).

$2,000 (individual), $3,000 (couple).

High urban demand; managed care model.

JACC (Jersey Assistance for Community Caregiving)

NJ JACC

Age 60+, New Jersey resident, at risk of nursing home.

~$2,500/month (individual, varies).

$40,000 (individual).

Higher asset limit; limited funding.

Pharmaceutical Assistance to the Aged and Disabled (PAAD)

New Jersey PAAD

Age 65+, NJ resident, enrolled in Medicare Part D or eligible.

~$42,142/year (individual), ~$49,209/year (couple).

Not assessed.

Copays $5 (generic), $7 (brand); covers Part D premiums up to benchmark.

Senior Gold Prescription Discount Program

New Jersey Senior Gold

Age 65+, NJ resident, enrolled in Medicare Part D or eligible.

~$42,142-$52,142/year (individual), ~$49,209-$59,209/year (couple).

Not assessed.

Copays $15 + 50% of remaining cost; no premium assistance.

Medicare Savings Program (MSP)

New Jersey Medicare Savings Program

Age 65+ or disabled, NJ resident, Medicare Part A/B.

~$2,510/month (QMB), ~$3,380/month (SLMB), ~$3,598/month (QI)—individual.

$9,430 (individual), $14,130 (couple).

Three tiers; no waitlist; includes Extra Help for Part D.

Senior Freeze (Property Tax Reimbursement)

New Jersey Senior Freeze

Age 65+ by Dec 31 prior year, NJ resident, homeowner, paid property taxes.

~$150,000/year (combined household, projected).

Not assessed; home ownership required.

Combines with ANCHOR/Stay NJ via PAS-1; annual application.

ANCHOR (Affordable NJ Communities for Homeowners and Renters)

New Jersey ANCHOR

Age 65+ prioritized, NJ resident, homeowner/renter, paid property taxes/rent.

~$150,000/year (homeowners), ~$75,000/year (renters).

Not assessed.

Combines with Senior Freeze/Stay NJ; broader than prior Homestead program.

Stay NJ

New Jersey Stay NJ

Age 65+ by Dec 31 prior year, NJ resident, homeowner, lived in home 10+ years.

~$500,000/year (projected, subject to final regs).

Not assessed; home ownership required.

Up to 50% tax credit (max $6,500); phased implementation.

Universal Service Fund (USF)

New Jersey Universal Service Fund

Age 65+ prioritized, NJ resident, utility customer, low-income.

~$3,970/month (individual, 185% FPL).

Not assessed; income-focused.

Must owe >$25 on bill; combines with LIHEAP if eligible.

Home Energy Assistance Program (LIHEAP)

New Jersey LIHEAP

Age 60+ prioritized, NJ resident, low-income household.

~$3,970/month (individual, 185% FPL).

Not assessed; income-focused.

Covers oil, gas, electric; emergency aid available.

NJ Family Caregiver Support Program (via NFCSP)

New Jersey Family Caregiver Support Program

Caregivers of 60+ needing care or 55+ caregivers of others; NJ resident; functional needs (2+ ADLs).

Prioritizes ~$24,980/year (individual); no strict cap.

Not assessed; need-based.

21 AAAs; rural/low-income priority.

VA Aid and Attendance (A&A) and Housebound Benefits

New Jersey VA Aid and Attendance/Housebound

Age 65+ or disabled veteran/spouse, NJ resident, wartime service, need for ADL help (A&A) or homebound.

Net income < ~$1,984/month (veteran with dependent, A&A); pension offsets income.

~$155,356 (net worth limit).

High veteran demand in urban/rural areas.

Who we are

Your Senior Care Partner, Every Step of the Way

We help families find affordable senior communities and unlock same day discounts, Medicaid, and Medicare options tailored to your needs.

Contact us Today