Memory Care Home

Apple Rehab Laurel Woods

Memory Care Home

Apple Rehab Laurel Woods

451 N High St, East Haven, CT 06512 View map
Overview of Apple Rehab Laurel Woods

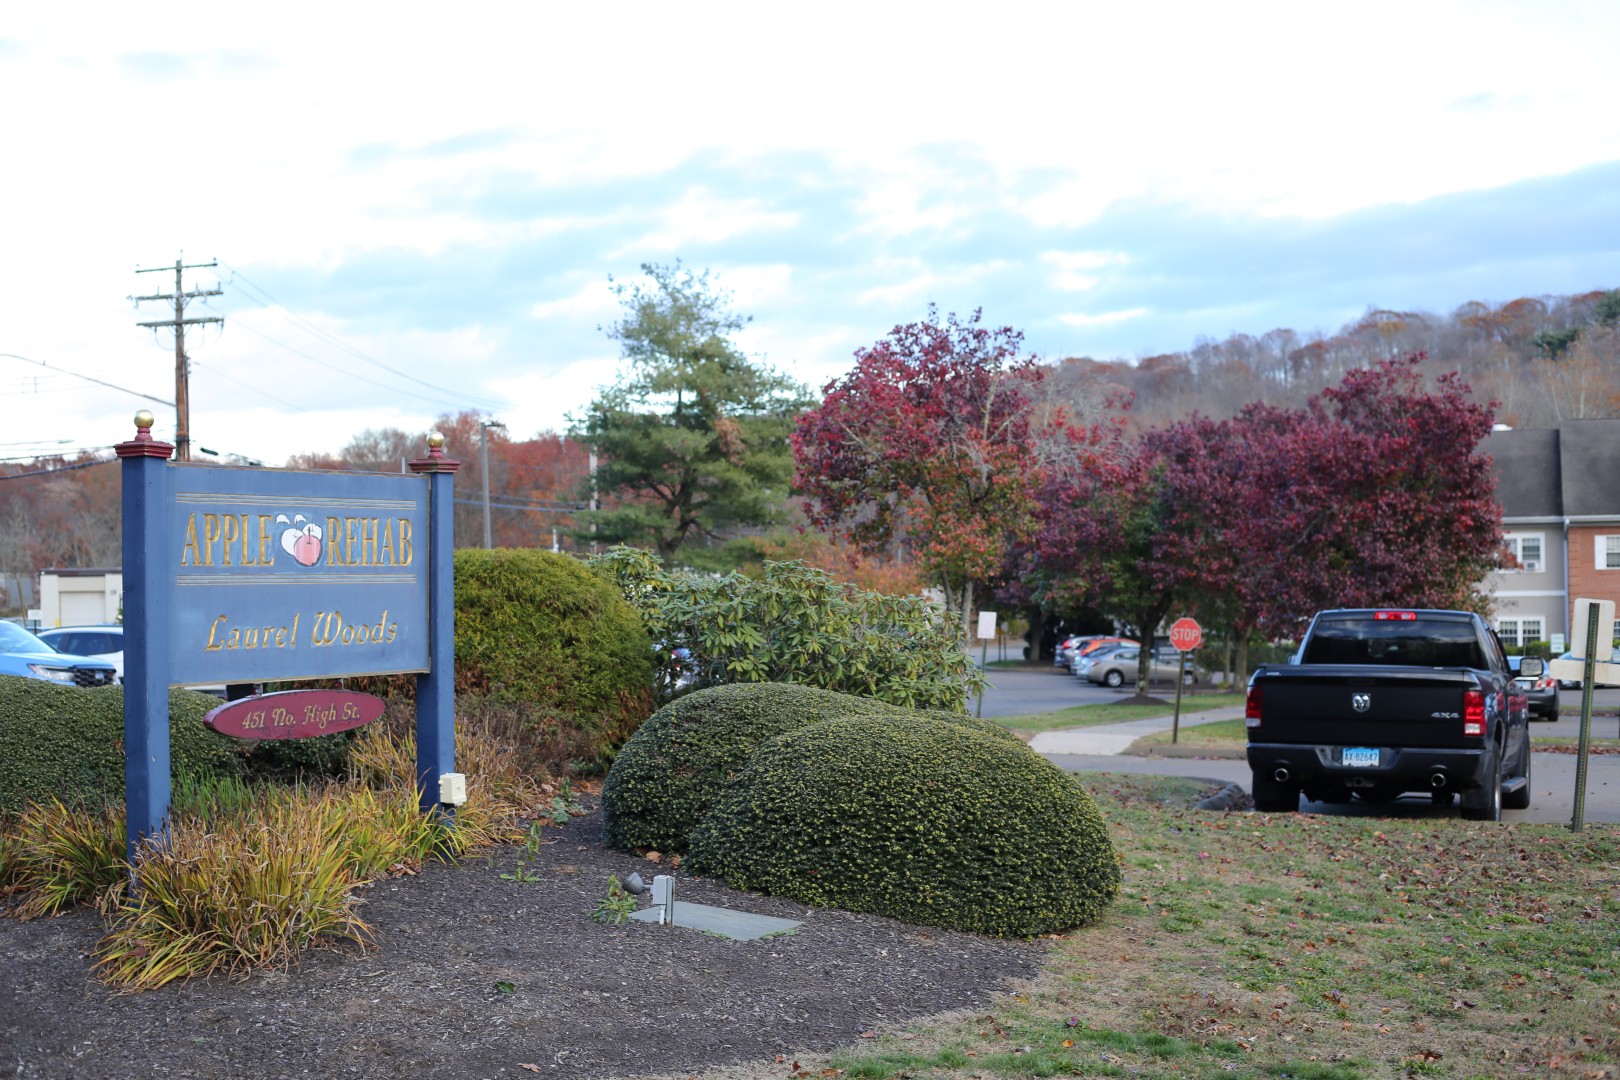
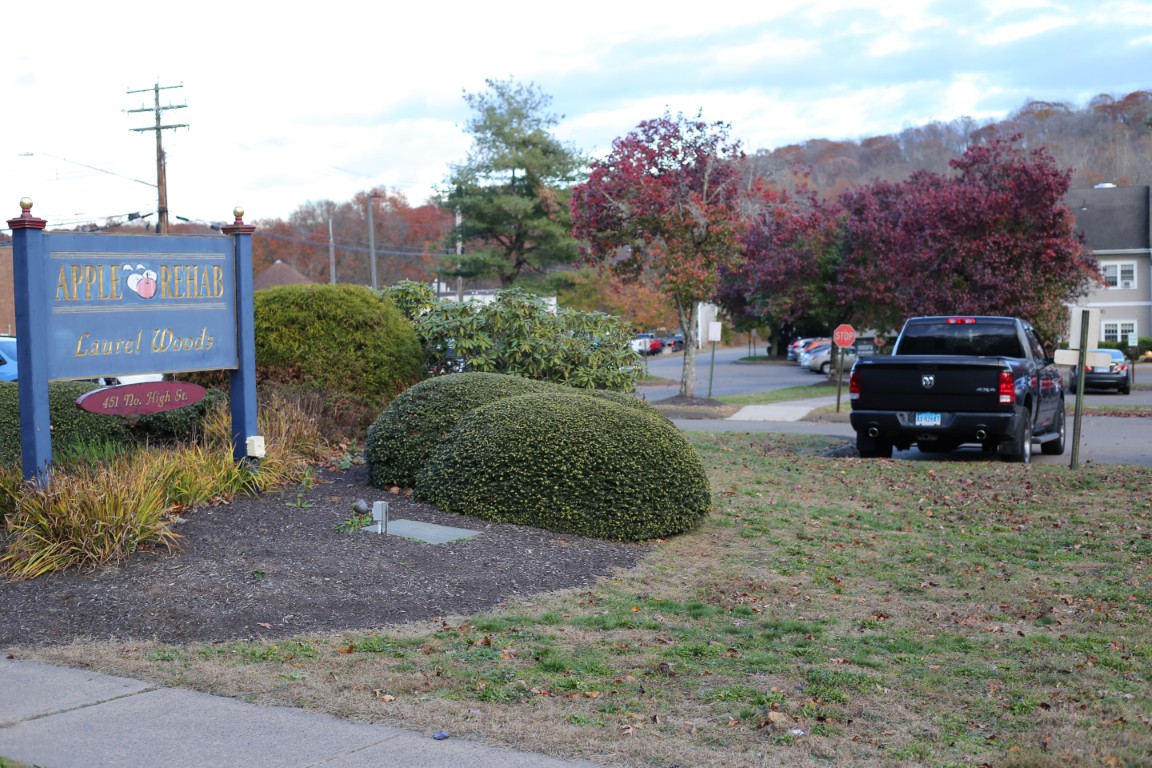
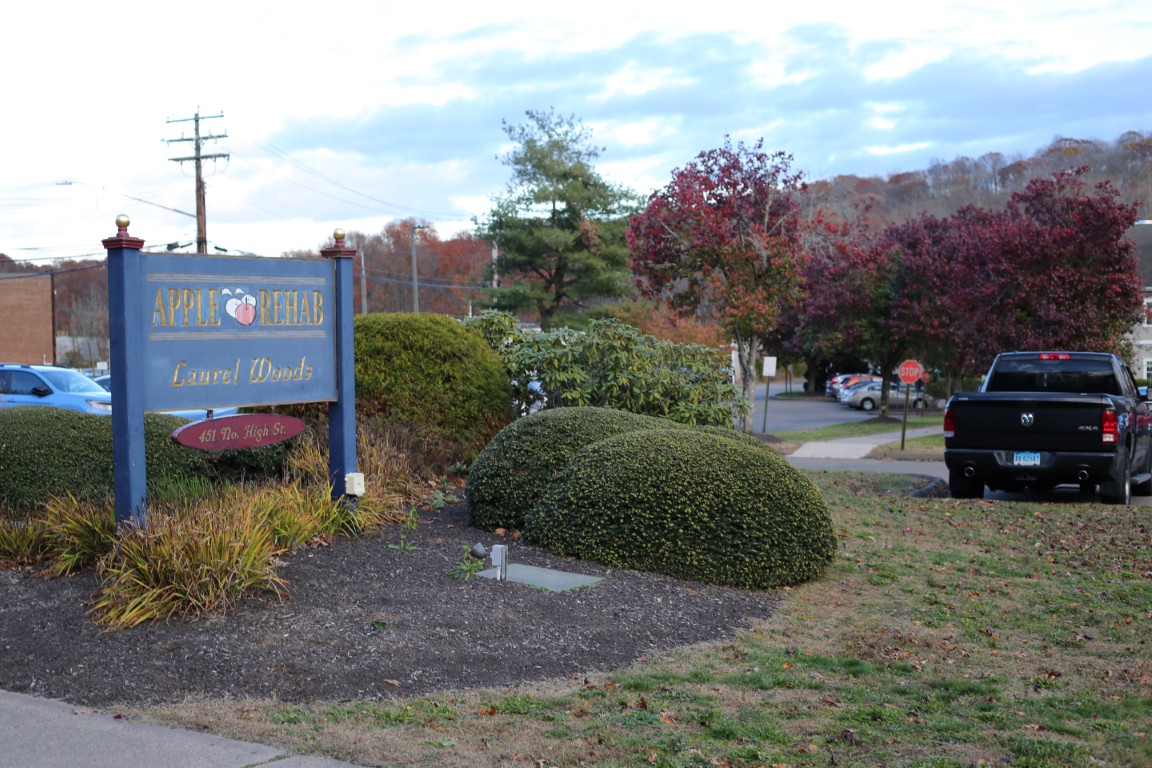
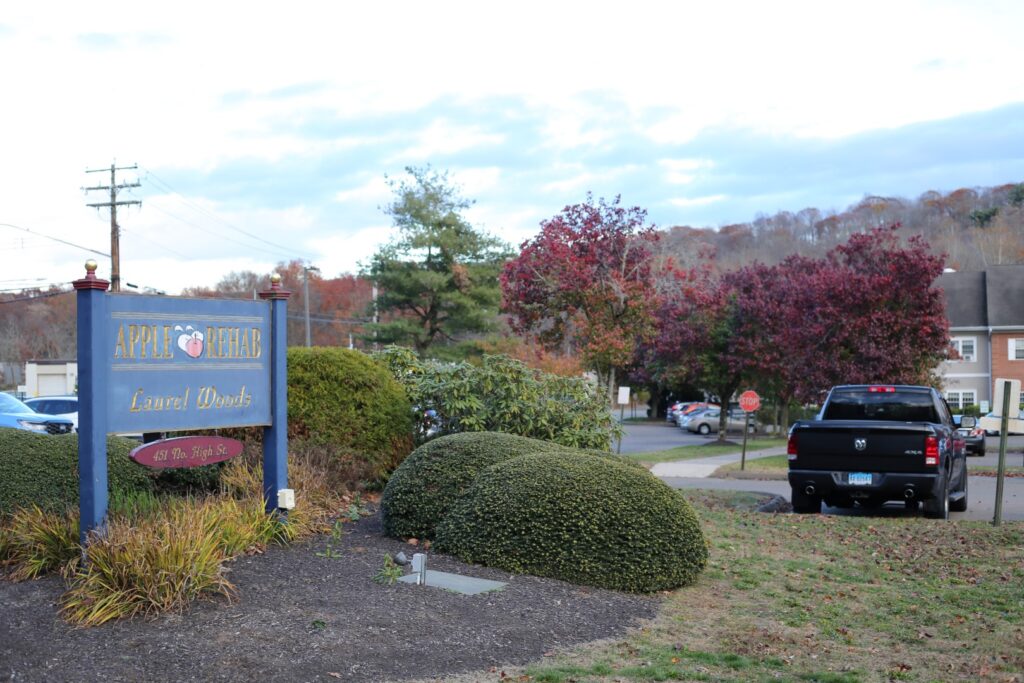
Apple Rehab Laurel Woods is a top-rated nursing home in East Haven, CT, that offers long-term care and short-term rehabilitation. As a family-owned and operated community, the nursing home fosters a home-like environment to ensure older adults are well-cared for. Respite care, pain management, and stroke recovery are among the high-quality services provided to meet residents’ healthcare needs. The community also features an in-house therapy to meet residents’ special needs and preferences, ensuring they recover with ease.

Therapeutic recreation, mind-stimulating activities, and light exercises are provided to enhance residents’ cognition and maintain their social connections. The community also maintains cleanliness and provides state-of-the-art amenities for residents’ wellness. Residents will surely have a convenient and laid-back lifestyle with local amenities, including the East Haven Police Department, nearby. As one of the finest options for senior care in Connecticut, this nursing home continuously provides outstanding care to help older adults live to their potential.

Quality ratings

Measured by Centers for Medicare & Medicaid Services (CMS)

Overall rating Info Official CMS rating based on health inspections, staffing and quality measures.
1/5
Connecticut average: 3.4/5
Health Inspection Info Official CMS rating based on deficiencies found during state health inspections.
1/5
Connecticut average: 3.1/5
Staffing Info Official CMS rating based on nurse staffing hours per resident per day.
3/5
Connecticut average: 3.4/5
Quality Measures Info Official CMS rating based on clinical outcomes for residents.
3/5
Connecticut average: 3.6/5

Nursing care per resident

Info Average daily nursing hours per resident (adjusted for acuity). Higher values indicate more nursing time per resident.
3h 46m per day

This home provides 7% less nursing time per resident than the Connecticut average.

Connecticut average: 4h 4m per day

Staffing hours breakdown

Info Hours of care per resident per day, broken down by staff type. Data from CMS Medicare.
Staff type Facility State avg National avg
Registered Nurse (RN) Info Registered nurse hours per resident per day. 13m per day 28m per day 29m per day

Capacity and availability

Medium-capacity home

Offers a balance of services and community atmosphere.

Total beds 120

This home is often near full

That suggests steady demand, but availability may be limited.

Higher demand than most homes in Connecticut
Occupancy rate 95%
Residents per day (avg) 109
Occupancy rate
95%
Residents per day (avg)
109

Who this home usually serves

TYPE OF STAY

Mix of rehab and long-term care

This home supports both short-term rehab and long-term care, with residents staying for a wide range of durations.

Breakdown by payment type

Medicare

16% of new residents, usually for short-term rehab.

Typical stay 19 days

Private pay

54% of new residents, often for short stays.

Typical stay 26 days

Medicaid

30% of new residents, often for long-term daily care.

Typical stay 6 - 7 months

Finances and operations

Privately-owned community
Operated by a business corporation.
Home revenue
$15.6M
Profit
$202.7K
Privately-owned community Operated by a business corporation.
Home revenue
$15,589,099.00
Profit
$202,657.00
Payroll costs Info The portion of the home's budget spent on staff, including nurses, caregivers, and other employees who support care and operations.
$7.3M
47% of revenue
Other operating costs Info All remaining costs needed to run the home, such as food, utilities, building maintenance, supplies and administrative expenses.
$8.1M
Total costs $15.4M
Years in operation
16 years in operation
A community with a solid operating history and experience delivering ongoing care.
Walk Score
Walk Score: 10 / 100
Car-dependent. Most errands require a car, with limited nearby walkable options.

Services

Cardiac; Orthopedic And Stroke
Hospice
Intergenerational Recreation
Iv Therapy
Pain Management
Peritoneal Dialysis
Recreation
Rehabilitation Therapy

About this community

Occupancy

Occupancy rate
95%
In line with Connecticut average
Occupied beds
114 / 120
Average residents 102 per day

License details

Facility type
Chronic & Convalescent Nursing Home
Status Active
Issuance December 1, 2009
Expiration December 31, 2026

Additional licensing details

License number: 2350

Room costs

Private Room (12 rooms) $525 per day
Semi-Private Room (54 rooms) $475 per day

Staffing

Key information about the people who lead and staff this community.

Languages Spoken

French Spanish

Staff Composition (State Data)

Admin
3 FTE
Registered Nurse
6 FTE
Licensed Practical Nurse
24 FTE
Nursing Assistant
54 FTE
Recreation
4 FTE
Social Services
2 FTE
Food Service Supervisor
18 FTE
Physical Therapy
11 FTE
Occupational Therapy
9 FTE
Speech Therapy
2 FTE
Dietary
15 FTE
Other Staff
6 FTE

Additional Policies & Features

Religious Services: All Denominations

What does this home offer?

Building type icon
Building type icon

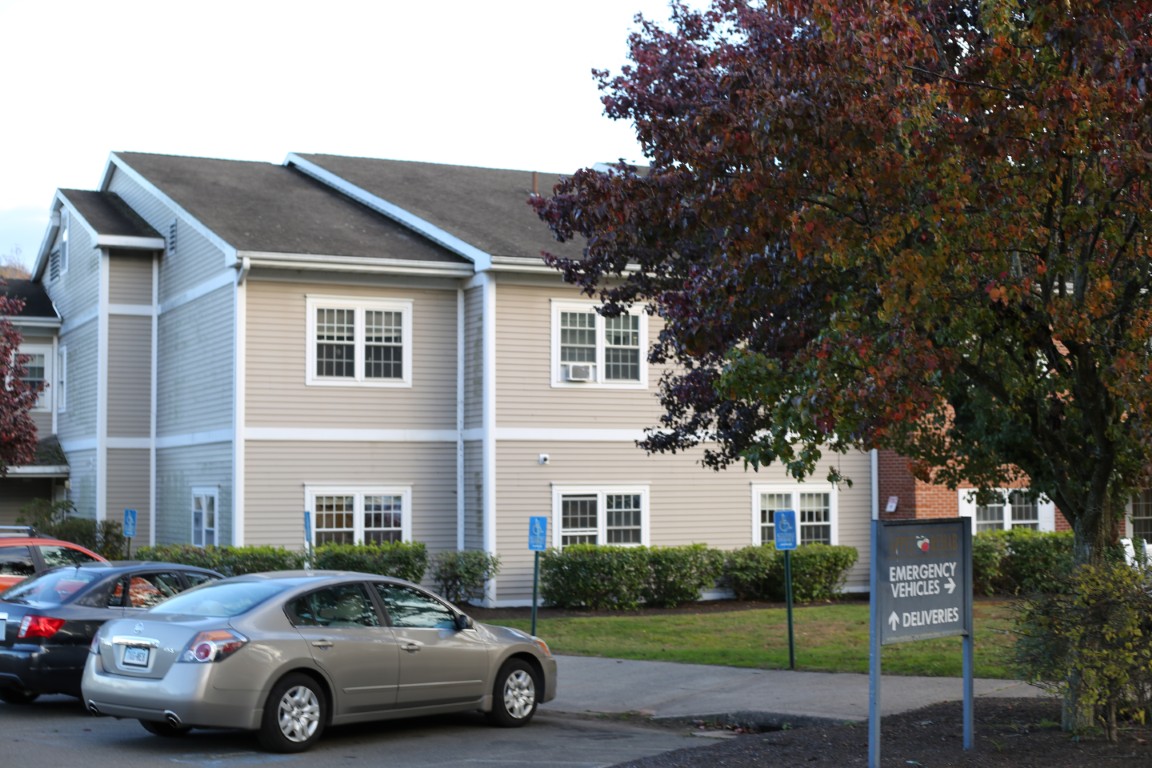
Building Type: 2-story

Dining services icon

Dining Services

Beauty services icon

Beauty Services

Rehabilitative support icon

Rehabilitative Support

Social and recreational activities icon

Social and Recreational Activities

On-site medical care and health services icon

On-site Medical Care and Health Services

Types of Care at Apple Rehab Laurel Woods

Nursing Home
Contact Apple Rehab Laurel Woods

Inspection History

In Connecticut, the Department of Public Health, Facility Licensing and Investigations Section conducts mandatory inspections and unannounced surveys to monitor the quality of care in long-term facilities.

18 visits/inspections

18 routine inspections

Breakdown by inspection type
  • 12 plans of correction
  • 1 statement of deficiencies

Results

13 with issues

0 without issues

Connecticut average: 13 visits/inspections

Latest inspection

Date:August 15, 2025

Inspection history

01-18-2024 Inspection Report
01-25-2019 Plan of Correction
03-08-2023 Plan of Correction
03-13-2020 Plan of Correction
03-18-2020 Plan of Correction
03-18-2024 Inspection Report
03-26-2025 Inspection Report
03-26-2025 Plan of Correction
04-04-2023 Plan of Correction
04-11-2025 Inspection Report
04-22-2024 Inspection Report
04-30-2025 Inspection Report
05-20-2022 Plan of Correction
05-20-2022 Statement of Deficiencies
06-22-2022 Inspection Report
07-10-2023 Inspection Report
07-18-2022 Plan of Correction
08-15-2025 Inspection Report
08-17-2023 Inspection Report
09-04-2024 Inspection Report
09-29-2023 Inspection Report
09-29-2023 Plan of Correction
10-20-2022 Inspection Report
11-04-2024 Inspection Report
11-04-2024 Plan of Correction
12-08-2023 Inspection Report
12-13-2023 Inspection Report

55 deficiencies

Deficiencies indicate regulatory issues. A higher number implies the facility had several areas requiring improvement.

Inspection Report Summary for Apple Rehab Laurel Woods

The most recent inspection on August 15, 2025, found no deficiencies during a complaint investigation. Earlier inspections showed a pattern of substantiated violations related to resident supervision, abuse prevention, and timely reporting of incidents, including verbal abuse and inadequate supervision of residents at risk for elopement or choking. Complaint investigations frequently identified issues with staff-to-resident interactions, failure to follow care plans, and documentation deficiencies. Enforcement actions such as staff termination occurred in response to substantiated abuse, but fines or license suspensions were not listed in the available reports. The facility’s record shows some improvement with recent inspections finding no deficiencies after prior issues were addressed through plans of correction.

Health Inspection History

Inspections
Total health inspections 10

Connecticut average 5.7


Last Health inspection on Apr 2025

Total health citations 36
Citations per inspection
3.6

Health citations are formal notices following inspections when they fail to comply with safety and care standards.

24 of 36 citations resulted from standard inspections; and 12 of 36 resulted from complaint investigations.

Breakdown of citation severity (last 3 years)
Critical Health citations More info 1
233% worse than Connecticut average

Connecticut average: 0.3


Serious Health citations More info 2
186% worse than Connecticut average

Connecticut average: 0.7

1 critical citation More info Connecticut average: 0.3

2 serious citations More info Connecticut average: 0.7

30 moderate citations More info Connecticut average: 28.8

3 minor citations More info Connecticut average: 2.3
Citations history (last 3 years)
Abuse/Neglect moderate citation Apr 11, 2025
Corrected

Abuse/Neglect moderate citation Apr 11, 2025
Corrected

Care Planning moderate citation Apr 11, 2025
Corrected

Abuse/Neglect moderate citation Mar 26, 2025
Corrected

Compare Memory Care around East Haven

The information below is reported by the Connecticut Department of Public Health, Facility Licensing and Investigations Section.
Apple Rehab Laurel Woods
SNF

Nursing Homes 24/7 care needed

East Haven
120
No
10

Places of interest near Apple Rehab Laurel Woods

Address 1.1 miles from city center

Address 451 N High St, East Haven, CT 06512

Calculate Travel Distance to Apple Rehab Laurel Woods

Add your location

Address

Staffing Data

Source: CMS Payroll-Based Journal (Q2 2025)

160
Total Staff
156
Employees
4
Contractors
41,032
Total Hours (Quarter)
62
Avg Staff/Day
7.3
Avg Shift (hrs)
Nursing Staff Breakdown
Role Count Avg Shift (hrs) Uses Contractors?
Registered Nurse158.5 No
Licensed Practical Nurse377.1 No
Certified Nursing Assistant627.6 No
Staff by Category
Administration
3 staff
6.3hs shift avg
Nursing Staff
118 staff
7.5hs shift avg
Physicians & Practitioners
4 staff
7.1hs shift avg
Therapy Services
19 staff
5.8hs shift avg
Activities & Recreation
0 staff
0hs shift avg
Social Services
7 staff
6.6hs shift avg
Dietary Services
6 staff
7.3hs shift avg
Other Services
3 staff
7.3hs shift avg
Contractor Analysis
1.1%
of total hours from contractors
434 contractor hours this quarter
Administrator: 2 Medical Director: 1 Occupational Therapy Assistant: 1
Role Employees Contractors Total Staff Total Hours Days Worked % of Days Avg Shift (hrs)
Certified Nursing Assistant6206220,33491100%7.6
Licensed Practical Nurse3703710,46691100%7.1
Registered Nurse150152,19591100%8.5
Clinical Nurse Specialist3031,2006875%6.9
Respiratory Therapy Technician5059487582%6.7
Physical Therapy Assistant6069028695%6.7
Mental Health Service Worker3037716167%7.3
Other Social Services Staff2027098391%7.4
Other Dietary Services Staff6066156167%7.3
Physical Therapy Aide4045606774%5.1
RN Director of Nursing3034926066%7.7
Nurse Practitioner1014806268%7.7
Qualified Social Worker5054526673%5.7
Administrator0223895459%7.2
Speech Language Pathologist2023576066%5.8
Nurse Aide in Training10165910%7.2
Occupational Therapy Aide101541112%4.9
Occupational Therapy Assistant011253235%0.8
Medical Director011211112%1.9

Facility Characteristics

Source: CMS Long-Term Care Facility Characteristics (Data as of Jan 2026)

Total census
110 residents
Residents by payment source
Medicare
4 residents (3.6%)
Medicaid
81 residents (73.6%)
Private pay or other
25 residents (22.7%)
Programs & Services
Residents' Group

Residents meet regularly to discuss policies, care quality, and activities

Active Resident Council

Organized group of residents that meets regularly to discuss facility policies, quality of life, and activities.

Quality of care over time

These measures show how residents usually do over time at this home, based on health outcomes and preventive care.

High-risk clinical events score Info A composite score based on pressure ulcers, falls with injury, weight loss, walking ability decline, and activities of daily living decline. 14.2
36% worse than Connecticut average

Connecticut average: 10.4

Functional decline score Info A composite score based on activities of daily living decline, walking ability decline, and incontinence. 27.2
29% worse than Connecticut average

Connecticut average: 21.1

Long-stay resident measures
Average Connecticut avg: 3.2 Info CMS star rating based on long-stay quality measure performance. 5 stars = significantly above average, 1 star = significantly below average.
Need for Help with Daily Activities Increased Info Percent of long-stay residents whose need for help with daily activities has increased 24.9%
32% worse than Connecticut average

Connecticut average: 18.9%

Walking Ability Worsened Info Percent of long-stay residents whose ability to move independently worsened 32.7%
71% worse than Connecticut average

Connecticut average: 19.2%

Low Risk Residents with Bowel/Bladder Incontinence Info Percent of low risk long-stay residents who lose control of their bowels or bladder 23.9%
In line with Connecticut average

Connecticut average: 24.9%

Falls with Major Injury Info Percent of long-stay residents experiencing one or more falls with major injury 4.1%
19% worse than Connecticut average

Connecticut average: 3.5%

High Risk Residents with Pressure Ulcers Info Percent of long-stay high risk residents with pressure ulcers 1.6%
66% better than Connecticut average

Connecticut average: 4.6%

Urinary Tract Infection Info Percent of long-stay residents with a urinary tract infection 3.1%
83% worse than Connecticut average

Connecticut average: 1.7%

Lost Too Much Weight Info Percent of long-stay residents who lose too much weight 7.5%
20% worse than Connecticut average

Connecticut average: 6.3%

Depressive Symptoms Info Percent of long-stay residents who have depressive symptoms 4.0%
73% better than Connecticut average

Connecticut average: 15.2%

Antipsychotic Use Info Percent of long-stay residents who received an antipsychotic medication 19.6%
14% worse than Connecticut average

Connecticut average: 17.2%

Pneumococcal Vaccine Info Percent of long-stay residents assessed and appropriately given the pneumococcal vaccine 94.4%
8% better than Connecticut average

Connecticut average: 87.5%

Influenza Vaccine Info Percent of long-stay residents assessed and appropriately given the seasonal influenza vaccine 99.1%
6% better than Connecticut average

Connecticut average: 93.5%

Short-stay resident measures
Significantly above average Connecticut avg: 3.3 Info CMS star rating based on short-stay quality measure performance. 5 stars = much above average, 1 star = much below average.
Pneumococcal Vaccine Info Percent of short-stay residents assessed and appropriately given the pneumococcal vaccine 58.8%
16% worse than Connecticut average

Connecticut average: 70.1%

Antipsychotic medication increase Info Percent of short-stay residents who newly received an antipsychotic medication 1.1%
30% better than Connecticut average

Connecticut average: 1.5%

Influenza Vaccine Info Percent of short-stay residents assessed and appropriately given the seasonal influenza vaccine 61.9%
11% worse than Connecticut average

Connecticut average: 69.8%

Re-hospitalized after SNF stay Info Percentage of short-stay residents who were re-hospitalized after their nursing home admission. 38.3%
53% worse than Connecticut average

Connecticut average: 25.0%

Emergency department visits Info Percentage of short-stay residents who had an outpatient emergency department visit. 2.7%
76% better than Connecticut average

Connecticut average: 11.1%

Falls with major injury Info Percentage of SNF residents who experience falls with major injury during their stay. 1.9%
145% worse than Connecticut average

Connecticut average: 0.8%

Ability to care for self at discharge Info Percentage of residents at or above expected ability to care for themselves at discharge. 52.0%
In line with Connecticut average

Connecticut average: 53.7%

Successful return to home or community Info Rate of successful return to home or community from a skilled nursing facility. 73.6%
46% better than Connecticut average

Connecticut average: 50.6%

Penalties and fines

Federal penalties imposed by CMS for regulatory violations, including civil money penalties (fines) and denials of payment for new Medicare/Medicaid admissions.

Source: CMS Penalties Database (Data as of Jan 2026)

Total fines amount $82K
88% higher than Connecticut average

Connecticut average: $44K

Number of fines 3
72% more fines than Connecticut average

Connecticut average: 1.7

Payment Denials Info Serious action where Medicare and/or Medicaid temporarily stops payments for new residents until issues are fixed. 0
100% fewer payment denials than Connecticut average

Connecticut average: 0.1

Fines amount comparison
This facility $82K
Connecticut average $44K
Penalty History

Penalties are imposed by CMS for violations of federal nursing home regulations.

Civil Money Penalty Info Fines imposed for noncompliance, which can be assessed per day or per instance of violation. May 31, 2024
$8K
Civil Money Penalty Info Fines imposed for noncompliance, which can be assessed per day or per instance of violation. Mar 14, 2024
$57K
Civil Money Penalty Info Fines imposed for noncompliance, which can be assessed per day or per instance of violation. Apr 4, 2023
$17K

Last updated: Jan 2026

Guides for Better Senior Living

Care Cost Calculator: See Prices in Your Area

Nursing Home Data Explorer

Don’t Wait Too Long: 7 Red Flag Signs Your Parent Needs Assisted Living Now

The True Cost of Assisted Living in 2025 – And How Families Are Paying For It

Understanding Senior Living Costs: Pricing Models, Discounts & Financial Assistance

Financial Aid for Connecticut Seniors

Get financial aid guidance

Connecticut Home Care Program for Elders

CHCPE

Age 65+, Connecticut resident, at risk of nursing home placement.

State-funded: ~$1,600/month; Medicaid: ~$2,829/month (300% FBR).

$1,600 (state), $2,000 (Medicaid, individual).

Two tiers (state and Medicaid); waitlists possible.

Statewide Respite Care Program

CT Respite Care

Caregiver of senior with dementia, Connecticut resident.

~$2,500/month (individual, varies).

$40,000 (individual).

Limited to dementia caregivers; capped funding.

Congregate Housing Services Program (CHSP)

Connecticut Congregate Housing Services Program

Age 62+, Connecticut resident, frail but not needing 24/7 care, resides in CHSP-eligible housing.

~$41,000/year (individual, adjusted annually).

Not specified; focus is income-based.

Limited to 14 state-subsidized sites; participants pay 10% of service costs.

Medicare Savings Program (MSP)

Connecticut Medicare Savings Program

Age 65+ or disabled, Connecticut resident, enrolled in Medicare Part A/B.

~$2,510/month (individual, QMB); ~$3,380/month (SLMB); ~$3,598/month (ALMB)—adjusted annually.

None since 2023 policy change.

Three tiers (Qualified Medicare Beneficiary, Specified Low-Income, Additional Low-Income); no asset test.

Senior Community Service Employment Program (SCSEP)

Connecticut SCSEP (federally funded, state-administered)

Age 55+, unemployed, low-income, Connecticut resident.

~$1,983/month (125% FPL, individual).

Not specified; income-focused.

Priority for veterans, rural residents; limited slots (~500/year).

Tour Icon
Planning a tour? Check our touring checklist.
Chat Icon
Thinking of living here? We can help you speak to a current resident