Explore Open Rooms
1 Contact details
2 What type of senior care service are you looking for?
3 What budget do you have in mind for senior care?
4 How soon do you need to find care?
5 Additional details

Thank you for your interest!

Our team will be in touch shortly to help with next steps.

Nursing Home in Greensburg

CMS overall rating Info The Overall CMS Rating combines results from health inspections, staffing levels and quality measures. Health inspections carry the most weight. Staffing and quality scores can increase or decrease the final rating based on performance compared to state and national standards.

Arbor Grove Village

Overview of Arbor Grove Village

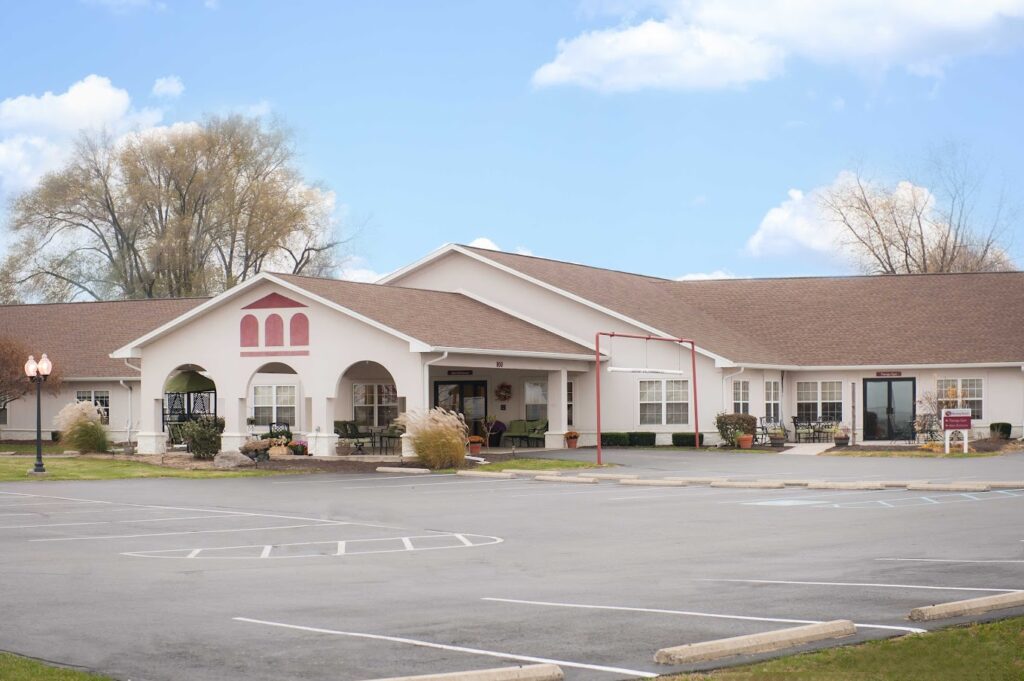
Set in Greensburg, IN, Arbor Grove Village is a leading senior care provider that caters to those looking for rehabilitation, memory care, skilled nursing, long-term care, respite or hospice care services. The community features a reliable team of clinicians who are trained to offer an array of services while maintaining residents’ dignity and autonomy, making sure they are comfortable while receiving the care and support they need. Dedicated to helping residents achieve their optimal functionality, the community offers access to physical, speech, and occupational therapy services.

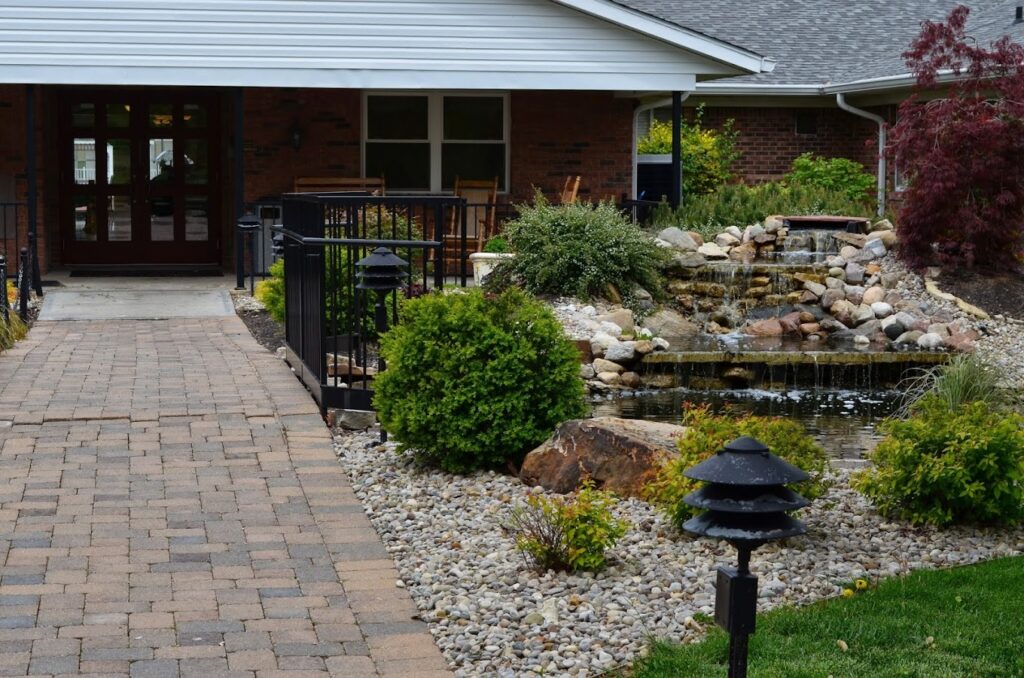
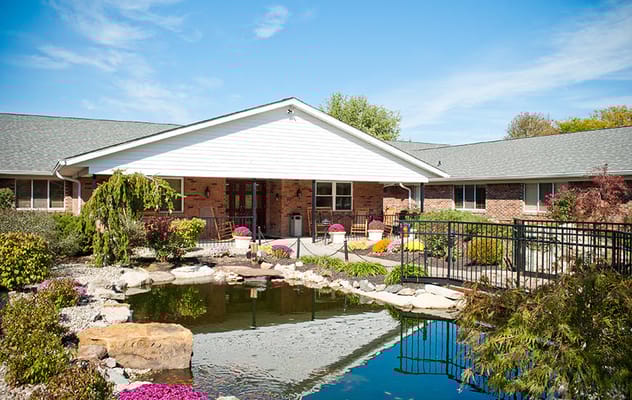
The community designed their accommodations to cater to residents’ unique safety, mobility, and care needs, making sure they are able to easily navigate their living spaces. With access to therapy, medically integrated programs, and holistic wellness services, residents here are bound to enjoy a speedy recovery from their conditions and return home safely with the skills they need to continue living their lives according to their own terms.

(812) 663-8553

Quality ratings

Measured by Centers for Medicare & Medicaid Services (CMS)

Overall rating Info The Overall CMS Rating combines results from health inspections, staffing levels and quality measures. Health inspections carry the most weight. Staffing and quality scores can increase or decrease the final rating based on performance compared to state and national standards.
2/5
Indiana average: 3.0/5
Health Inspection Info Based on the results of the facility's three most recent standard inspections and any complaint investigations. CMS reviews the number, scope, and severity of deficiencies, with more recent findings weighted more heavily.
3/5
Indiana average: 2.7/5
Staffing Info Measures average nursing staff hours per resident per day, including Registered Nurses (RNs) and total nursing staff. Ratings are adjusted based on the level of care residents require and are compared to state and national benchmarks.
1/5
Indiana average: 2.6/5
Quality Measures Info Based on clinical and physical health indicators reported to CMS, such as hospital readmissions, falls, pressure ulcers, and improvements in mobility. These measures reflect how well residents' health needs are being managed.
3/5
Indiana average: 4.1/5

Nursing care per resident

Info This shows how many total hours of nursing staff time are available per resident each day. Higher numbers usually mean more staff support.
3h 14m per day

This home provides 9% less nursing time per resident than the Indiana average.

Indiana average: 3h 32m per day

Capacity and availability

Smaller home

May offer a more intimate, personalized care environment.

Total beds 83

This home usually has limited availability

Occupancy is moderate, suggesting balanced demand.

Similar demand to the Indiana average
Occupancy rate 90.4%
Residents per day (avg) 75
Occupancy rate
90.4%
Residents per day (avg)
75

Who this home usually serves

TYPE OF STAY

Mostly long-term care residents

Most residents stay for extended periods and receive ongoing daily care.

Might be optimal for
Long-term daily care Ongoing support needs

Breakdown by payment type

Medicare

28% of new residents, usually for short-term rehab.

Typical stay 22 days

Private pay

38% of new residents, often for short stays.

Typical stay 3 - 4 months

Medicaid

33% of new residents, often for long-term daily care.

Typical stay 1 - 2 years

Finances and operations

Governmental community
Home revenue
$8.9M
Surplus of revenue
$1.3M
Governmental community
Home revenue
$8.9M
Surplus of revenue
$1.3M
Payroll costs Info The portion of the home's budget spent on staff, including nurses, caregivers, and other employees who support care and operations.
$4.4M
49.4% of revenue
Other operating costs Info All remaining costs needed to run the home, such as food, utilities, building maintenance, supplies and administrative expenses.
$3.2M
Total costs $7.6M
Bed community size
83-bed community
A larger shared setting that may offer more common spaces and organized community services.
Years in operation
1 year in operation
A newer community that may feature more recent facilities and programs.
Walk Score
Walk Score: 10 / 100
Car-dependent. Most errands require a car, with limited nearby walkable options.

About this community

Occupancy

Occupancy rate
90%
33% higher than Indiana average

Indiana average: 68%

Occupied beds
75 / 83
Average residents 70 per day

License Details

Facility TypeNursing Home (skilled Nursing Facility)
StatusActive
IssuanceJanuary 7, 2025
ExpirationJune 30, 2026

Additional Licensing Details

License Number25-000305-1
CMS Certification Number155625

Ownership & Operating Entity

Arbor Grove Village is legally operated by Health And Hospital Corporation Of Marion County, and administrated by Debra Mckinley.

Profit StatusOTHER

Type Of Units

SNF/NF (Combined)
83 units
Total beds
83 units

Staffing

Key information about the people who lead and staff this community.

Leadership

Medical DirectorArthur Alunday
Director of NursingCHRISTINA BANKS

Contact Information

Fax(812) 663-6980

What does this home offer?

Accepts Medicaid icon

Accept Medicaid: Yes

Total residents icon

Total Residents: 83

Building type icon
Building type icon

Building Type: Single-story

Types of Care at Arbor Grove Village

Memory Care Nursing Home Respite Care Hospice Care

Contact Arbor Grove Village

Inspection History

In Indiana, the Department of Health, Division of Long Term Care is the primary regulatory body that performs onsite inspections and quality of care reviews for all licensed facilities.

Inspection Overview

21 total visits · Indiana avg: 19

Ranked 225th of 388 in Indiana

9 Inspections Indiana avg: 13 31% below Indiana avg
9 Complaint Visits Indiana avg: 8 13% above Indiana avg Ranked 239th of 367 3 formal complaints filed · avg: 5 Formal complaints can result in multiple visits
9 Visits with Citations Indiana avg: 7 29% above Indiana avg
41 Citations Total Indiana avg: 34 21% above Indiana avg Ranked 258th of 385
12 Visits without Citations Indiana avg: 12 0% below Indiana avg

3 complaints

Formal expressions of dissatisfaction or concern made by residents, or their families regarding various aspects of the care, services, and environment provided.

Indiana average: 5 complaints

Latest inspection

Date June 19, 2025
Annual Inspection

41 total citations

Citations indicate regulatory violations. A higher number implies the facility had several areas requiring improvement.

Indiana average: 34 citations

39 deficiencies

Deficiencies indicate regulatory issues. A higher number implies the facility had several areas requiring improvement.

Indiana average: 36 deficiencies

Inspection Report Summary for Arbor Grove Village

The most recent inspection on June 19, 2025, found Arbor Grove Village to be in compliance with applicable federal and state regulations and cited no deficiencies. Earlier inspections showed a pattern of Life Safety Code deficiencies related to fire safety issues such as doors failing to close and latch properly, sprinkler system concerns, and smoking policy enforcement, as well as care-related deficiencies including medication management and resident care plan implementation. Complaint investigations were mostly unsubstantiated except for one in June 2023 where inspectors cited a deficiency for failure to implement a person-centered dementia care plan. No fines, immediate jeopardy findings, or license actions were listed in the available reports. The facility appears to have addressed prior deficiencies over time, with recent inspections showing improvement and compliance.

Health Inspection History

Inspections
Total health inspections 5

Indiana average 6


Last Health inspection on Jul 2025

Total health citations 16

Indiana average 25

Citations per inspection
3.2

Indiana average 4.12


Health citations are formal notices following inspections when they fail to comply with safety and care standards.

14 of 16 citations resulted from standard inspections; and 2 of 16 resulted from complaint investigations.

Breakdown of citation severity (last 3 years)
Critical Health citations More info 0
100% better than Indiana average

Indiana average: 0.2


Serious Health citations More info 2
233% worse than Indiana average

Indiana average: 0.6

0 critical citations More info Indiana average: 0.2

2 serious citations More info Indiana average: 0.6

14 moderate citations More info Indiana average: 23.8

0 minor citations More info Indiana average: 0.4
Citations history (last 3 years)
Abuse/Neglect moderate citation Info Issues related to protecting resident's from harm, including abuse, neglect, or mistreatment. Jul 18, 2025
Corrected

Nutrition moderate citation Info Issues related to food quality, meal service, and resident's nutritional needs. Apr 28, 2025
Corrected

Pharmacy moderate citation Info Issues related to medication management, including how drugs are stored, administered, and monitored. Apr 28, 2025
Corrected

Pharmacy moderate citation Info Issues related to medication management, including how drugs are stored, administered, and monitored. Apr 28, 2025
Corrected

Compare Nursing Homes around Greensburg The information below is reported by the Indiana Department of Health, Division of Long Term Care.

2 facilities compared · CMS & IN Dept. of Health data · Updated Apr 2026

Filter by care type
Morning Breeze Retirement Community & Healthcare Center
AL

Assisted Living A licensed, long-term care setting for seniors or individuals with disabilities who need help with daily activities — like bathing, dressing, and medication management — but not 24-hour skilled nursing. Offers housing, meals, and around-the-clock support while aiming to maximize resident independence.

IL

Independent Living Lifestyle-focused communities for older adults offering dining, activities, and transportation with minimal personal care. Best for active, independent seniors who want community without medical support.

MC

Memory Care Secured, specialized care for people living with Alzheimer's or dementia. Staff trained in cognitive impairment, with higher staff-to-resident ratios and an environment designed to reduce confusion and wandering risk.

NH

Nursing Home Licensed facility providing 24/7 skilled nursing care for residents with complex, ongoing medical needs. Staffed by RNs, LPNs, and CNAs. Inspected and star-rated annually by CMS. Accepts Medicare (short-term rehab) and Medicaid (long-term care).

Greensburg
86
75.6%
+9%
3.36
+18%
-2%
0
13
3.3
0
55
A-
50
Cole, Holly
$8.4M
$3.3M
39.2%
155675
Arbor Grove Village
HC

Home Care Professional care delivered in the person's own home — from companionship and errands to skilled nursing and therapy. Allows seniors to age in place. Medicare covers skilled home health when medically necessary.

MC

Memory Care Secured, specialized care for people living with Alzheimer's or dementia. Staff trained in cognitive impairment, with higher staff-to-resident ratios and an environment designed to reduce confusion and wandering risk.

NH

Nursing Home Licensed facility providing 24/7 skilled nursing care for residents with complex, ongoing medical needs. Staffed by RNs, LPNs, and CNAs. Inspected and star-rated annually by CMS. Accepts Medicare (short-term rehab) and Medicaid (long-term care).

RC

Respite Care Short-term temporary care — days to weeks — to give family caregivers a break. Full care provided during the stay. Often used after hospitalization or to trial a facility before a permanent placement decision.

Greensburg
83
78.3%
+13%
3.23
-16%
-6%
0
16
3.2
2
75
-
10
Bowling, Kimberly
$7.6M
$4.4M
58.2%
155625

Places of interest near Arbor Grove Village

Address 1.0 miles from city center

Calculate Travel Distance to Arbor Grove Village

Add your location

Address

Staffing Data (Q2 2025)

This data corresponds to Q2 2025 and is based on CMS Payroll-Based Journal.

Total staff 137
Employees 130
Contractors 7
Staff to resident ratio 1.78:1
1779121% better than Indiana average

Indiana average ratio: 0.00:1

Avg staff/day 45
Average shift 7.5 hours
0% compared with Indiana average

Indiana average: 7.7 hours

Total staff hours (quarter) 30,826
Nursing staff breakdown
Registered Nurse

Manages medical care and health needs.

Total count 11
Average shift length Info Average shift length. Calculated as total hours divided by days worked and average staff per day. 8.1 hours

No contractors work on this role.

Licensed Practical Nurse

Assists with medical care and medications.

Total count 13
Average shift length Info Average shift length. Calculated as total hours divided by days worked and average staff per day. 9.1 hours

No contractors work on this role.

Certified Nursing Assistant

Helps with daily care and mobility.

Total count 45
Average shift length Info Average shift length. Calculated as total hours divided by days worked and average staff per day. 7.7 hours

No contractors work on this role.

Contractor staffing

Total hours from contractors

1.6%

499 contractor hours this quarter

Occupational Therapy Assistant: 5 Physical Therapy Assistant: 1 Medical Director: 1
Staff by category
Certified Nursing Assistant4504511,47891100%7.7
Medication Aide/Technician150154,53891100%7.9
Licensed Practical Nurse130133,66891100%9.1
Nurse Aide in Training110111,9839099%6.9
Other Dietary Services Staff100101,7958998%6.5
RN Director of Nursing3031,5727279%8.7
Registered Nurse110111,5048391%8.1
Nurse Practitioner4045966369%7.8
Clinical Nurse Specialist3035536571%8.3
Physical Therapy Assistant2135386369%7.1
Administrator1015126470%8
Mental Health Service Worker1014846167%7.9
Speech Language Pathologist3034056369%5.7
Respiratory Therapy Technician1013846369%6.1
Dietitian2023644954%7.4
Physical Therapy Aide2023385560%6
Occupational Therapy Aide2023578%5
Medical Director011302730%1.1
Occupational Therapy Assistant055302629%1
Qualified Social Worker1012255%4.4
45 Certified Nursing Assistant
% of Days 100%
15 Medication Aide/Technician
% of Days 100%
13 Licensed Practical Nurse
% of Days 100%
11 Nurse Aide in Training
% of Days 99%
10 Other Dietary Services Staff
% of Days 98%
3 RN Director of Nursing
% of Days 79%
11 Registered Nurse
% of Days 91%
4 Nurse Practitioner
% of Days 69%
3 Clinical Nurse Specialist
% of Days 71%
3 Physical Therapy Assistant
% of Days 69%
1 Administrator
% of Days 70%
1 Mental Health Service Worker
% of Days 67%
3 Speech Language Pathologist
% of Days 69%
1 Respiratory Therapy Technician
% of Days 69%
2 Dietitian
% of Days 54%
2 Physical Therapy Aide
% of Days 60%
2 Occupational Therapy Aide
% of Days 8%
1 Medical Director
% of Days 30%
5 Occupational Therapy Assistant
% of Days 29%
1 Qualified Social Worker
% of Days 5%

Facility Characteristics

Source: CMS Long-Term Care Facility Characteristics (Data as of Jan 2026)

Total census
77 residents
Residents by payment source
Medicare
4 residents (5.2%)
Medicaid
54 residents (70.1%)
Private pay or other
19 residents (24.7%)
Programs & Services
Residents' Group

Residents meet regularly to discuss policies, care quality, and activities

Nurse Aide Training

State-approved Nurse Aide Training and Competency Evaluation Program on-site

Active Resident Council

Organized group of residents that meets regularly to discuss facility policies, quality of life, and activities.

Quality of care over time

These measures show how residents usually do over time at this home, based on health outcomes and preventive care.

High-risk clinical events score Info A composite score based on pressure ulcers, falls with injury, weight loss, walking ability decline, and activities of daily living decline. 7.6
In line with Indiana average

Indiana average: 8.0

Functional decline score Info A composite score based on activities of daily living decline, walking ability decline, and incontinence. 12.8
25% better than Indiana average

Indiana average: 17.1

Long-stay resident measures
Need for Help with Daily Activities Increased Info Percent of long-stay residents whose need for help with daily activities has increased 9.5%
22% better than Indiana average

Indiana average: 12.0%

Walking Ability Worsened Info Percent of long-stay residents whose ability to move independently worsened 9.9%
31% better than Indiana average

Indiana average: 14.4%

Low Risk Residents with Bowel/Bladder Incontinence Info Percent of low risk long-stay residents who lose control of their bowels or bladder 19.0%
23% better than Indiana average

Indiana average: 24.6%

Falls with Major Injury Info Percent of long-stay residents experiencing one or more falls with major injury 5.0%
30% worse than Indiana average

Indiana average: 3.9%

High Risk Residents with Pressure Ulcers Info Percent of long-stay high risk residents with pressure ulcers 6.6%
51% worse than Indiana average

Indiana average: 4.4%

Urinary Tract Infection Info Percent of long-stay residents with a urinary tract infection 0.4%
70% better than Indiana average

Indiana average: 1.2%

Lost Too Much Weight Info Percent of long-stay residents who lose too much weight 7.1%
25% worse than Indiana average

Indiana average: 5.7%

Depressive Symptoms Info Percent of long-stay residents who have depressive symptoms 59.6%
147% worse than Indiana average

Indiana average: 24.1%

Antipsychotic Use Info Percent of long-stay residents who received an antipsychotic medication 13.9%
11% worse than Indiana average

Indiana average: 12.4%

Pneumococcal Vaccine Info Percent of long-stay residents assessed and appropriately given the pneumococcal vaccine 97.9%
In line with Indiana average

Indiana average: 93.7%

Influenza Vaccine Info Percent of long-stay residents assessed and appropriately given the seasonal influenza vaccine 100.0%
5% better than Indiana average

Indiana average: 95.4%

Short-stay resident measures
Pneumococcal Vaccine Info Percent of short-stay residents assessed and appropriately given the pneumococcal vaccine 99.5%
22% better than Indiana average

Indiana average: 81.7%

Antipsychotic medication increase Info Percent of short-stay residents who newly received an antipsychotic medication 0.0%
100% better than Indiana average

Indiana average: 1.4%

Influenza Vaccine Info Percent of short-stay residents assessed and appropriately given the seasonal influenza vaccine 98.2%
24% better than Indiana average

Indiana average: 79.0%

Guides for Better Senior Living

Care Cost Calculator: See Prices in Your Area

Nursing Home Data Explorer

Don’t Wait Too Long: 7 Red Flag Signs Your Parent Needs Assisted Living Now

The True Cost of Assisted Living in 2025 – And How Families Are Paying For It

Understanding Senior Living Costs: Pricing Models, Discounts & Financial Assistance

Financial Aid for Indiana Seniors

Get financial aid guidance

Aged and Disabled Waiver

Indiana Medicaid A&D Waiver

Age 65+ or disabled, Indiana resident, Medicaid-eligible, nursing home-level care need.

~$2,829/month (300% FBR, individual).

$2,000 (individual), $3,000 (couple).

Requires level-of-care determination.

CHOICE Program

Indiana CHOICE

Age 60+, Indiana resident, at risk of nursing home.

~$2,000/month (varies).

$10,000 (individual).

Limited funding; regional variation.

Residential Care Assistance Program (RCAP)

Indiana Residential Care Assistance Program

Age 65+, or blind, or disabled, Indiana resident, in approved facility, low-income or SSI recipient.

~$1,004/month (including SSI).

$2,000 (individual), $3,000 (couple).

~50 facilities statewide; per diem rate set by FSSA.

Medicare Savings Program (MSP)

Indiana Medicare Savings Program

Age 65+ or disabled, Indiana resident, Medicare Part A/B.

~$2,510/month (QMB), ~$3,380/month (SLMB), ~$3,598/month (QI)—individual.

$9,430 (individual), $14,130 (couple).

Three tiers; no waitlist.

National Family Caregiver Support Program (NFCSP) Respite

Indiana NFCSP Respite Care

Caregivers of 60+ needing care or 55+ caregivers of others; Indiana resident; functional needs (2+ ADLs).

Prioritizes ~$24,980/year (individual); no strict cap.

Not assessed; need-based.

16 AAAs; prioritizes low-income, rural caregivers.

Senior Community Service Employment Program (SCSEP)

Indiana SCSEP

Age 55+, unemployed, low-income, Indiana resident.

~$1,983/month (125% FPL).

Not specified; income-focused.

Priority for veterans, rural residents.

VA Aid and Attendance (A&A) and Housebound Benefits

Indiana VA Aid and Attendance/Housebound

Age 65+ or disabled veteran/spouse, Indiana resident, wartime service, need for ADL help (A&A) or homebound.

Net income < ~$1,984/month (veteran with dependent, A&A); pension offsets income.

~$155,356 (net worth limit).

High veteran demand statewide.

Tour Icon
Planning a tour? Check our touring checklist.
Chat Icon
Thinking of living here? We can help you speak to a current resident