Ark Healthcare and Rehab Branford Hills

Nursing Home

Ark Healthcare and Rehab Branford Hills

189 Alps Rd, Branford, CT 06405 View Map
Nursing Home
icon
Care Cost Calculator: See Prices in Your Area Care Cost Calculator: See Prices in Your Area icon
Overview of Ark Healthcare and Rehab Branford Hills

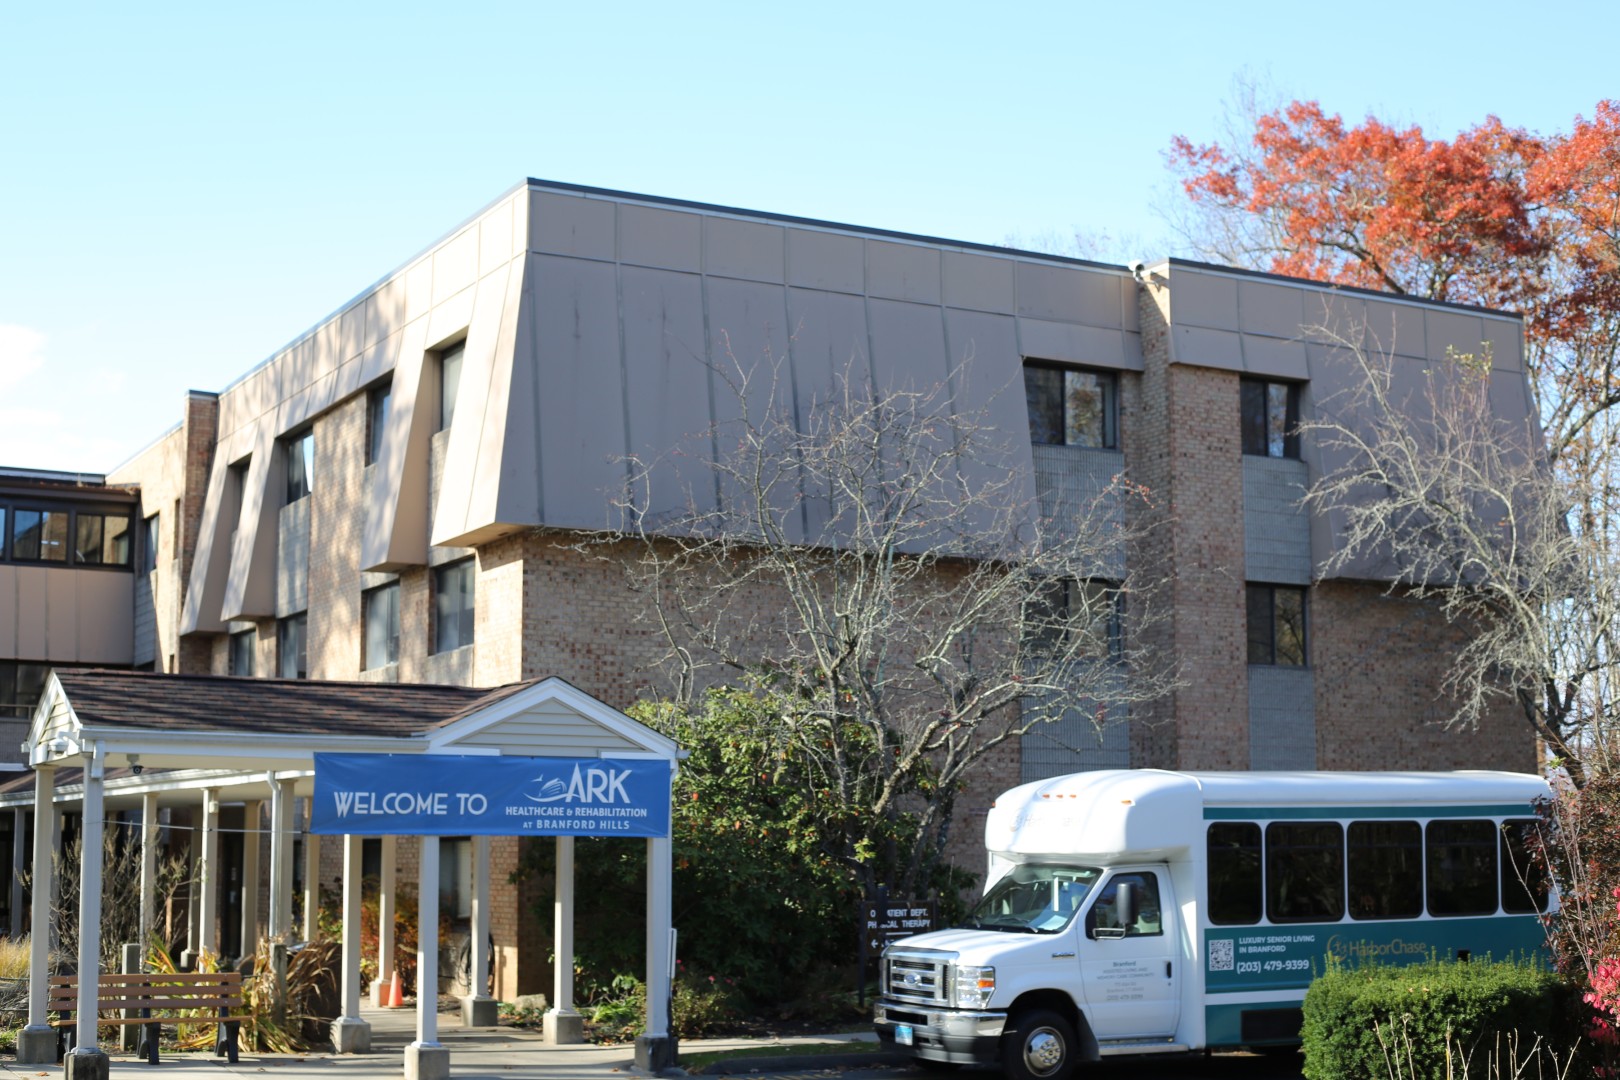
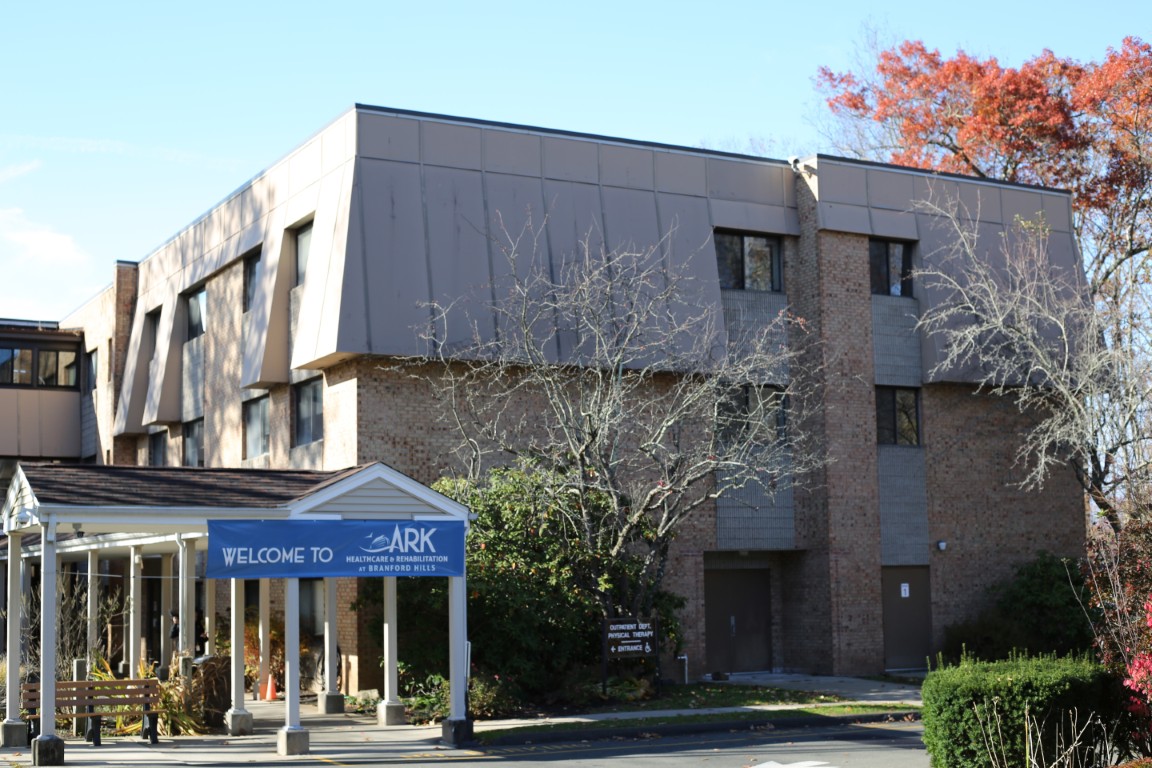
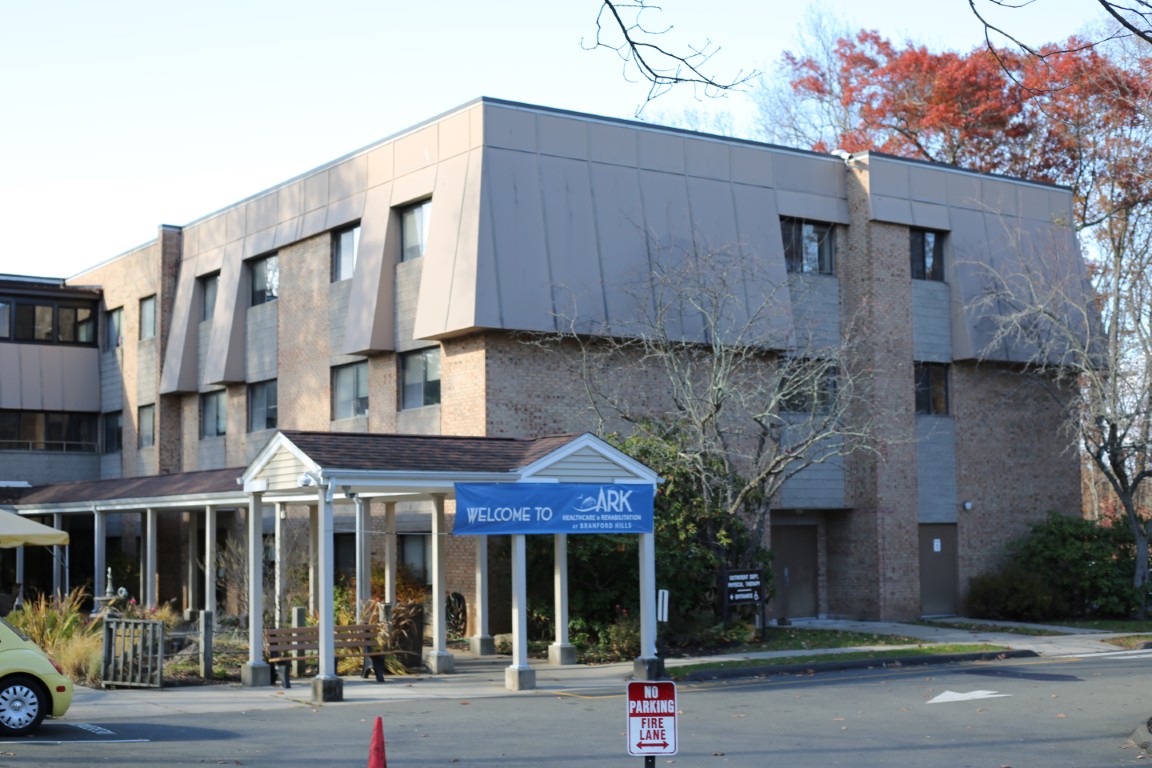
Ark Healthcare and Rehab Branford Hills is a top-rated nursing home in Branford, CT, that offers skilled nursing and rehabilitation. The community strives to provide older adults with a home away from home, ensuring they are cared for like family. An in-house pharmacy, caregiver respite, and therapeutic diet and nutrition are among the exceptional services provided to improve residents’ living experiences. With its personalized care, this 190-bed nursing home ensures older adults’ healthcare needs are met.

Recreational activities dedicated to enhancing residents’ holistic well-being are provided to ensure they can maintain an active lifestyle. Serene walking paths and beautifully landscaped outdoors also accompany residents, ensuring their relaxation and peace of mind. Set in the tree-lined residential area of Branford, the community ensures residents have a laid-back lifestyle. This nursing home is highly recognized in Connecticut, especially with its exceptional care and top-notch amenities.

Quality ratings

Measured by Centers for Medicare & Medicaid Services (CMS)

Overall rating Info Official CMS rating based on health inspections, staffing and quality measures.
3/5
Connecticut average: 3.0/5
Health Inspection Info Official CMS rating based on deficiencies found during state health inspections.
3/5
Connecticut average: 2.8/5
Staffing Info Official CMS rating based on nurse staffing hours per resident per day.
3/5
Connecticut average: 3.2/5
Quality Measures Info Official CMS rating based on clinical outcomes for residents.
3/5
Connecticut average: 3.5/5

Nursing care per resident

Info Average daily nursing hours per resident (adjusted for acuity). Higher values indicate more nursing time per resident.
3h 48m per day

This home provides 4% less nursing time per resident than the state average.

Connecticut average: 3h 58m per day

Staffing hours breakdown

Info Hours of care per resident per day, broken down by staff type. Data from CMS Medicare.
Staff type Facility State avg National avg
Registered Nurse (RN) Info Registered nurse hours per resident per day. 44m per day 42m per day 41m per day
LPN / LVN Info Licensed Practical Nurse / Licensed Vocational Nurse hours per resident per day. 39m per day 50m per day 52m per day
Nurse Aide Info Nurse aide hours per resident per day. 2h 11m per day 2h 17m per day 2h 21m per day
Total Nursing (Weekend) Info Total number of nurse staff hours per resident per day on weekends. 3h 8m per day 3h 25m per day 3h 26m per day
Physical Therapist Info Physical therapist staff hours per resident per day. 6m per day 5m per day 4m per day
RN (Weekend) Info Registered nurse hours per resident per day on weekends. 30m per day 28m per day 29m per day

Capacity and availability

Medium-capacity home

Offers a balance of services and community atmosphere.

Total beds 190

This home usually has availability

Lower occupancy suggests more openings may be available.

Lower demand than the Connecticut average
Occupancy rate 79.5%
Residents per day (avg) 181
Occupancy rate
79.5%
Residents per day (avg)
181

Who this home usually serves

TYPE OF STAY

Primarily short stays

Residents typically stay for brief periods, with frequent admissions and discharges throughout the year.

Might be optimal for
Post-acute recovery Temporary care Transitional stays

Breakdown by payment type

Medicare

32% of new residents, usually for short-term rehab.

Typical stay 1 - 2 months

Private pay

64% of new residents, often for short stays.

Typical stay 15 days

Medicaid

5% of new residents, often for long-term daily care.

Typical stay 2 - 3 years

Finances and operations

Proprietary home
Corporation
Home revenue
$34.3M
Profit
$2.9M
Proprietary home Corporation
Home revenue
$34,294,751.00
Profit
$2,884,462.00
Payroll costs Info The portion of the home's budget spent on staff, including nurses, caregivers, and other employees who support care and operations.
$8.0M
23.2% of revenue
Other operating costs Info All remaining costs needed to run the home, such as food, utilities, building maintenance, supplies and administrative expenses.
$23.4M
Total costs $31.4M
Years in operation
4 years in operation
An established community with some operational experience and growing routines.
Walk Score
Walk Score: 17 / 100
Car-dependent. Most errands require a car, with limited nearby walkable options.

Services

Cardiac; Orthopedic and Stroke
Dementia Care
Hospice
IV Therapy
Pain Management
Pulmonary and Vascular Management
Recreation
Rehabilitation Therapy

About this community

Occupancy Rate
94%
Occupied Beds
178 of 190
Percentage of available beds currently in use by residents.
License Status
Active
Facility Type
Chronic & Convalescent Nursing Home
License Date
January 7, 2022
License Expiration
March 31, 2026

Additional licensing details

License number: 2470

Room costs

Private Room (18 rooms) $568 per day
Semi-Private Room (86 rooms) $528 per day

Staffing

Key information about the people who lead and staff this community.

Languages Spoken

Filipino German Hebrew Indian Italian Jamaican Japanese Polish Spanish Swedish

Staff Composition (State Data)

Admin
3 FTE
Registered Nurse
14 FTE
Licensed Practical Nurse
22 FTE
Nursing Assistant
70 FTE
Recreation
4 FTE
Social Services
2 FTE
Food Service Supervisor
1 FTE
Physical Therapy
7 FTE
Occupational Therapy
6 FTE
Speech Therapy
2 FTE
Dietary
15 FTE
Other Staff
9 FTE

Additional Policies & Features

Religious Affiliation: No Affiliation
Religious Services: All Denominations, Baptist, Catholic, Chaplain Service, Christian Science, Congregational, Episcopal, Jewish, Lutheran, Protestant

What does this home offer?

Building type icon
Building type icon

Building Type: 3-story

Dining services icon

Dining Services

Beauty services icon

Beauty Services

Housekeeping icon
Housekeeping icon

Housekeeping Services

Social and recreational activities icon

Social and Recreational Activities

Rehabilitative support icon

Rehabilitative Support

On-site medical care and health services icon

On-site Medical Care and Health Services

Types of Care at Ark Healthcare and Rehab Branford Hills

Skilled Nursing Memory Care
Contact Ark Healthcare and Rehab Branford Hills

Inspection History

In Connecticut, the Department of Public Health, Facility Licensing and Investigations Section conducts mandatory inspections and unannounced surveys to monitor the quality of care in long-term facilities.

16 visits/inspections

13 routine inspections

Breakdown by inspection type
  • 3 licensing inspections
  • 3 plans of correction

Results

3 with issues

0 without issues

Latest inspection

Date:December 12, 2025

Inspection history

01-06-2025 Inspection Report
01-23-2024 Inspection Report
02-04-2025 Inspection Report
04-29-2025 Inspection Report
05-09-2024 Inspection Report
05-21-2025 Inspection Report
07-02-2024 Inspection Report
07-17-2024 Inspection Report
08-07-2024 Inspection Report
08-25-2025 Inspection Report
10-25-2024 Inspection Report
10-25-2024 Plan of Correction
11-01-2024 Inspection Report
11-01-2024 Plan of Correction
11-06-2024 Plan of Correction
11-24-2023 Inspection Report
12-06-2022 Inspection Report
12-12-2025 Inspection Report
12-16-2024 Inspection Report

5 deficiencies

Deficiencies indicate regulatory issues. A higher number implies the facility had several areas requiring improvement.

Compare Nursing Homes around Connecticut

The information below is reported by the Connecticut Department of Public Health, Facility Licensing and Investigations Section.
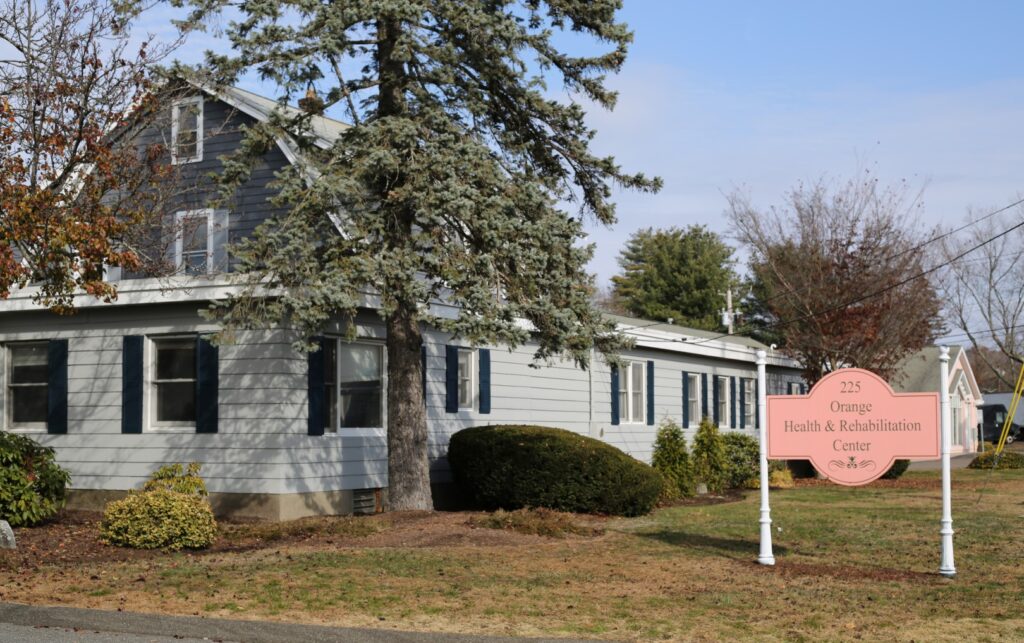
Orange Health Care Center
SNF

Nursing Home 24/7 care needed

RC

Respite Care

SN

Skilled Nursing

Orange
60
No
56
-
84.0%
$9,429,200.00
$3,619,047.00
38.4%
51.20
5/5
3.7281
5/5
4/5
4/5
-
20
+7%
-6%
0%
-
Ark Healthcare and Rehab Branford Hills
SNF

Nursing Home 24/7 care needed

MC

Memory Care Specialized care for those with Memory Loss, Alzheimer's, or dementia, ensuring safety and support.

SN

Skilled Nursing

Branford
190
No
17
FRIED, AKIVA
79.5%
$34,151,576.00
$7,969,622.00
23.3%
180.80
3/5
3.8068
3/5
3/5
3/5
1
25
-24%
-4%
-5%
Private / Semi-Private Rooms
Shady Knoll Center for Health and Rehabilitation
SNF

Nursing Home 24/7 care needed

SN

Skilled Nursing

Seymour
128
No
43
AUGUSTIN, ELZA
89.9%
$30,342,031.00
$8,754,393.00
28.9%
120.60
1/5
3.6494
2/5
1/5
2/5
-
48
+78%
-8%
+7%
Private / Semi-Private Rooms

Places of interest near Ark Healthcare and Rehab Branford Hills

Address 2.6 miles from city center

Address 189 Alps Rd, Branford, CT 06405

Calculate Travel Distance to Ark Healthcare and Rehab Branford Hills

Add your location

Address

Staffing Data

Source: CMS Payroll-Based Journal (Q2 2025)

509
Total Staff
121
Employees
388
Contractors
73,863
Total Hours (Quarter)
104
Avg Staff/Day
7.8
Avg Shift (hrs)
Nursing Staff Breakdown
Role Count Avg Shift (hrs) Uses Contractors?
Registered Nurse428.5 Yes
Licensed Practical Nurse1028.3 Yes
Certified Nursing Assistant2867.9 Yes
Staff by Category
Administration
2 staff
6.3hs shift avg
Nursing Staff
434 staff
8hs shift avg
Physicians & Practitioners
8 staff
7.6hs shift avg
Therapy Services
47 staff
6.7hs shift avg
Activities & Recreation
0 staff
0hs shift avg
Social Services
6 staff
7hs shift avg
Dietary Services
8 staff
7.5hs shift avg
Other Services
4 staff
7.8hs shift avg
Contractor Analysis
43%
of total hours from contractors
31,795 contractor hours this quarter
Certified Nursing Assistant: 219 Registered Nurse: 32 Licensed Practical Nurse: 85 Physical Therapy Aide: 6 Occupational Therapy Aide: 9 Physical Therapy Assistant: 10 Respiratory Therapy Technician: 13 Qualified Social Worker: 6 Speech Language Pathologist: 6 Medical Director: 1 Occupational Therapy Assistant: 1
Role Employees Contractors Total Staff Total Hours Days Worked % of Days Avg Shift (hrs)
Certified Nursing Assistant6721928638,09191100%7.9
Licensed Practical Nurse178510211,87891100%8.3
Registered Nurse1032428,81791100%8.5
Physical Therapy Assistant110112,0548695%7.1
Clinical Nurse Specialist7071,9367785%7.4
Other Dietary Services Staff6061,5738998%7.5
Physical Therapy Aide1671,5487481%7.2
RN Director of Nursing4041,4887380%7.6
Mental Health Service Worker4041,4797380%7.8
Respiratory Therapy Technician013131,0668189%5.7
Qualified Social Worker0668107178%7
Occupational Therapy Aide0998057684%7.2
Speech Language Pathologist0667287178%6.5
Administrator1015136673%7.8
Nurse Practitioner1014986167%8.2
Dietitian2024906268%7.8
Occupational Therapy Assistant011502224%2.3
Medical Director011402123%1.9

Health Inspection History

Inspections
Total health inspections 8

Connecticut average 5.7


Last Health inspection on Aug 2025

Total health citations 25
Citations per inspection
3.12

Health citations are formal notices following inspections when they fail to comply with safety and care standards.

16 of 25 citations resulted from standard inspections; 8 of 25 resulted from complaint investigations; and 1 of 25 came from combined inspections (standard and complaint).

Breakdown of citation severity (last 3 years)
Critical Health citations More info 0
100% better than Connecticut average

Connecticut average: 0.3


Serious Health citations More info 0
100% better than Connecticut average

Connecticut average: 0.7

0 critical citations More info Connecticut average: 0.3

0 serious citations More info Connecticut average: 0.7

24 moderate citations More info Connecticut average: 28.8

1 minor citation More info Connecticut average: 2.3
Citations history (last 3 years)
Pharmacy moderate citation Aug 25, 2025
Corrected

Care Planning minor citation Aug 25, 2025
Corrected

Resident Rights moderate citation Aug 25, 2025
Corrected

Quality of Care moderate citation Aug 30, 2024
Corrected

Facility Characteristics

Source: CMS Long-Term Care Facility Characteristics (Data as of Jan 2026)

Ownership: For-Profit LLC
Part of: ARK HEALTH CARE AND REHAB
Resident Census by Payment Source
143 Total Residents
Medicare 14 (9.8%)
Medicaid 90 (62.9%)
Private Pay/Other 39 (27.3%)
Specialized Care Beds
211 Total Specialty Beds
111.1% of Bed Capacity
160
Alzheimer's / Dementia Beds
84.2%
1
Dialysis Beds
0.5%
20
Hospice Beds
10.5%
30
Other Specialized Rehab Beds
15.8%
Programs & Services
Residents' Group
Family Member Group
Family Engagement

Active councils help families stay involved in care decisions and facility operations.

Quality of care over time

These measures show how residents usually do over time at this home, based on health outcomes and preventive care.

High-risk clinical events score Info A composite score based on pressure ulcers, falls with injury, weight loss, walking ability decline, and activities of daily living decline. 13.5
30% worse than Connecticut average

Connecticut average: 10.4

Functional decline score Info A composite score based on activities of daily living decline, walking ability decline, and incontinence. 27.7
31% worse than Connecticut average

Connecticut average: 21.1

Long-stay resident measures
Need for Help with Daily Activities Increased Info Percent of long-stay residents whose need for help with daily activities has increased 23.4%
24% worse than Connecticut average

Connecticut average: 18.9%

Walking Ability Worsened Info Percent of long-stay residents whose ability to move independently worsened 27.1%
41% worse than Connecticut average

Connecticut average: 19.2%

Low Risk Residents with Bowel/Bladder Incontinence Info Percent of low risk long-stay residents who lose control of their bowels or bladder 32.6%
31% worse than Connecticut average

Connecticut average: 24.9%

Falls with Major Injury Info Percent of long-stay residents experiencing one or more falls with major injury 5.5%
59% worse than Connecticut average

Connecticut average: 3.5%

High Risk Residents with Pressure Ulcers Info Percent of long-stay high risk residents with pressure ulcers 5.6%
21% worse than Connecticut average

Connecticut average: 4.6%

Urinary Tract Infection Info Percent of long-stay residents with a urinary tract infection 3.0%
76% worse than Connecticut average

Connecticut average: 1.7%

Lost Too Much Weight Info Percent of long-stay residents who lose too much weight 5.9%
6% better than Connecticut average

Connecticut average: 6.3%

Depressive Symptoms Info Percent of long-stay residents who have depressive symptoms 9.8%
35% better than Connecticut average

Connecticut average: 15.2%

Antipsychotic Use Info Percent of long-stay residents who received an antipsychotic medication 17.4%
In line with Connecticut average

Connecticut average: 17.2%

Pneumococcal Vaccine Info Percent of long-stay residents assessed and appropriately given the pneumococcal vaccine 61.1%
30% worse than Connecticut average

Connecticut average: 87.5%

Influenza Vaccine Info Percent of long-stay residents assessed and appropriately given the seasonal influenza vaccine 94.2%
In line with Connecticut average

Connecticut average: 93.5%

Hospitalizations per 1,000 days Info Number of hospitalizations per 1,000 long-stay resident days. 2.66
27% worse than Connecticut average

Connecticut average: 2.10

ED visits per 1,000 days Info Number of outpatient emergency department visits per 1,000 long-stay resident days. 0.42
73% better than Connecticut average

Connecticut average: 1.53

Short-stay resident measures
Pneumococcal Vaccine Info Percent of short-stay residents assessed and appropriately given the pneumococcal vaccine 89.4%
28% better than Connecticut average

Connecticut average: 70.1%

Antipsychotic medication increase Info Percent of short-stay residents who newly received an antipsychotic medication 2.2%
42% worse than Connecticut average

Connecticut average: 1.5%

Influenza Vaccine Info Percent of short-stay residents assessed and appropriately given the seasonal influenza vaccine 91.0%
30% better than Connecticut average

Connecticut average: 69.8%

Re-hospitalized after SNF stay Info Percentage of short-stay residents who were re-hospitalized after their nursing home admission. 27.4%
10% worse than Connecticut average

Connecticut average: 25.0%

Emergency department visits Info Percentage of short-stay residents who had an outpatient emergency department visit. 5.8%
48% better than Connecticut average

Connecticut average: 11.1%

Falls with major injury Info Percentage of SNF residents who experience falls with major injury during their stay. 1.2%
58% worse than Connecticut average

Connecticut average: 0.8%

Ability to care for self at discharge Info Percentage of residents at or above expected ability to care for themselves at discharge. 44.3%
17% worse than Connecticut average

Connecticut average: 53.7%

Successful return to home or community Info Rate of successful return to home or community from a skilled nursing facility. 64.1%
27% better than Connecticut average

Connecticut average: 50.6%

Penalties and fines

Federal penalties imposed by CMS for regulatory violations, including civil money penalties (fines) and denials of payment for new Medicare/Medicaid admissions.

Source: CMS Penalties Database (Data as of Jan 2026)

Total fines amount $8K
82% lower than Connecticut average

Connecticut average: $44K

Number of fines 1
43% fewer fines than Connecticut average

Connecticut average: 1.7

Payment Denials Info Serious action where Medicare and/or Medicaid temporarily stops payments for new residents until issues are fixed. 0
100% fewer payment denials than Connecticut average

Connecticut average: 0.1

Fines amount comparison
This facility $8K
Connecticut average $44K
Penalty History

Penalties are imposed by CMS for violations of federal nursing home regulations.

Civil Money Penalty Info Fines imposed for noncompliance, which can be assessed per day or per instance of violation. Jul 24, 2024
$8K

Last updated: Jan 2026

Guides for Better Senior Living

Care Cost Calculator: See Prices in Your Area

Nursing Home Data Explorer

Don’t Wait Too Long: 7 Red Flag Signs Your Parent Needs Assisted Living Now

The True Cost of Assisted Living in 2025 – And How Families Are Paying For It

Understanding Senior Living Costs: Pricing Models, Discounts & Financial Assistance

Financial Aid for Connecticut Seniors

Get financial aid guidance

Connecticut Home Care Program for Elders

CHCPE

Age 65+, Connecticut resident, at risk of nursing home placement.

State-funded: ~$1,600/month; Medicaid: ~$2,829/month (300% FBR).

$1,600 (state), $2,000 (Medicaid, individual).

Two tiers (state and Medicaid); waitlists possible.

Statewide Respite Care Program

CT Respite Care

Caregiver of senior with dementia, Connecticut resident.

~$2,500/month (individual, varies).

$40,000 (individual).

Limited to dementia caregivers; capped funding.

Congregate Housing Services Program (CHSP)

Connecticut Congregate Housing Services Program

Age 62+, Connecticut resident, frail but not needing 24/7 care, resides in CHSP-eligible housing.

~$41,000/year (individual, adjusted annually).

Not specified; focus is income-based.

Limited to 14 state-subsidized sites; participants pay 10% of service costs.

Medicare Savings Program (MSP)

Connecticut Medicare Savings Program

Age 65+ or disabled, Connecticut resident, enrolled in Medicare Part A/B.

~$2,510/month (individual, QMB); ~$3,380/month (SLMB); ~$3,598/month (ALMB)—adjusted annually.

None since 2023 policy change.

Three tiers (Qualified Medicare Beneficiary, Specified Low-Income, Additional Low-Income); no asset test.

Senior Community Service Employment Program (SCSEP)

Connecticut SCSEP (federally funded, state-administered)

Age 55+, unemployed, low-income, Connecticut resident.

~$1,983/month (125% FPL, individual).

Not specified; income-focused.

Priority for veterans, rural residents; limited slots (~500/year).

Who we are

Your Senior Care Partner, Every Step of the Way

We help families find affordable senior communities and unlock same day discounts, Medicaid, and Medicare options tailored to your needs.

Contact us Today