Nursing Home

Ashton Medical Lodge

Nursing Home

Ashton Medical Lodge

801 S Loop 250 W, Midland, TX 79703 View map
Overview of Ashton Medical Lodge

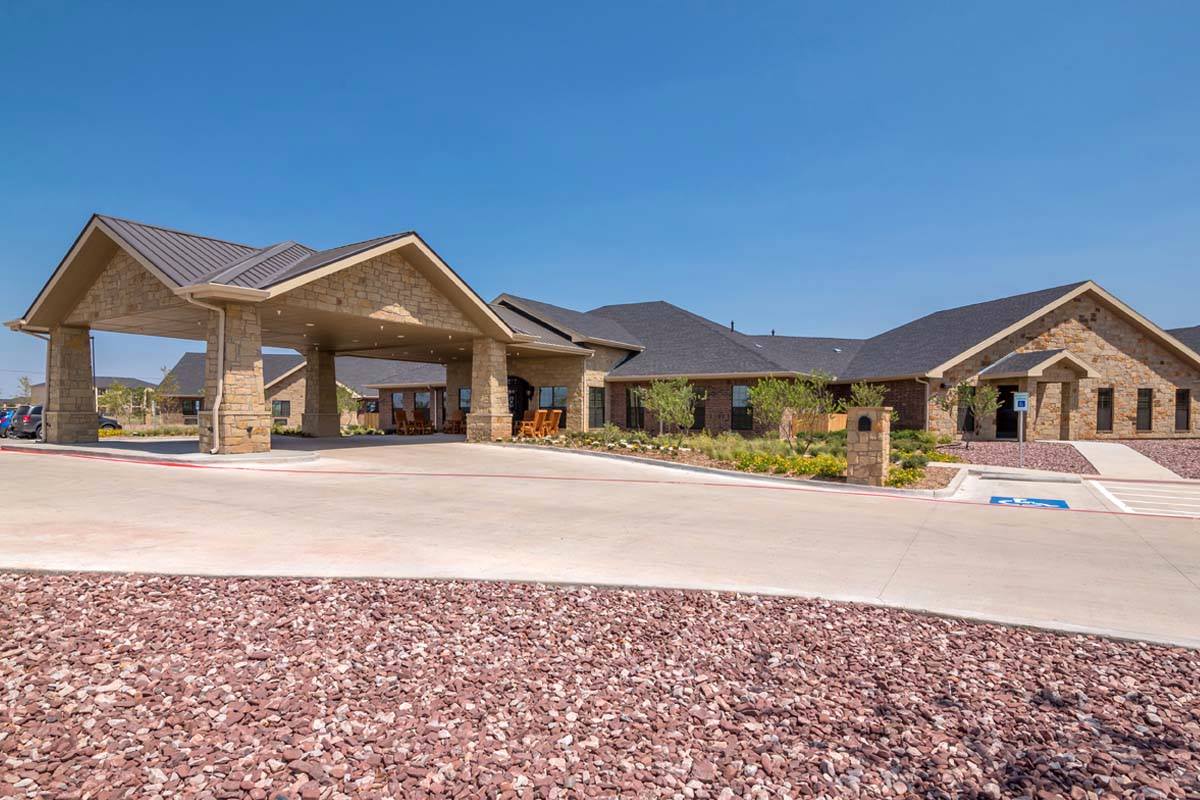
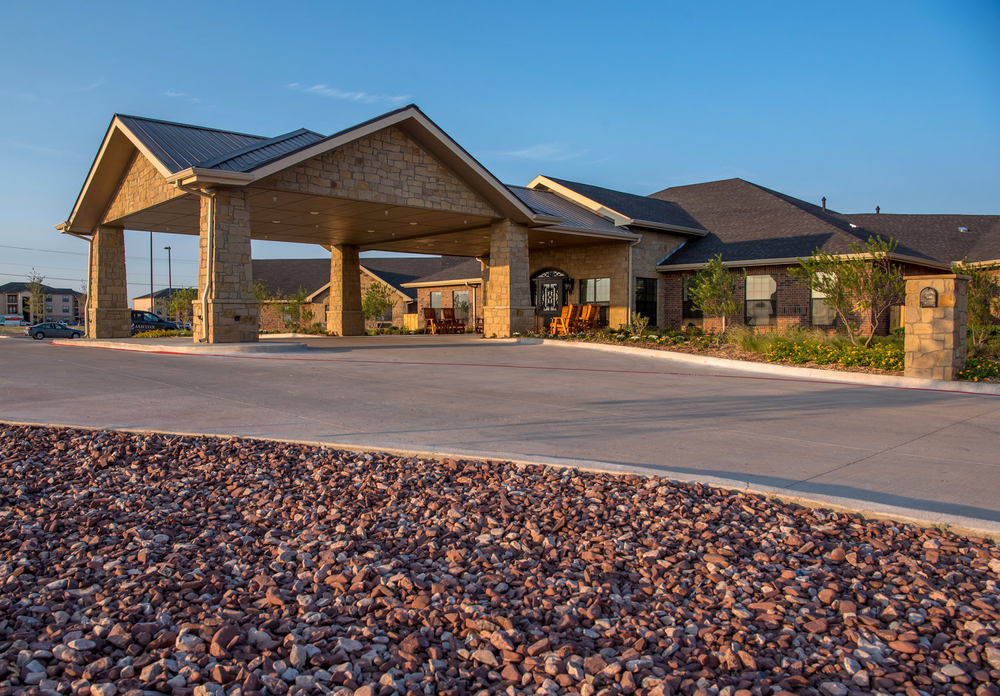
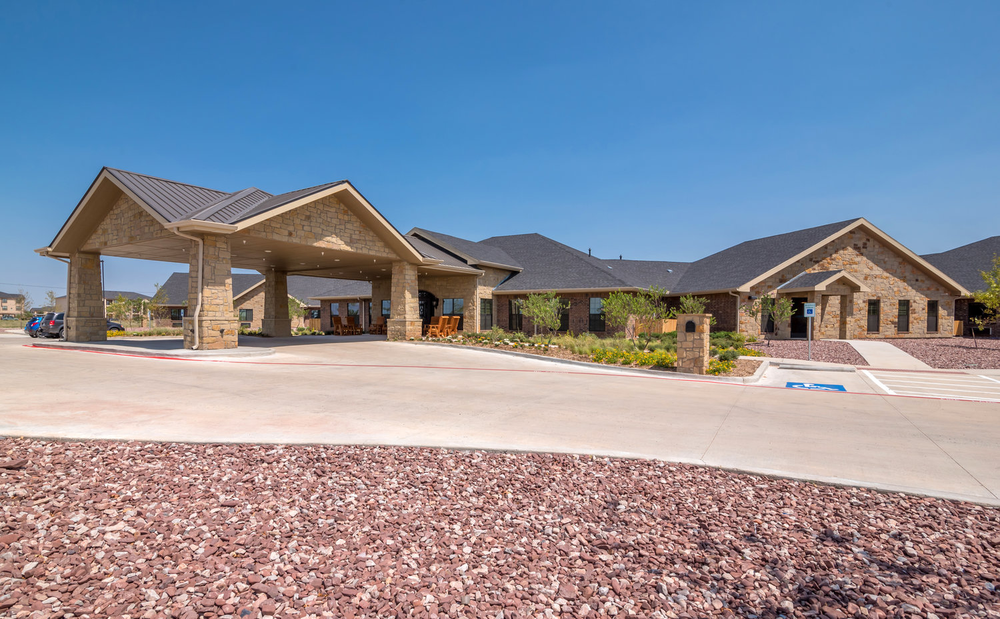
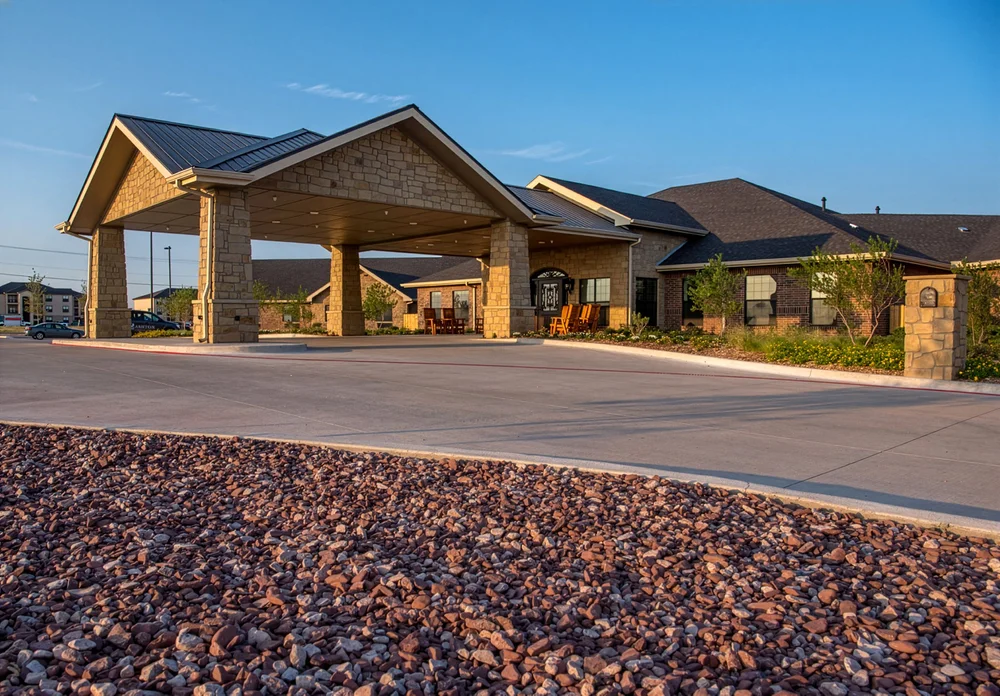
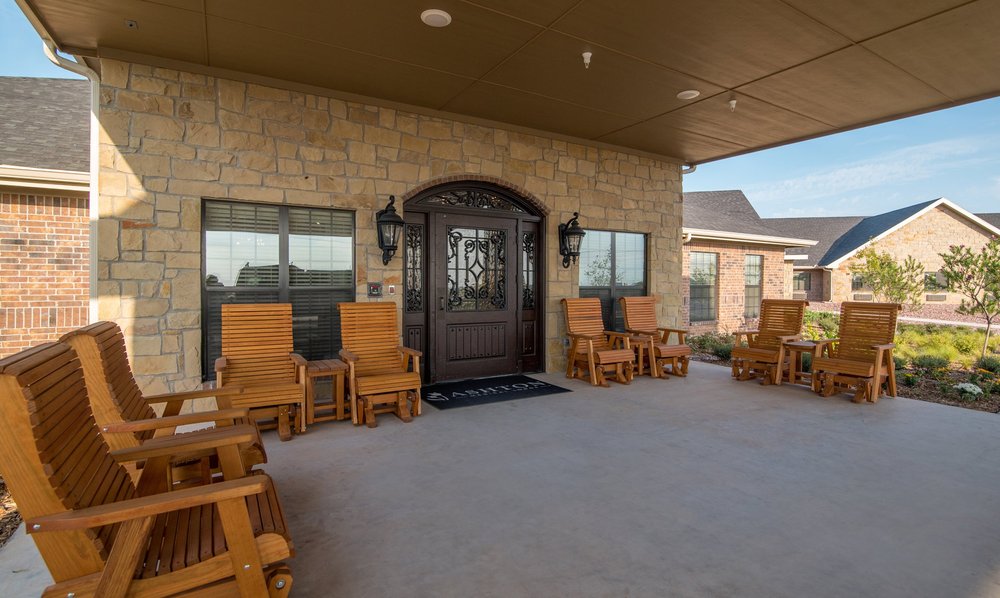
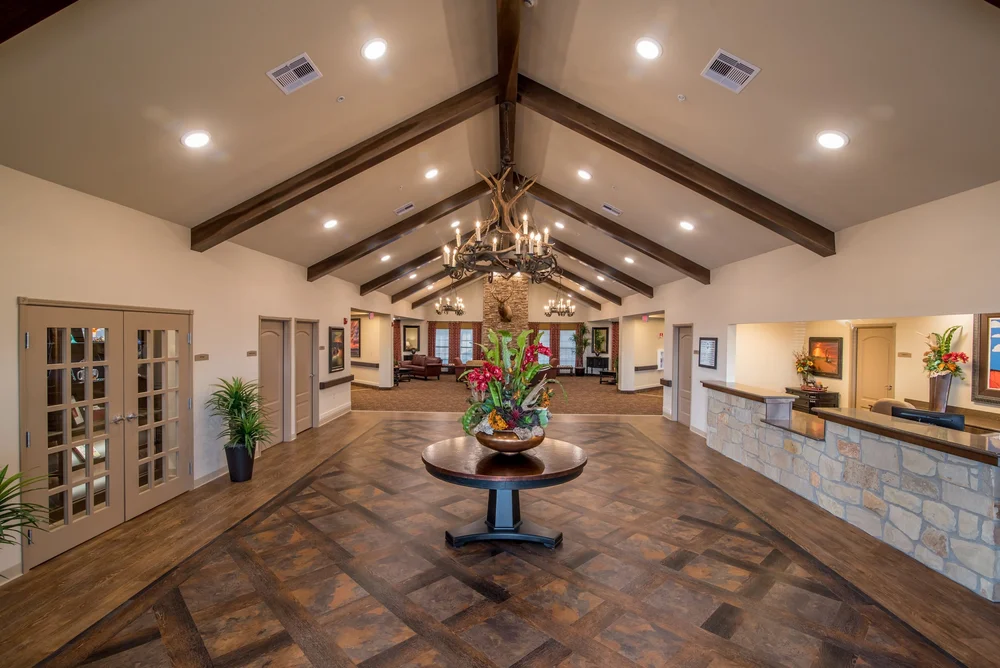
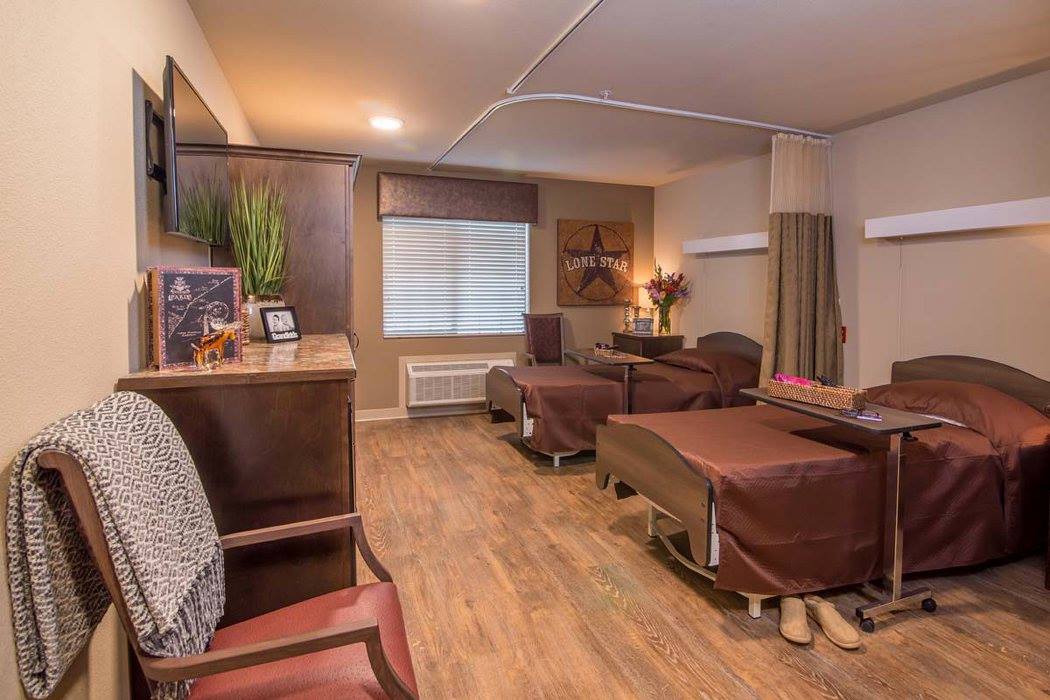
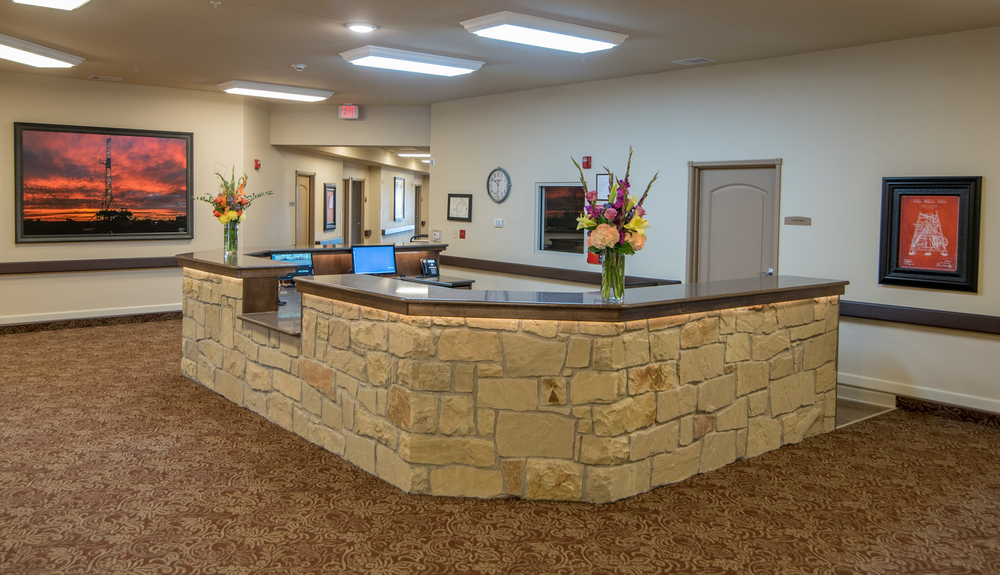
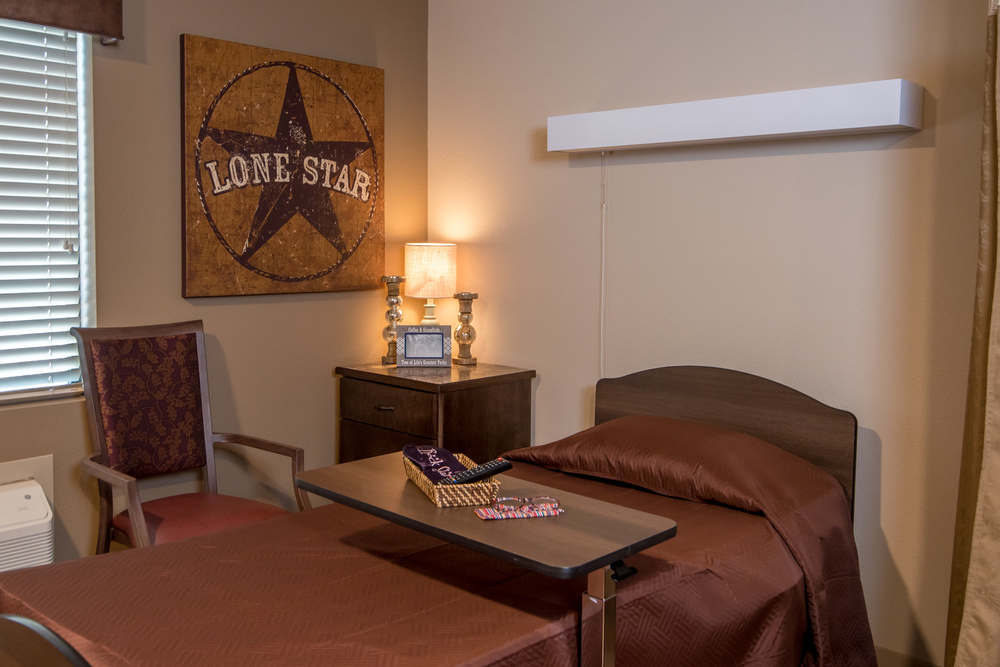
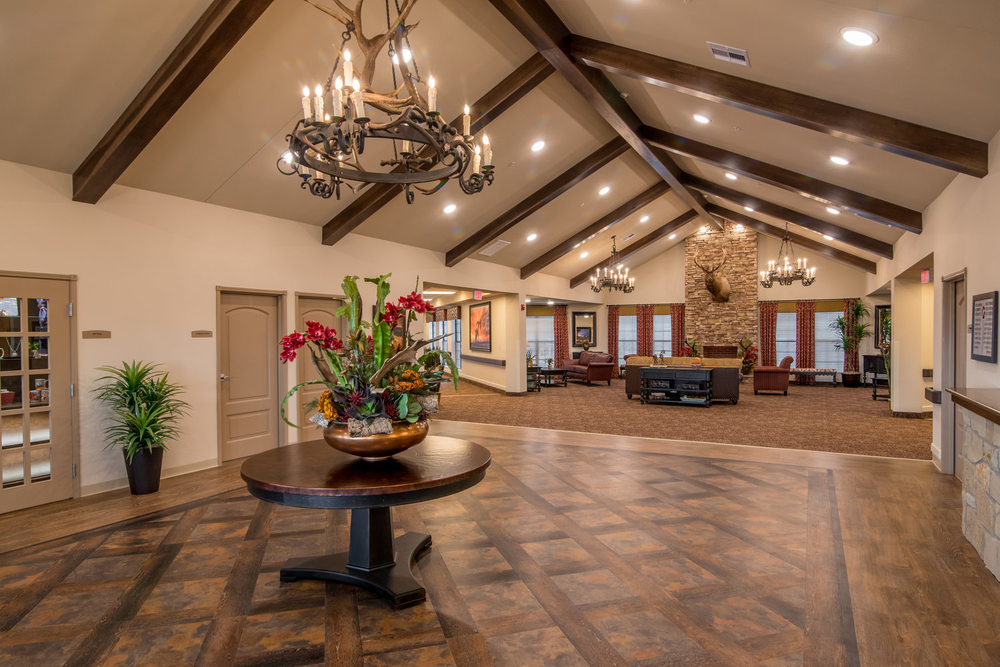
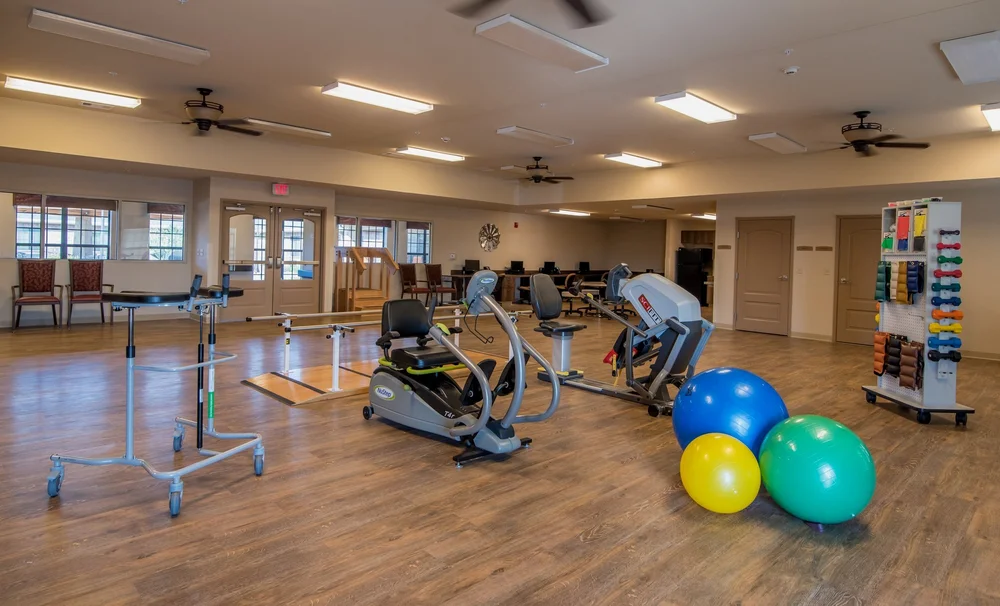
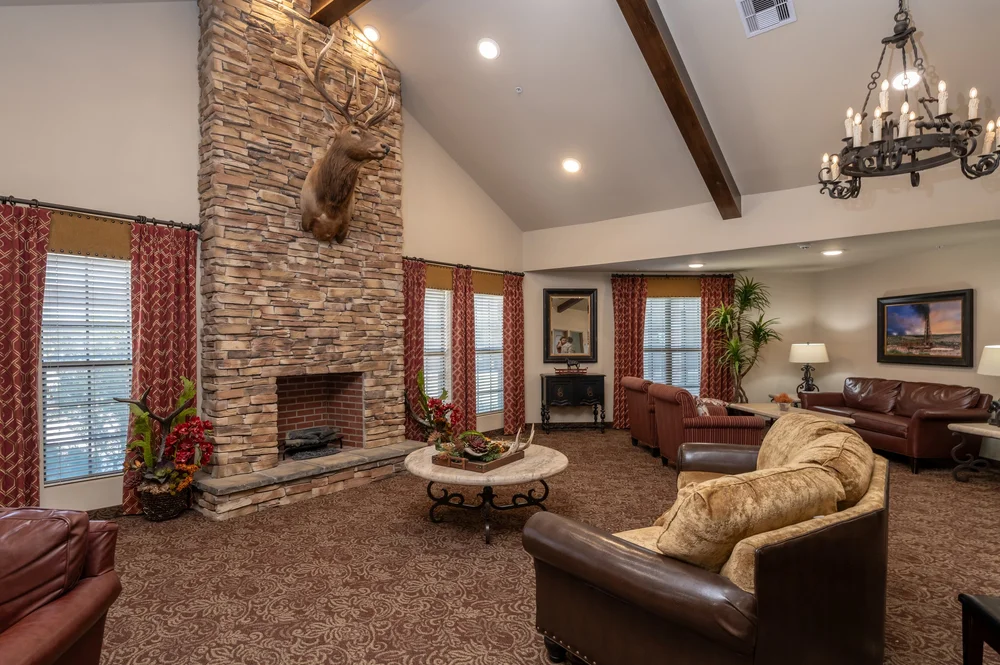
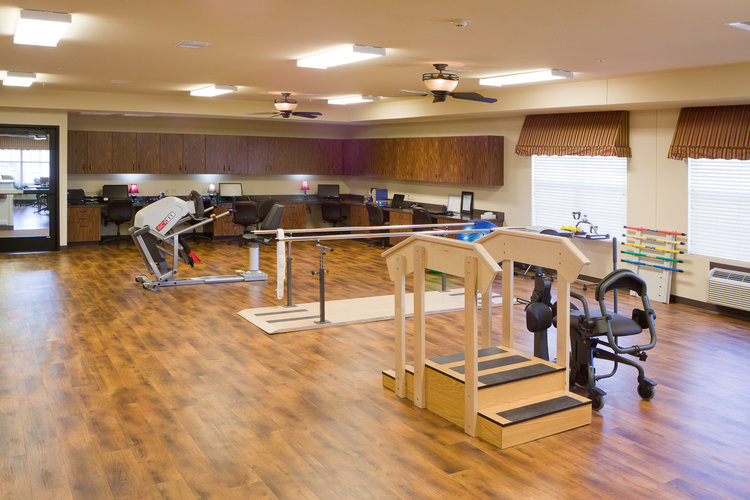
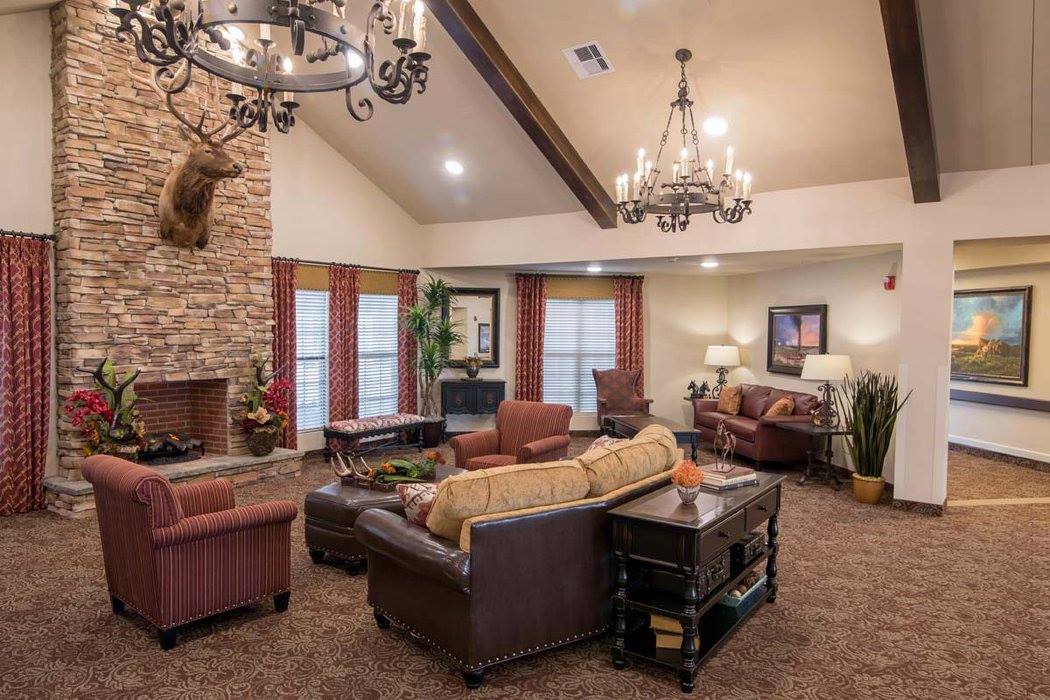
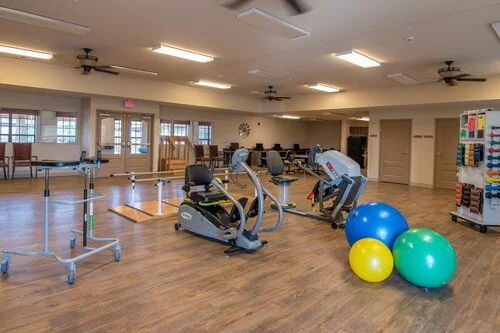
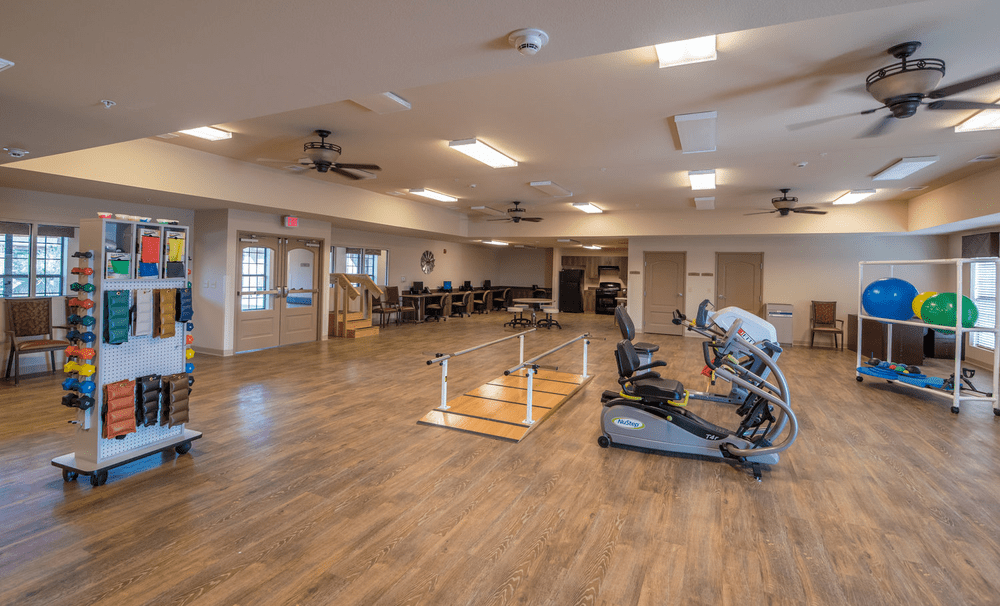
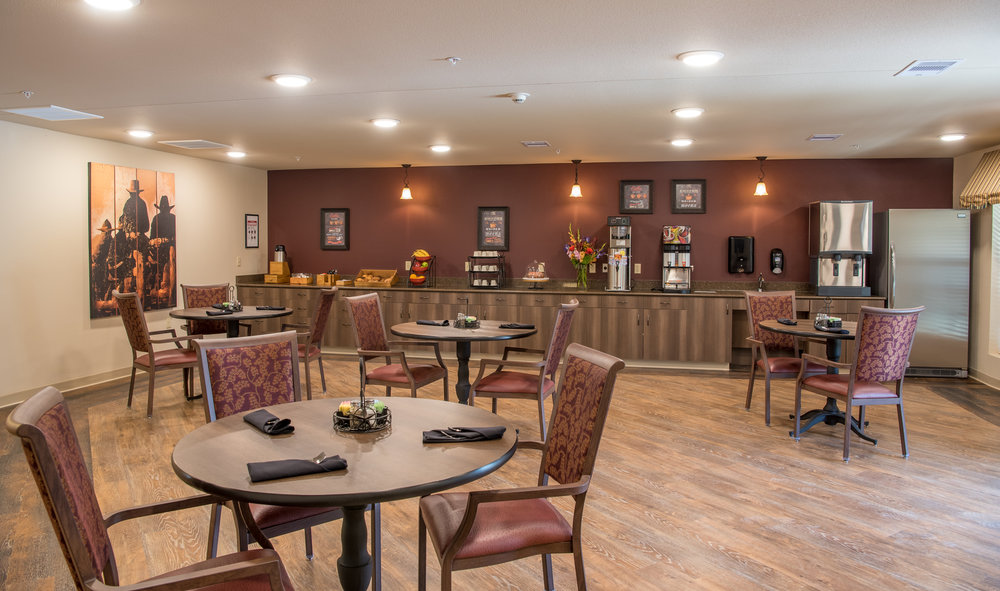
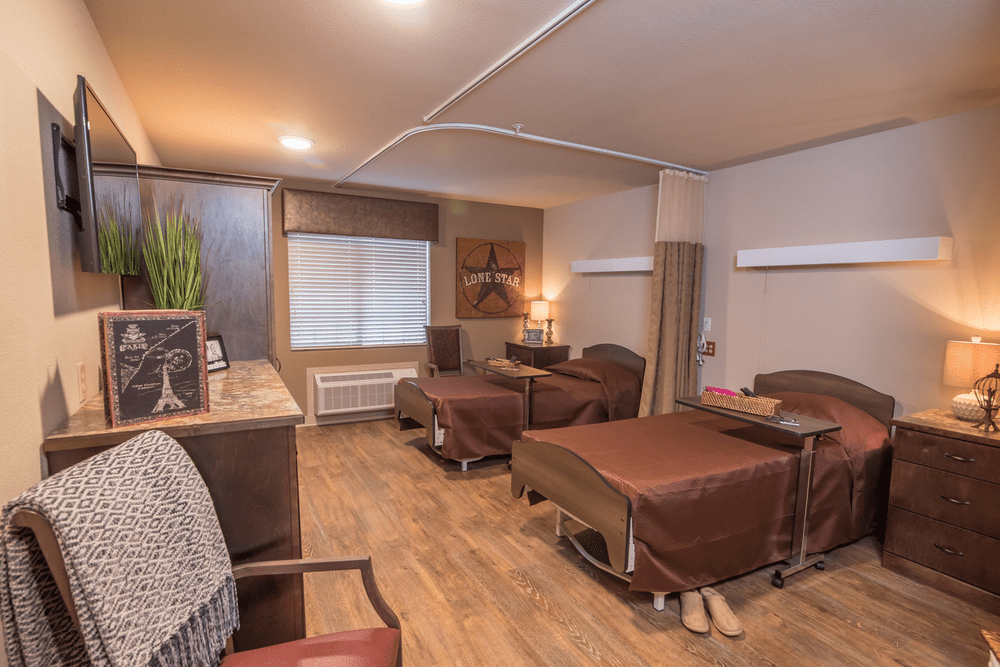
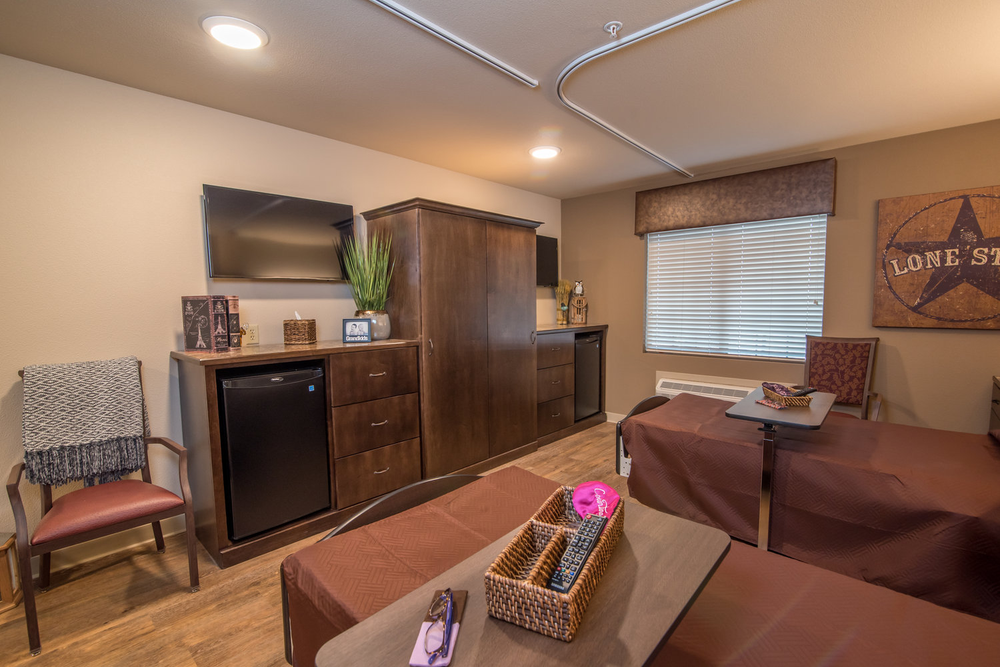
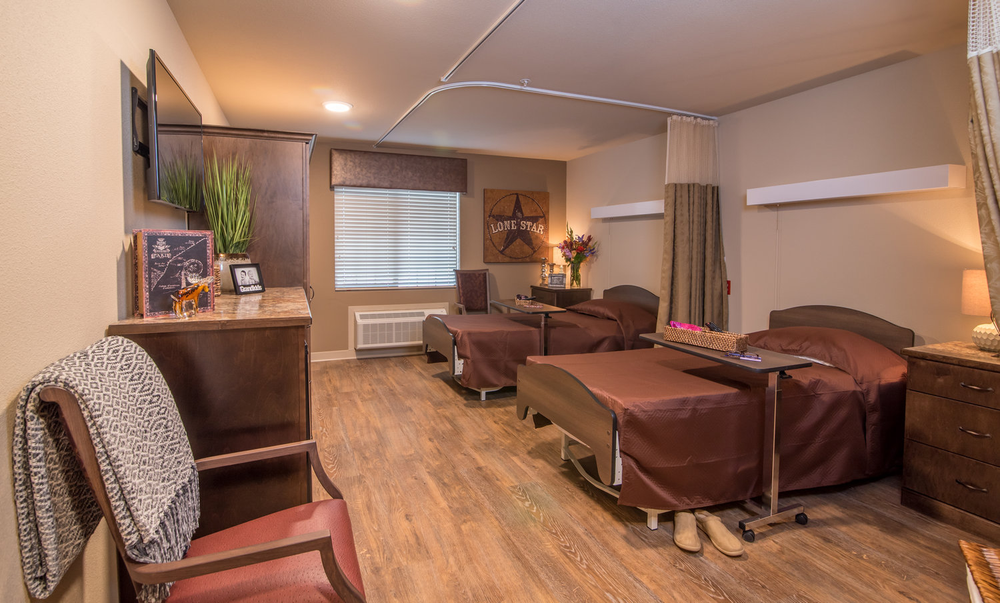
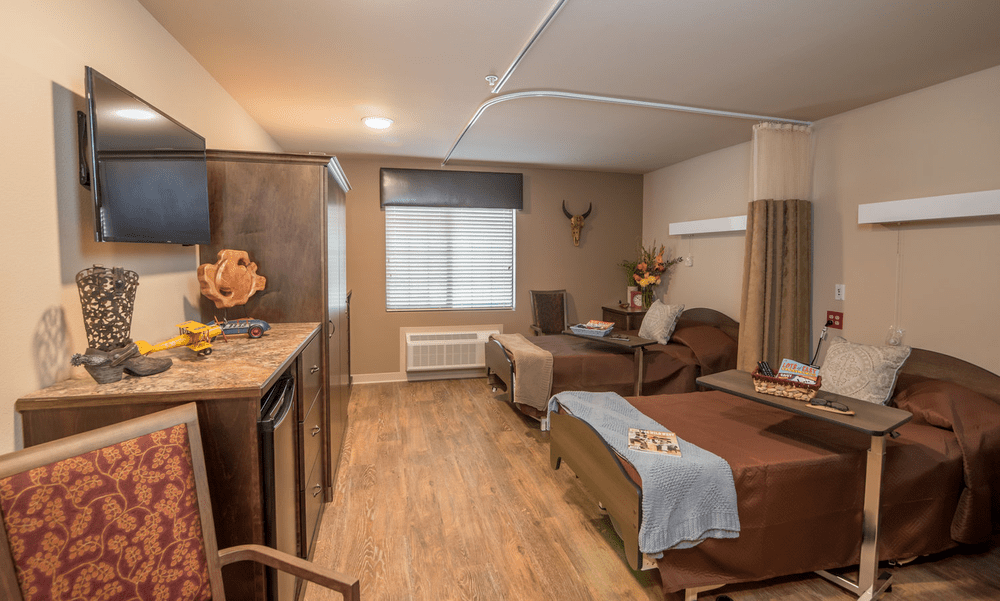
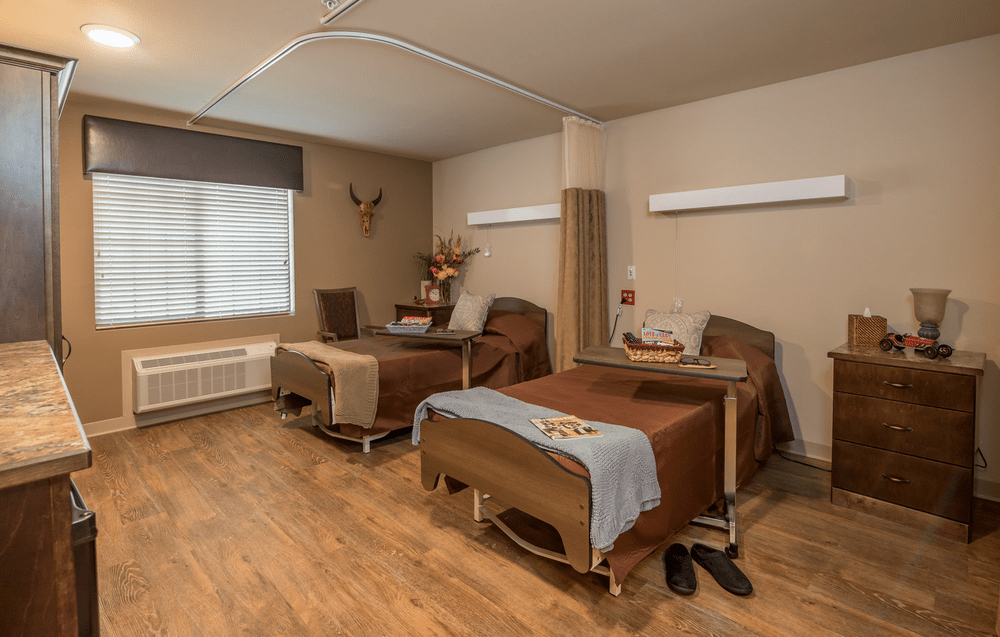
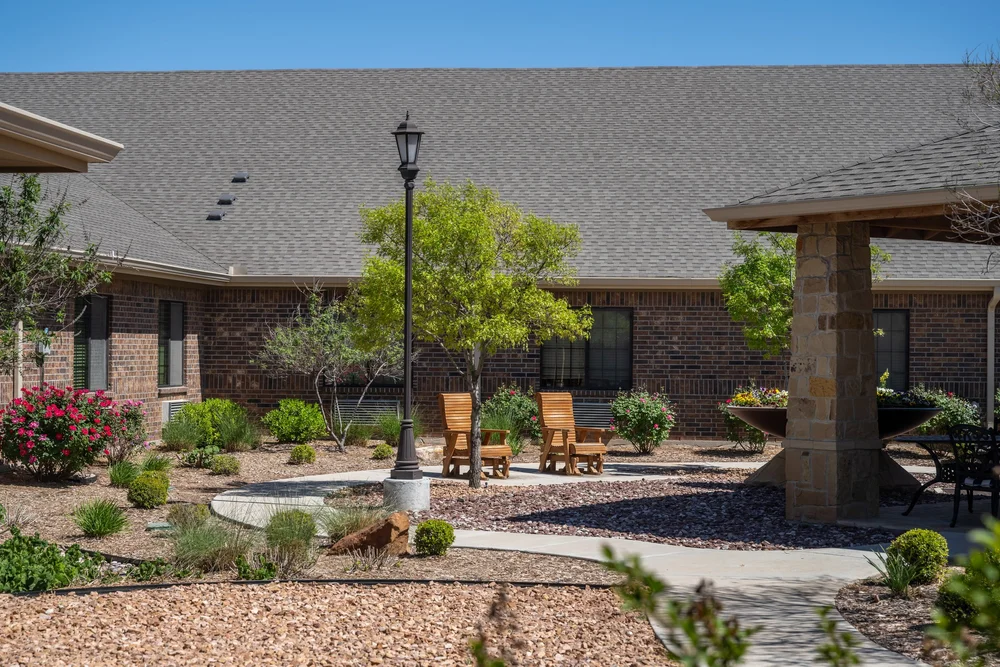
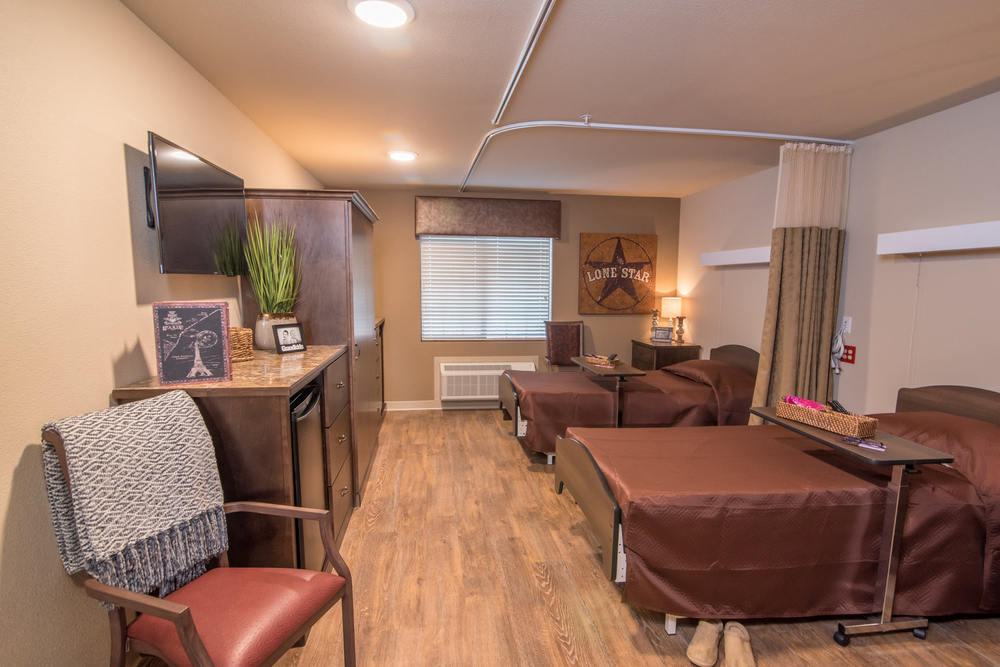
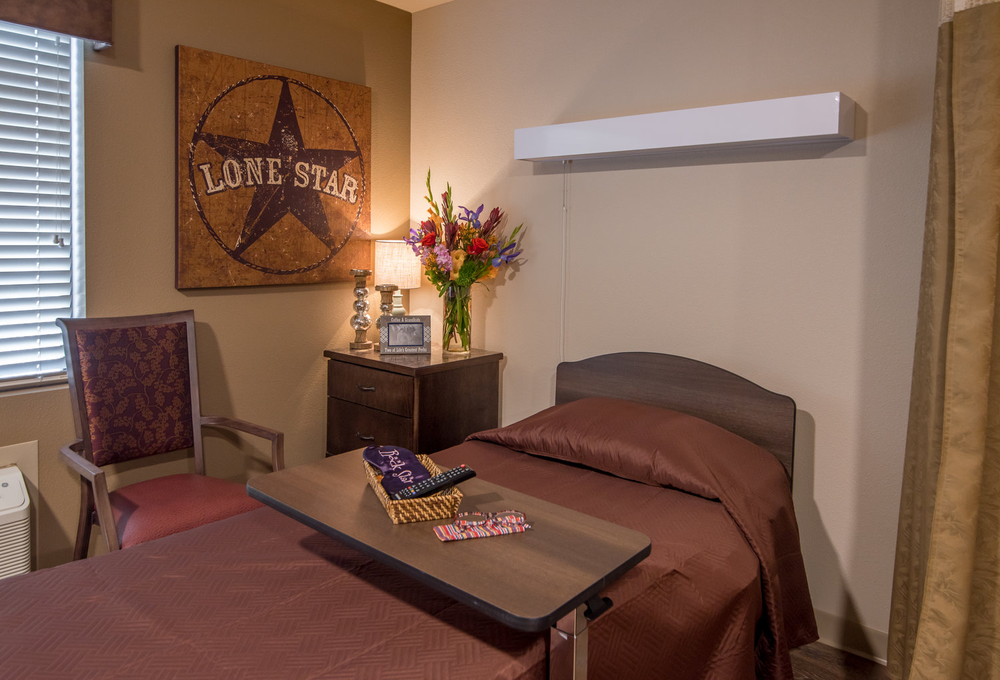
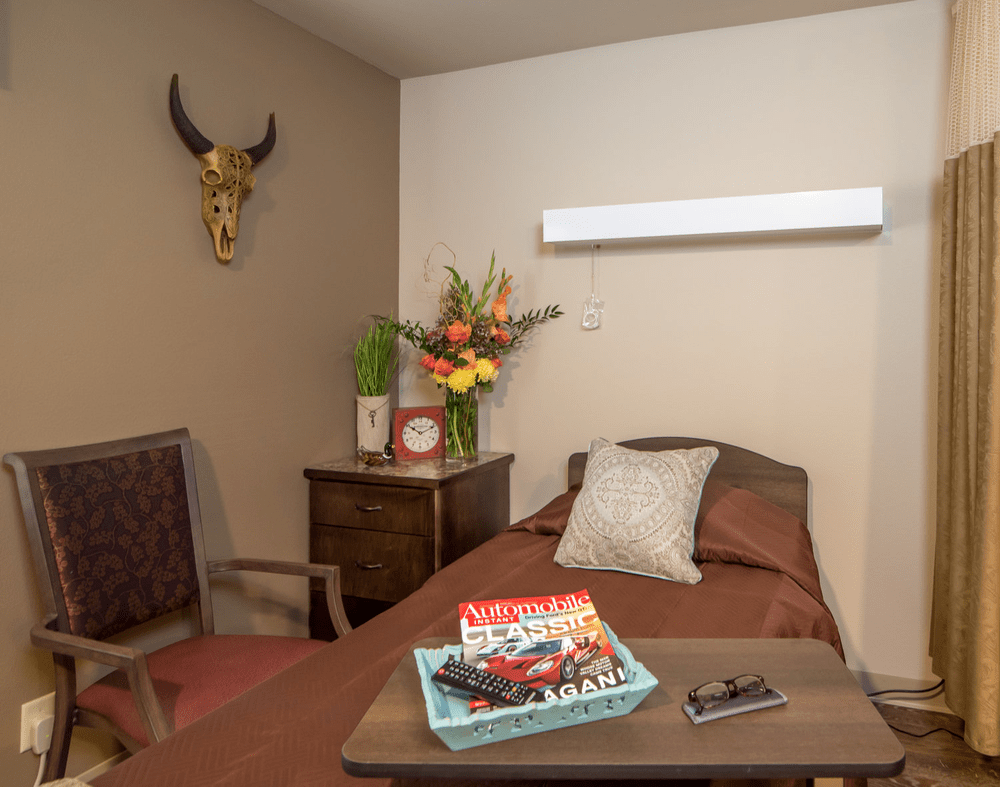
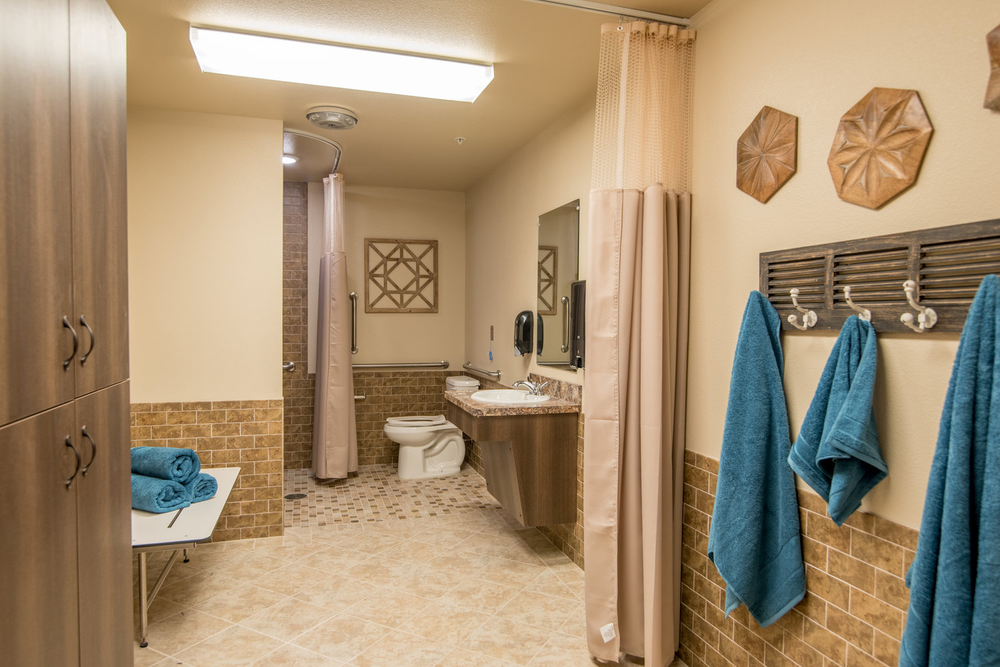
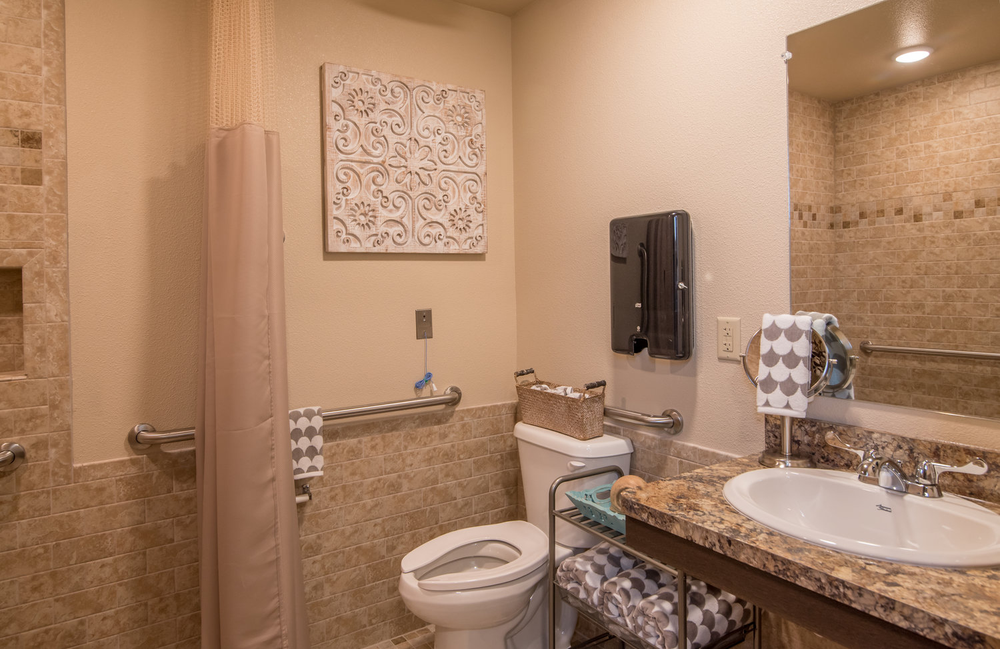
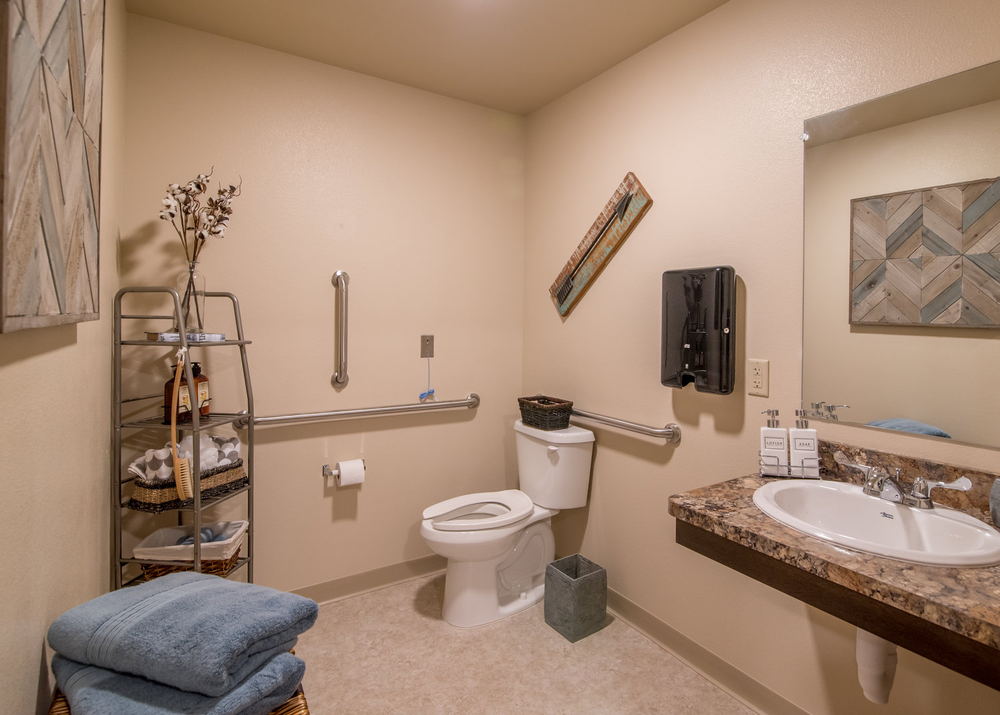
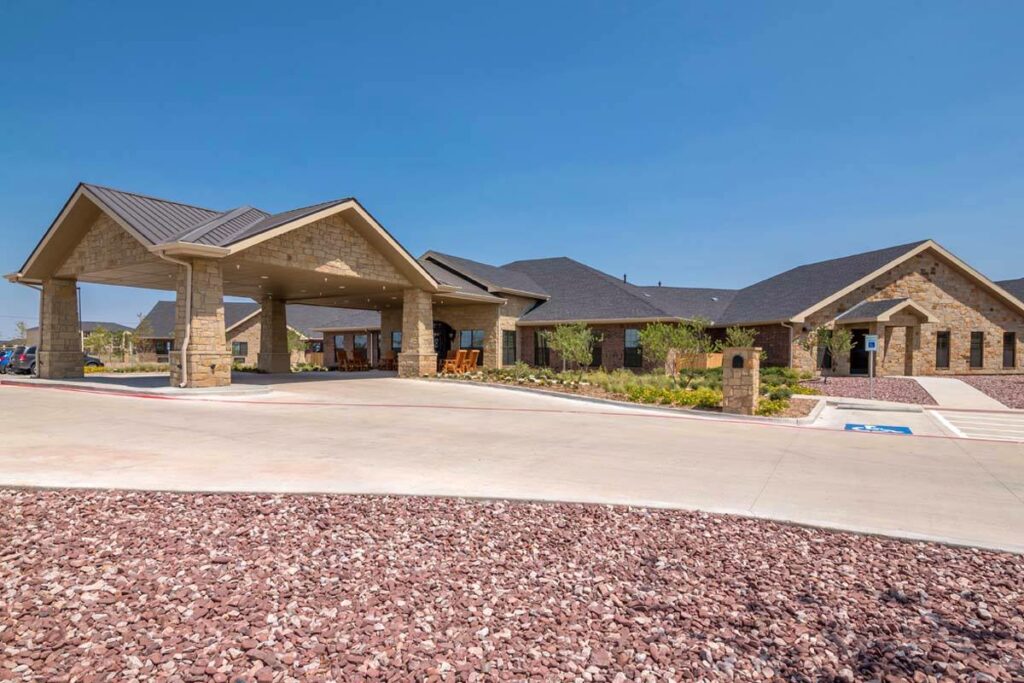
Conveniently situated in Midland, Texas, Ashton Medical Lodge stands as a symbol of compassionate care, providing both long-term care and short-term rehabilitation services to its cherished residents. With a steadfast commitment to enhancing the quality of life for every individual, the community boasts spacious suites, each designed to offer comfort and privacy, while the personal refrigerators in each suite offer convenience and independence. Residents enjoy modern comforts, too, such as Wi-Fi and phone service, allowing them to stay connected with loved ones. Ashton Medical Lodge also offers specialized Alzheimer’s and dementia care, ensuring residents receive the dedicated support they need.

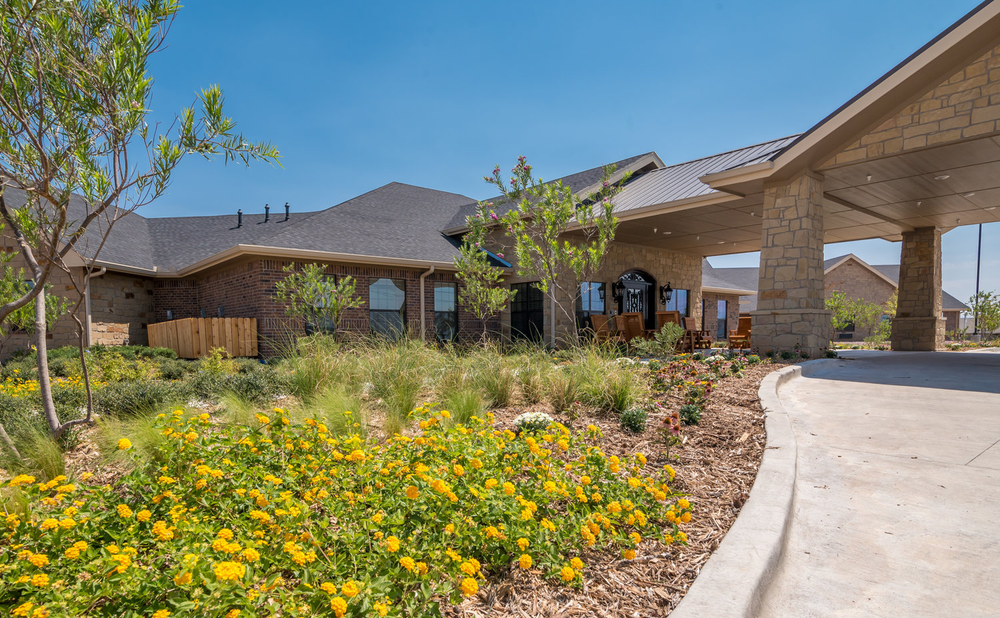
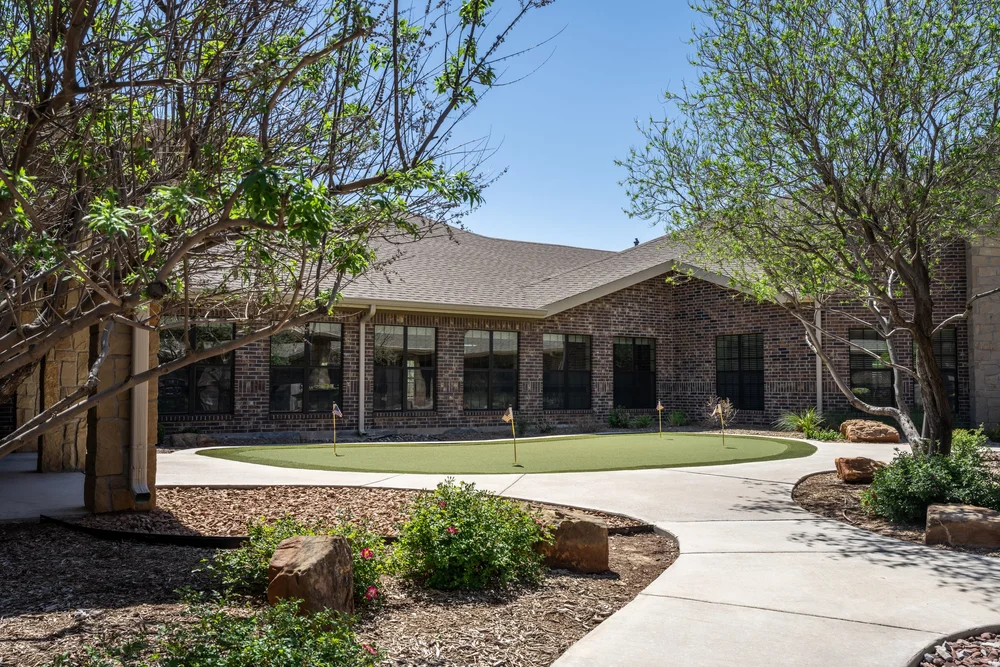
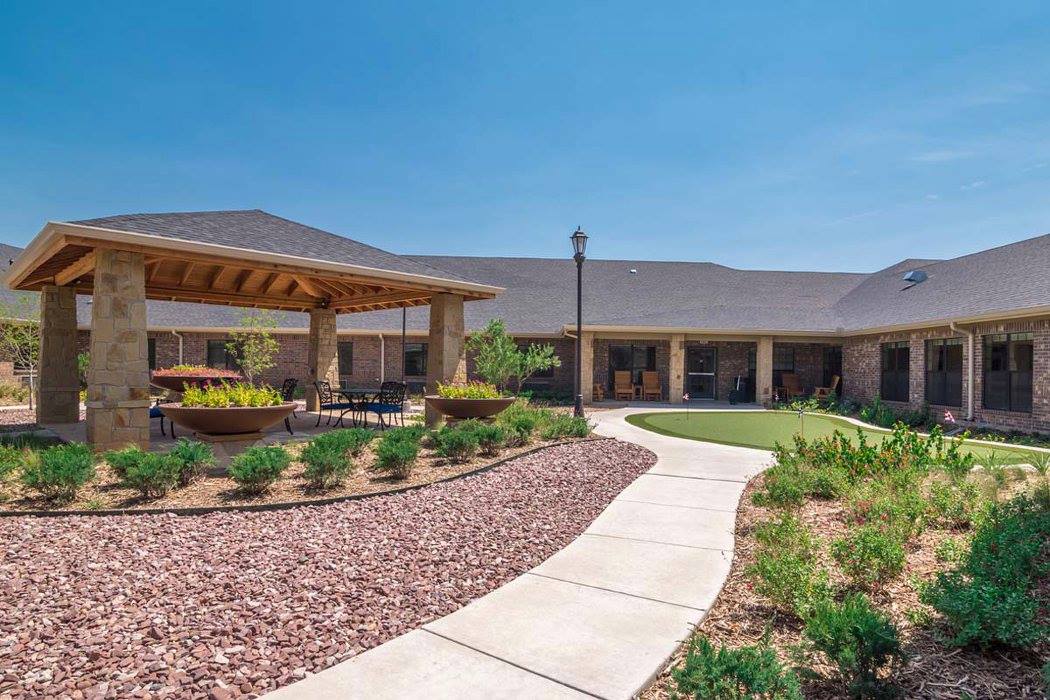
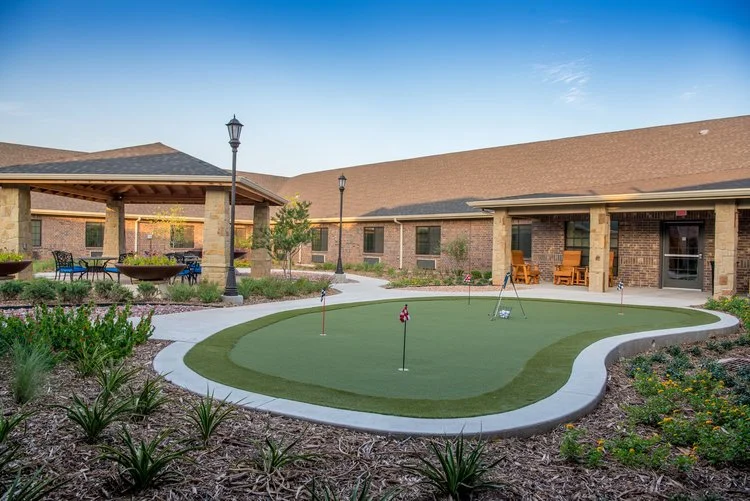
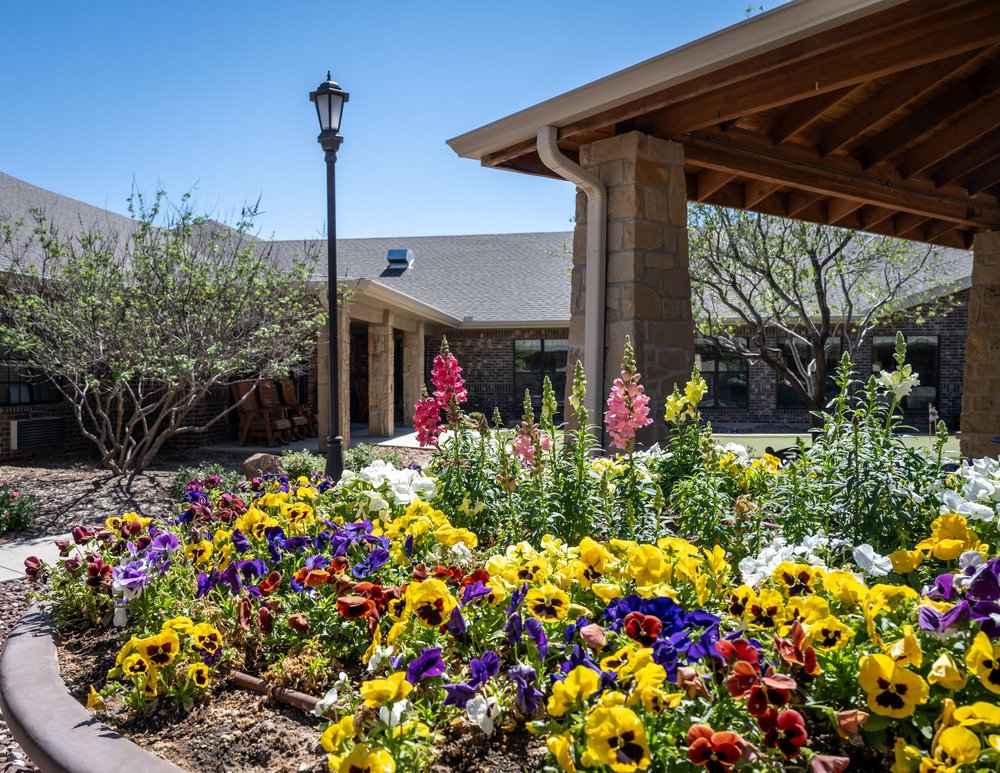
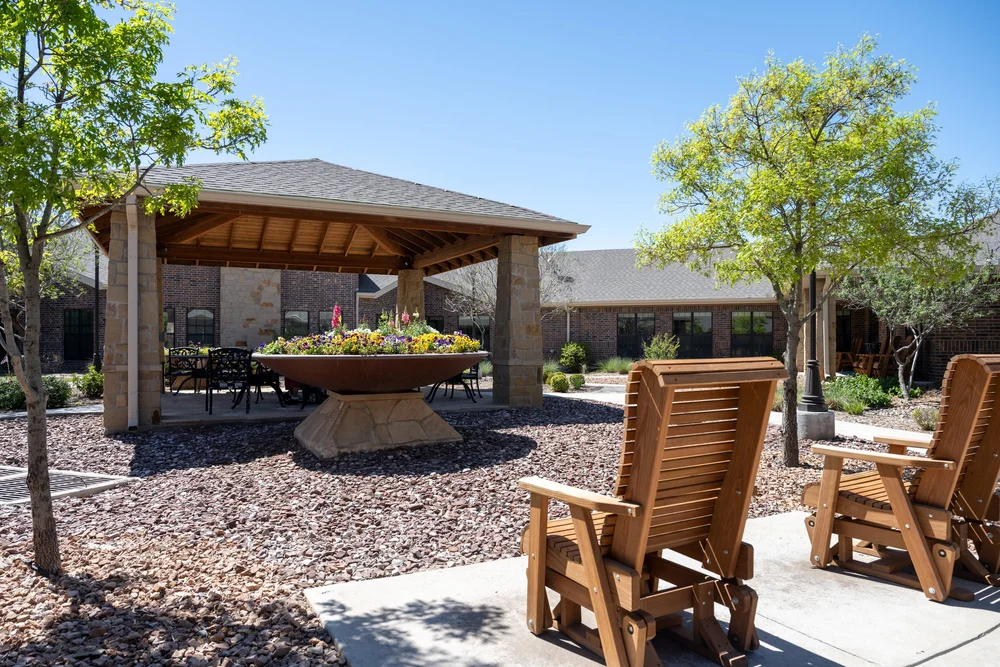
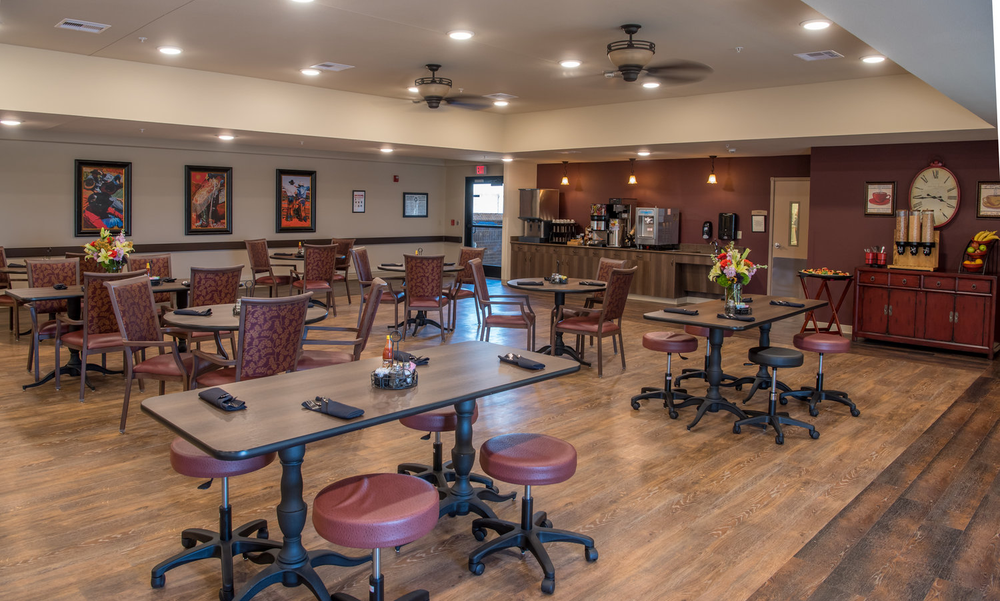
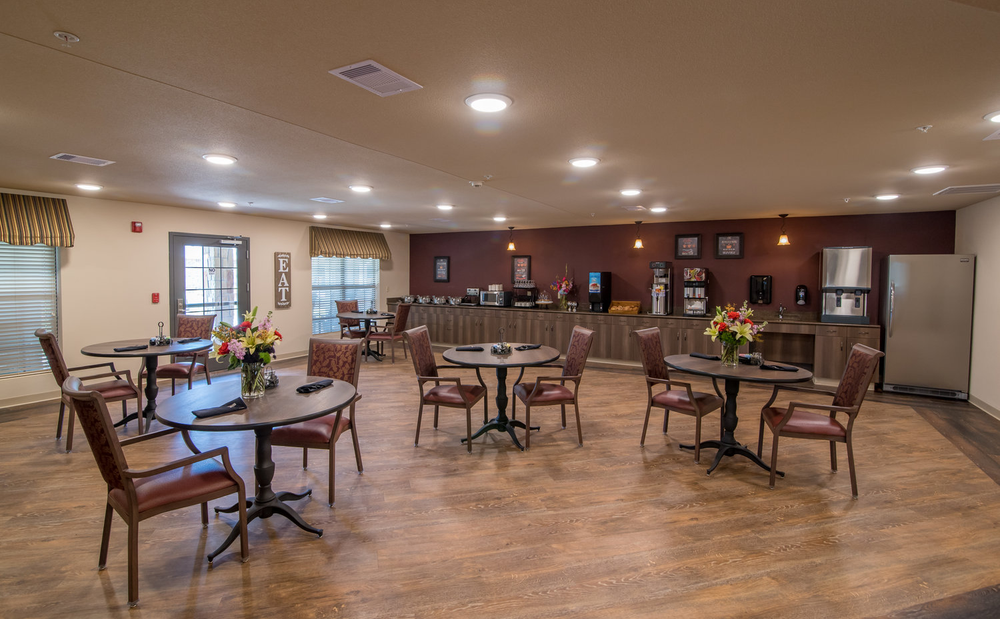
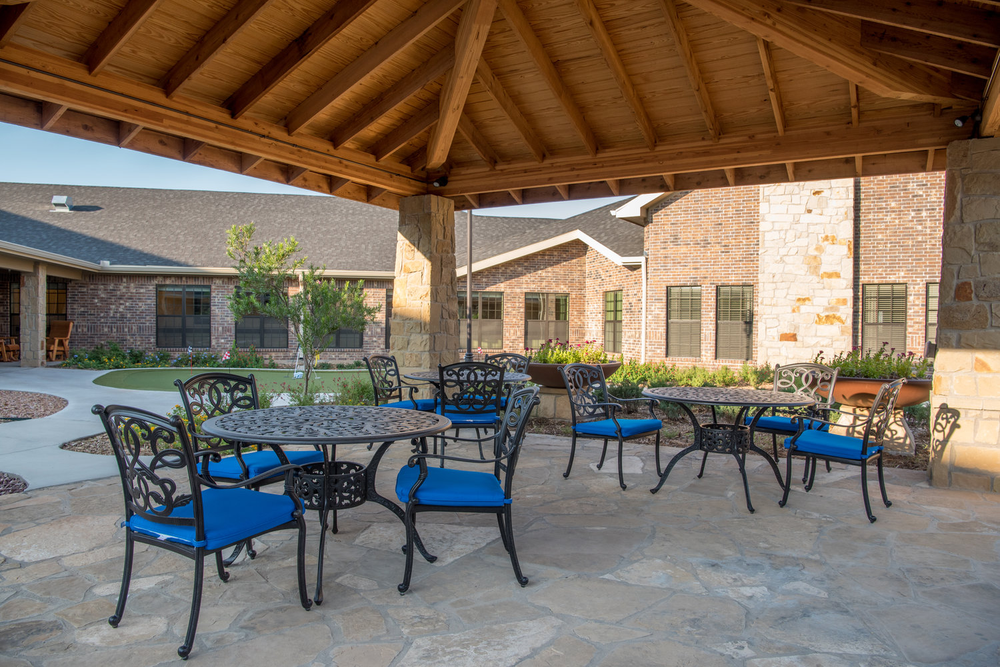
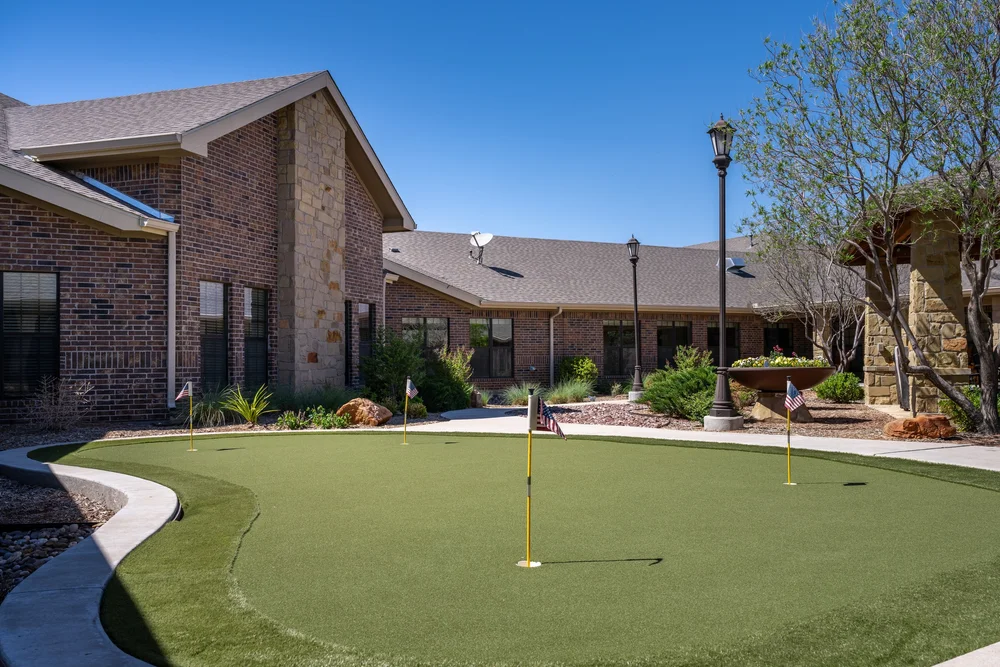
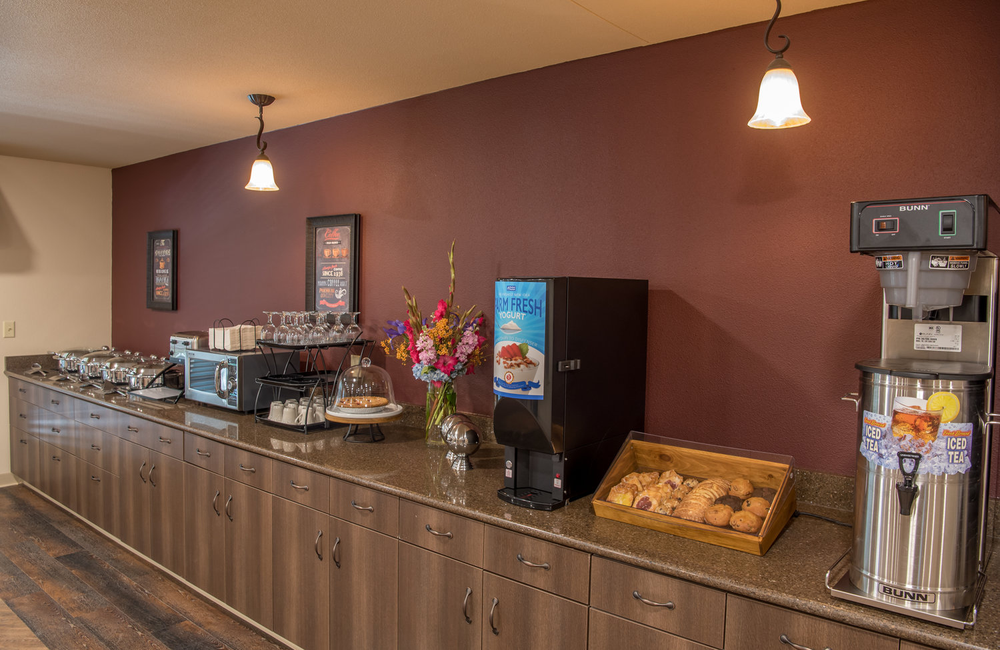
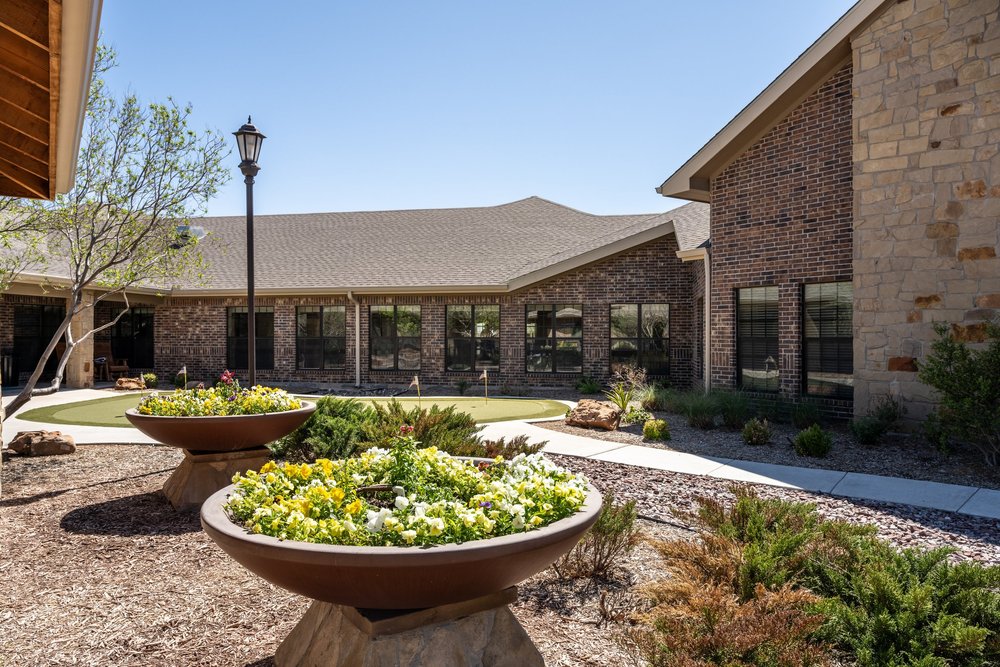
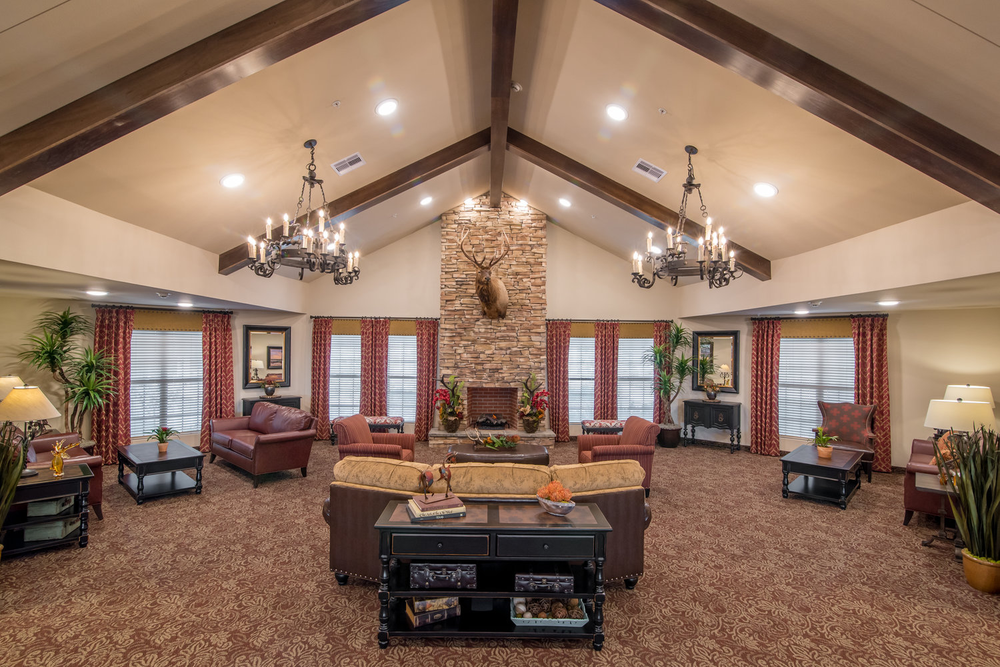
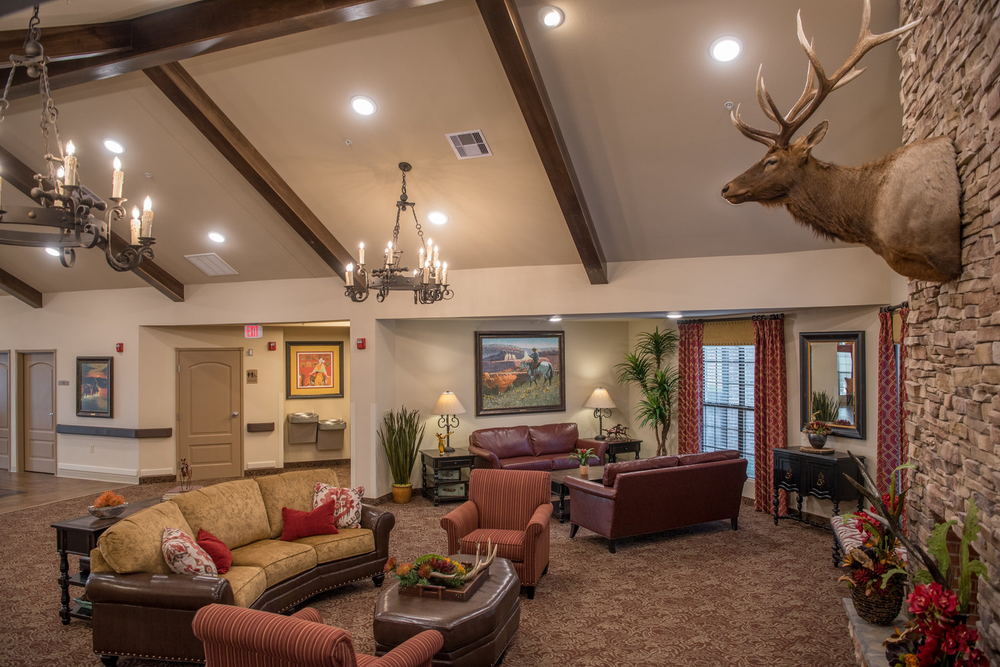
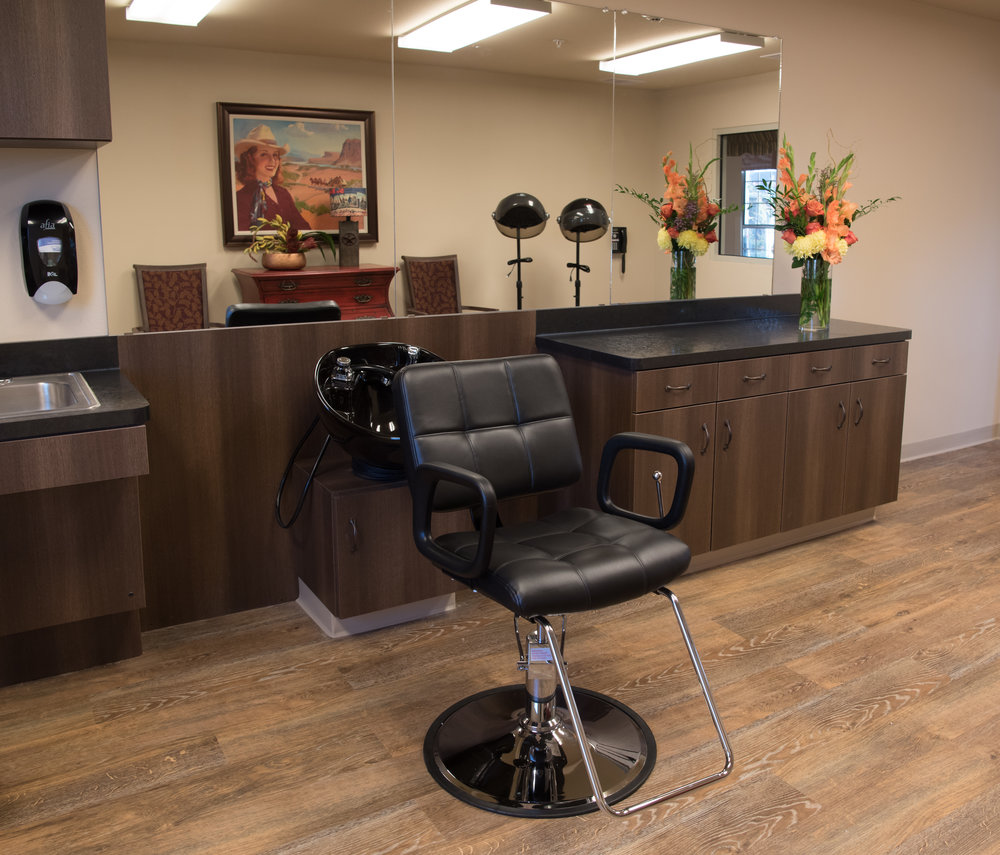
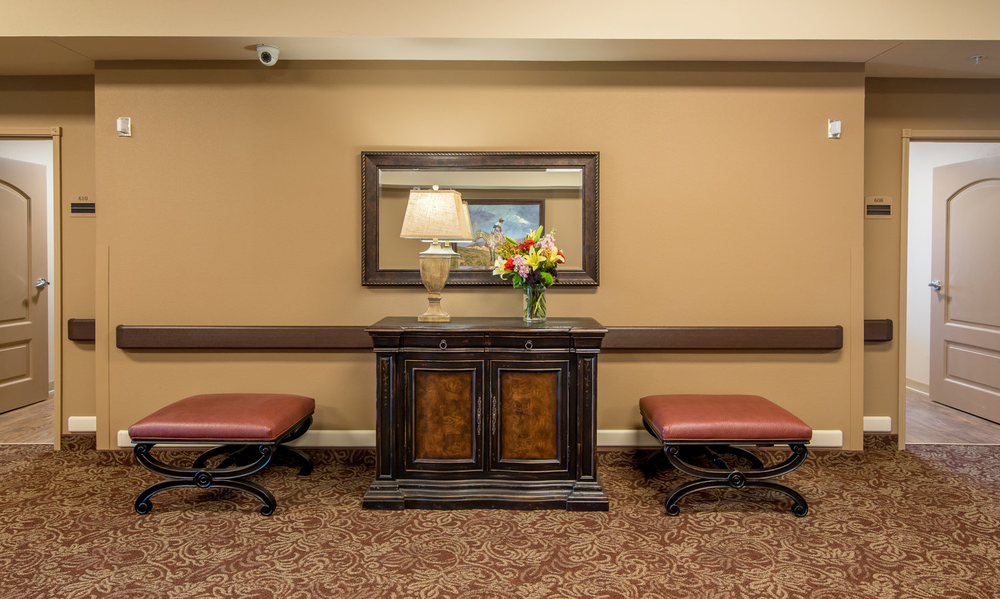
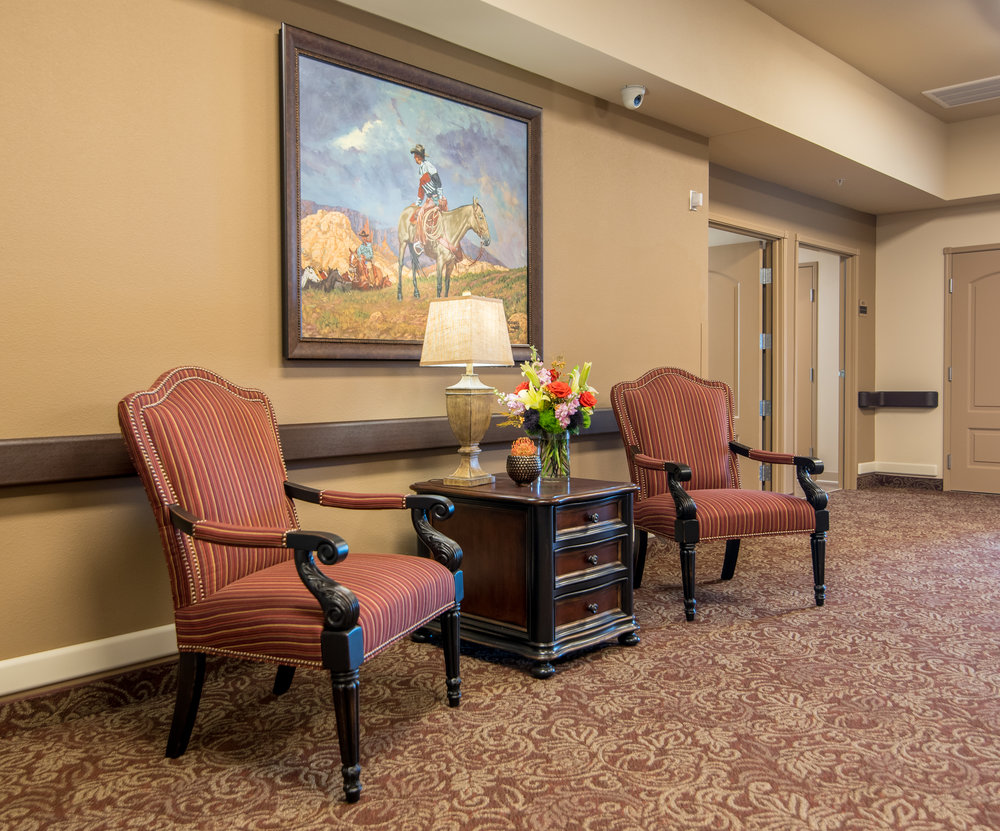
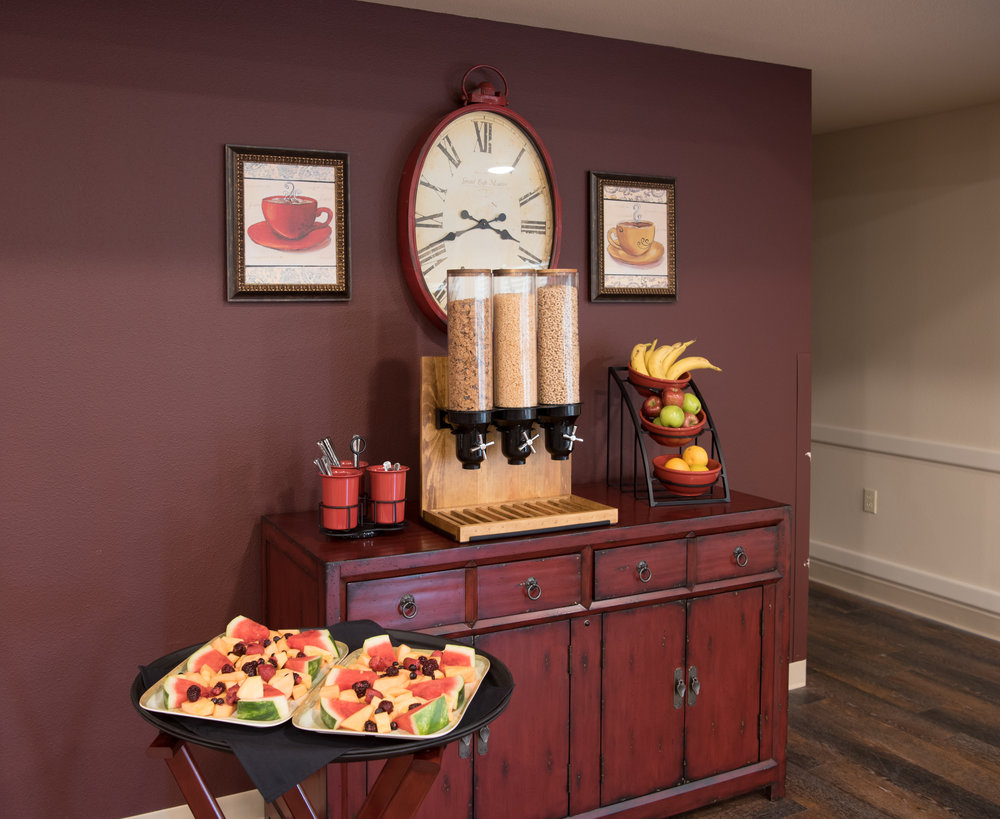
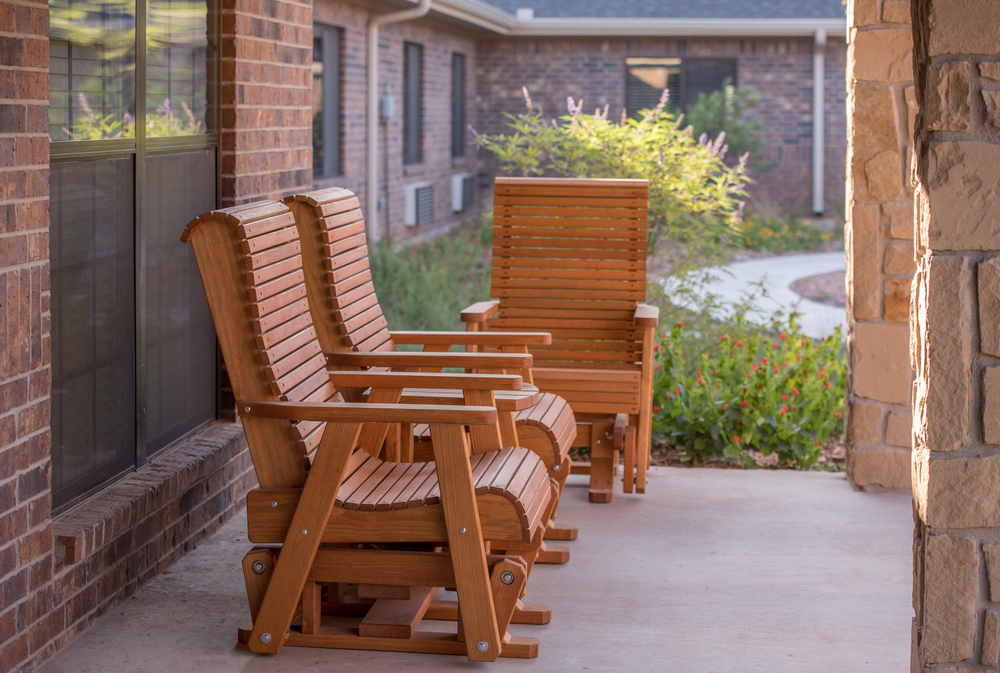
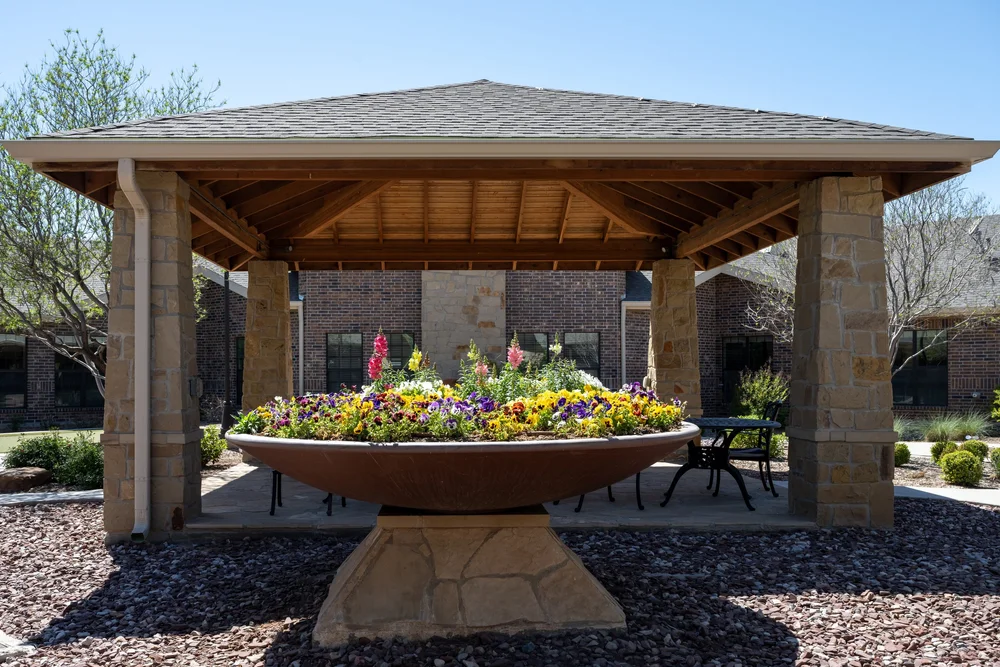
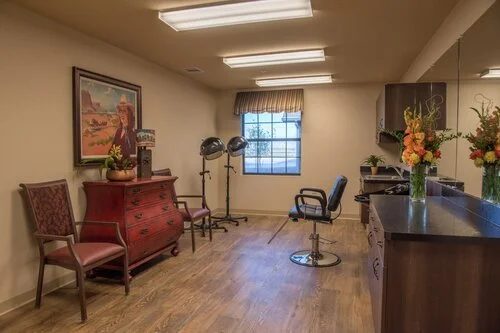
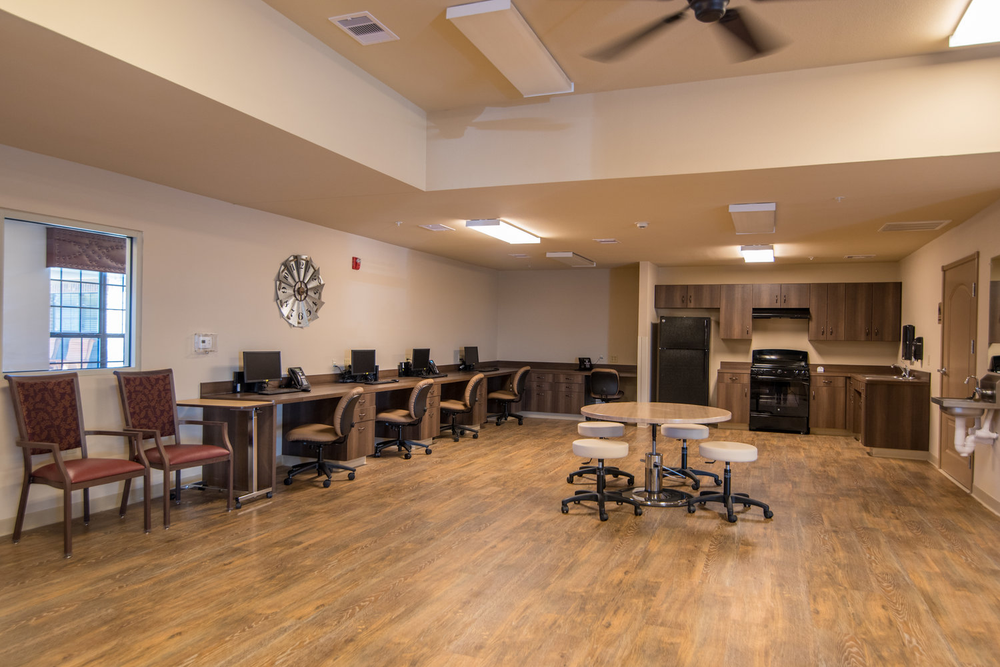
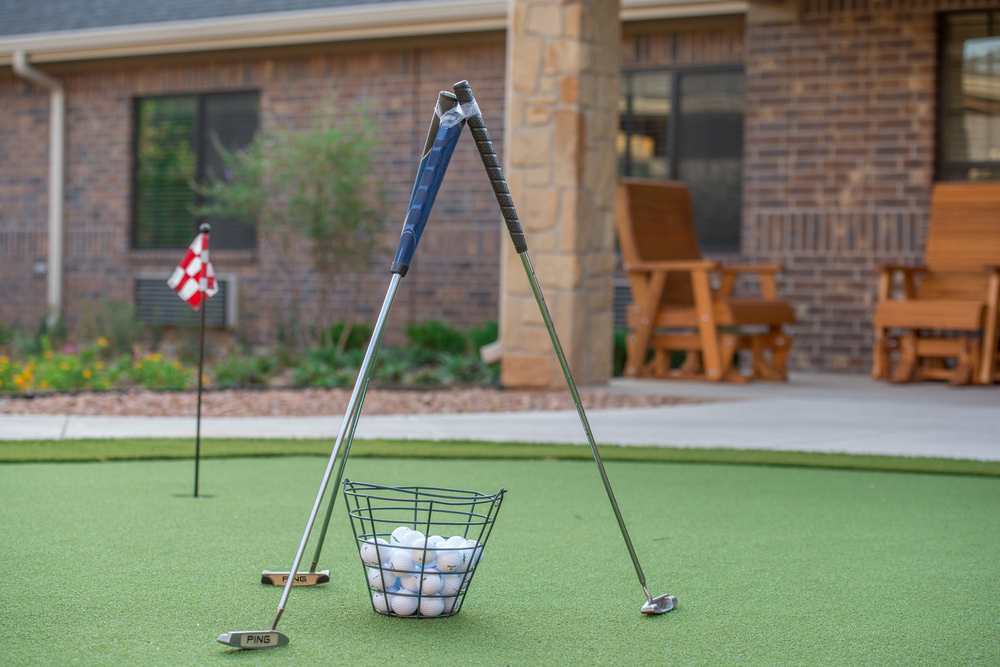
At Ashton Medical Lodge, residents experience a wealth of amenities crafted to provide comfort and joy during their stay. The community’s 24-hour snack bar and tempting meal options cater to culinary desires,  engaging in dynamic social activities and enjoying the serenity of the courtyard with a putting green create moments of joy and connection. this facility also offers practical services, including personal laundry assistance, a barber shop, and beauty salon, ensuring residents can maintain their well-being with ease. Complimentary transportation services further enhance residents’ accessibility to the wider community.

Managed by Broderick Hampton

Administrator

Broderick Hampton serves as the Administrator at Ashton Medical Lodge. He has been a valued part of the community since February 15, 2022, bringing dedicated leadership and care to the facility.

Quality ratings

Measured by Centers for Medicare & Medicaid Services (CMS)

Overall rating Info Official CMS rating based on health inspections, staffing and quality measures.
2/5
Texas average: 3.0/5
Health Inspection Info Official CMS rating based on deficiencies found during state health inspections.
3/5
Texas average: 2.9/5
Staffing Info Official CMS rating based on nurse staffing hours per resident per day.
1/5
Texas average: 2.4/5
Quality Measures Info Official CMS rating based on clinical outcomes for residents.
3/5
Texas average: 4.0/5

Nursing care per resident

Info Average daily nursing hours per resident (adjusted for acuity). Higher values indicate more nursing time per resident.
2h 59m per day

This home provides 21% less nursing time per resident than the Texas average.

Texas average: 3h 46m per day

Staffing hours breakdown

Info Hours of care per resident per day, broken down by staff type. Data from CMS Medicare.
Staff type Facility State avg National avg
Registered Nurse (RN) Info Registered nurse hours per resident per day. 20m per day 21m per day 29m per day

Capacity and availability

Medium-capacity home

Offers a balance of services and community atmosphere.

Total beds 144

This home usually has limited availability

Occupancy is moderate, suggesting balanced demand.

Similar demand to the Texas average
Occupancy rate 89.9%
Residents per day (avg) 123
Occupancy rate
89.9%
Residents per day (avg)
123

Who this home usually serves

TYPE OF STAY

Primarily short stays

Residents typically stay for brief periods, with frequent admissions and discharges throughout the year.

Might be optimal for
Post-acute recovery Temporary care Transitional stays

Breakdown by payment type

Medicare

33% of new residents, usually for short-term rehab.

Typical stay 2 - 3 months

Private pay

64% of new residents, often for short stays.

Typical stay 1 - 2 months

Medicaid

3% of new residents, often for long-term daily care.

Typical stay 8 years

Finances and operations

Governmental community
Operated by state authorities.
Home revenue
$15.5M
Operating deficit
-$482.0K
Governmental community Operated by state authorities.
Home revenue
$15,523,144.00
Operating deficit
$-482,002.00
Payroll costs Info The portion of the home's budget spent on staff, including nurses, caregivers, and other employees who support care and operations.
$4.0M
25.6% of revenue
Other operating costs Info All remaining costs needed to run the home, such as food, utilities, building maintenance, supplies and administrative expenses.
$12.0M
Total costs $16.0M
Bed community size
144-bed community
A larger shared setting that may offer more common spaces and organized community services.
Years in operation
8 years in operation
An established community with some operational experience and growing routines.
Walk Score
Walk Score: 14 / 100
Car-dependent. Most errands require a car, with limited nearby walkable options.

Services

Medicare/medicaid

About this community

Occupancy

Occupancy rate
90%
In line with Texas average
Occupied beds
129 / 144
Average residents 75 per day

License details

Facility type
Nursing
Issuance January 3, 2023
Expiration January 3, 2026
County: MIDLAND

Additional licensing details

License number: 311322
Year opened: 10/10/2017

Ownership & operating entity

Ashton Medical Lodge is administrated by JOHN WILLIAM HIMES.

Management company: FOURSQUARE TEXAS 16, LLC
Owner: MIDLAND COUNTY HOSPITAL DISTRICT
Ownership type: HOSPITAL DISTRICT/AUTHORITY

Type Of Units

Medicare
14 units
Medicaid and Medicare
130 units
Total beds
144 units

Staffing

Key information about the people who lead and staff this community.

Leadership

Care Services

Nursing Services
Rehabilitation Services
Skilled Nursing
Licensed Nurses/CNAs
Short-Term Rehab

Programs & Activities

Specific Programs
Short-Term Rehabilitation, Long Term Care, Wellness at Ashton, Our Facility, Our History, Amenities, Testimonials, Meet The Team, Facility Tour, Photo Gallery, FAQ, Jobs Available, Contact, Payment Portal, Schedule Visit
Operating Hours
Mo 00:00-00:00, Tu 00:00-00:00, We 00:00-00:00, Th 00:00-00:00, Fr 00:00-00:00, Sa 00:00-00:00, Su 00:00-00:00

Types of Care at Ashton Medical Lodge

Skilled Nursing
Contact Ashton Medical Lodge

Health Inspection History

Inspections
Total health inspections 7

Texas average 7.4


Last Health inspection on May 2025

Total health citations 26
Citations per inspection
3.71

Health citations are formal notices following inspections when they fail to comply with safety and care standards.

20 of 26 citations resulted from standard inspections; and 6 of 26 resulted from complaint investigations.

Breakdown of citation severity (last 3 years)
Critical Health citations More info 1
50% better than Texas average

Texas average: 2


Serious Health citations More info 0
100% better than Texas average

Texas average: 0.4

1 critical citation More info Texas average: 2

0 serious citations More info Texas average: 0.4

25 moderate citations More info Texas average: 23

0 minor citations More info Texas average: 0.4
Citations history (last 3 years)
Abuse/Neglect moderate citation May 16, 2025
Corrected

Abuse/Neglect moderate citation May 16, 2025
Corrected

Abuse/Neglect moderate citation May 16, 2025
Corrected

Infection Control moderate citation Feb 06, 2025
Corrected

Compare Nursing Homes around Midland

The information below is reported by the Texas Health and Human Services Commission.
Ashton Medical Lodge
SNF

Nursing Homes 24/7 care needed

Midland (Western Hills)
144
14
BOWERMAN, STEPHEN
89.9%
$16,564,686.00
$3,973,889.00
24%
123
2/5
2.9911
3/5
1/5
3/5
1
26
1
+17%
-18%
+42%

Places of interest near Ashton Medical Lodge

Address 5.1 miles from city center — 1.47 miles to nearest hospital (USPI)

Address 801 S Loop 250 W, Midland, TX 79703

Calculate Travel Distance to Ashton Medical Lodge

Add your location

Address

Staffing Data

Source: CMS Payroll-Based Journal (Q2 2025)

147
Total Staff
147
Employees
0
Contractors
47,685
Total Hours (Quarter)
59
Avg Staff/Day
8.9
Avg Shift (hrs)
Nursing Staff Breakdown
Role Count Avg Shift (hrs) Uses Contractors?
Registered Nurse 13 9.2 No
Licensed Practical Nurse 26 9.4 No
Certified Nursing Assistant 70 9.4 No
Staff by Category
Administration
1 staff
8hs shift avg
Nursing Staff
124 staff
9.3hs shift avg
Physicians & Practitioners
4 staff
6.8hs shift avg
Therapy Services
13 staff
7.4hs shift avg
Activities & Recreation
1 staff
6.8hs shift avg
Social Services
1 staff
7.7hs shift avg
Dietary Services
2 staff
7.8hs shift avg
Other Services
1 staff
8.3hs shift avg
Role Employees Contractors Total Staff Total Hours Days Worked % of Days Avg Shift (hrs)
Certified Nursing Assistant 70 0 70 22,671 91 100% 9.4
Licensed Practical Nurse 26 0 26 7,937 91 100% 9.4
Medication Aide/Technician 11 0 11 3,080 91 100% 8.9
Registered Nurse 13 0 13 2,980 91 100% 9.2
Speech Language Pathologist 6 0 6 2,327 74 81% 7.8
RN Director of Nursing 4 0 4 2,162 80 88% 8.8
Clinical Nurse Specialist 3 0 3 1,308 91 100% 7.3
Physical Therapy Aide 4 0 4 1,170 68 75% 7.4
Respiratory Therapy Technician 2 0 2 525 68 75% 7.7
Nurse Practitioner 1 0 1 523 91 100% 5.8
Administrator 1 0 1 512 64 70% 8
Other Dietary Services Staff 1 0 1 503 63 69% 8
Qualified Social Worker 1 0 1 486 63 69% 7.7
Mental Health Service Worker 1 0 1 464 56 62% 8.3
Dietitian 1 0 1 454 59 65% 7.7
Physical Therapy Assistant 1 0 1 296 56 62% 5.3
Therapeutic Recreation Specialist 1 0 1 287 42 46% 6.8

Facility Characteristics

Source: CMS Long-Term Care Facility Characteristics (Data as of Jan 2026)

Total census
135 residents
Residents by payment source
Medicare
33 residents (24.4%)
Medicaid
74 residents (54.8%)
Private pay or other
28 residents (20.7%)
Programs & Services
Nurse Aide Training

State-approved Nurse Aide Training and Competency Evaluation Program on-site

Quality of care over time

These measures show how residents usually do over time at this home, based on health outcomes and preventive care.

High-risk clinical events score Info A composite score based on pressure ulcers, falls with injury, weight loss, walking ability decline, and activities of daily living decline. 8.4
In line with Texas average

Texas average: 8.6

Functional decline score Info A composite score based on activities of daily living decline, walking ability decline, and incontinence. 18.6
16% worse than Texas average

Texas average: 16.0

Long-stay resident measures
Above average Texas avg: 4.2 Info CMS star rating based on long-stay quality measure performance. 5 stars = significantly above average, 1 star = significantly below average.
Need for Help with Daily Activities Increased Info Percent of long-stay residents whose need for help with daily activities has increased 12.7%
21% better than Texas average

Texas average: 16.2%

Walking Ability Worsened Info Percent of long-stay residents whose ability to move independently worsened 16.3%
In line with Texas average

Texas average: 16.2%

Low Risk Residents with Bowel/Bladder Incontinence Info Percent of low risk long-stay residents who lose control of their bowels or bladder 26.9%
72% worse than Texas average

Texas average: 15.7%

Falls with Major Injury Info Percent of long-stay residents experiencing one or more falls with major injury 5.9%
82% worse than Texas average

Texas average: 3.2%

High Risk Residents with Pressure Ulcers Info Percent of long-stay high risk residents with pressure ulcers 4.0%
10% better than Texas average

Texas average: 4.4%

Urinary Tract Infection Info Percent of long-stay residents with a urinary tract infection 1.4%
73% worse than Texas average

Texas average: 0.8%

Lost Too Much Weight Info Percent of long-stay residents who lose too much weight 3.4%
In line with Texas average

Texas average: 3.5%

Depressive Symptoms Info Percent of long-stay residents who have depressive symptoms 22.7%
691% worse than Texas average

Texas average: 2.9%

Antipsychotic Use Info Percent of long-stay residents who received an antipsychotic medication 0.7%
91% better than Texas average

Texas average: 7.9%

Pneumococcal Vaccine Info Percent of long-stay residents assessed and appropriately given the pneumococcal vaccine 100.0%
In line with Texas average

Texas average: 97.3%

Influenza Vaccine Info Percent of long-stay residents assessed and appropriately given the seasonal influenza vaccine 100.0%
In line with Texas average

Texas average: 97.9%

Hospitalizations per 1,000 days Info Number of hospitalizations per 1,000 long-stay resident days. 2.03
5% better than Texas average

Texas average: 2.13

ED visits per 1,000 days Info Number of outpatient emergency department visits per 1,000 long-stay resident days. 2.17
5% worse than Texas average

Texas average: 2.07

Short-stay resident measures
Average Texas avg: 2.9 Info CMS star rating based on short-stay quality measure performance. 5 stars = much above average, 1 star = much below average.
Pneumococcal Vaccine Info Percent of short-stay residents assessed and appropriately given the pneumococcal vaccine 99.2%
10% better than Texas average

Texas average: 90.4%

Antipsychotic medication increase Info Percent of short-stay residents who newly received an antipsychotic medication 0.0%
100% better than Texas average

Texas average: 1.4%

Influenza Vaccine Info Percent of short-stay residents assessed and appropriately given the seasonal influenza vaccine 97.3%
11% better than Texas average

Texas average: 88.0%

Re-hospitalized after SNF stay Info Percentage of short-stay residents who were re-hospitalized after their nursing home admission. 27.7%
7% worse than Texas average

Texas average: 25.9%

Emergency department visits Info Percentage of short-stay residents who had an outpatient emergency department visit. 19.0%
58% worse than Texas average

Texas average: 12.0%

Falls with major injury Info Percentage of SNF residents who experience falls with major injury during their stay. 2.0%
162% worse than Texas average

Texas average: 0.8%

Ability to care for self at discharge Info Percentage of residents at or above expected ability to care for themselves at discharge. 82.3%
53% better than Texas average

Texas average: 53.7%

Successful return to home or community Info Rate of successful return to home or community from a skilled nursing facility. 43.5%
14% worse than Texas average

Texas average: 50.6%

Penalties and fines

Federal penalties imposed by CMS for regulatory violations, including civil money penalties (fines) and denials of payment for new Medicare/Medicaid admissions.

Source: CMS Penalties Database (Data as of Jan 2026)

Total fines amount $13K
83% lower than Texas average

Texas average: $80K

Number of fines 1
60% fewer fines than Texas average

Texas average: 2.5

Payment Denials Info Serious action where Medicare and/or Medicaid temporarily stops payments for new residents until issues are fixed. 0
100% fewer payment denials than Texas average

Texas average: 0.2

Fines amount comparison
This facility $13K
Texas average $80K
Penalty History

Penalties are imposed by CMS for violations of federal nursing home regulations.

Civil Money Penalty Info Fines imposed for noncompliance, which can be assessed per day or per instance of violation. Dec 21, 2023
$13K

Last updated: Jan 2026

Guides for Better Senior Living

Care Cost Calculator: See Prices in Your Area

Nursing Home Data Explorer

Don’t Wait Too Long: 7 Red Flag Signs Your Parent Needs Assisted Living Now

The True Cost of Assisted Living in 2025 – And How Families Are Paying For It

Understanding Senior Living Costs: Pricing Models, Discounts & Financial Assistance

Financial Aid for Texas Seniors

Get financial aid guidance

Community Care for the Aged and Disabled (CCAD)

TX Medicaid CCAD

Age 65+ or disabled, Texas resident, Medicaid-eligible, care need (not always nursing home level).

~$2,829/month (300% FBR, individual).

$2,000 (individual), $3,000 (couple).

Large state; rural access challenges.

Texas Community Care Services

TX CCS

Age 60+, Texas resident, at risk of decline.

~$2,000/month (individual, varies).

$5,000 (individual).

Limited funding; high demand in urban areas.

Area Agency on Aging (AAA) Services

Texas AAA Services

Age 60+, TX resident; no income/asset limits.

None; donations encouraged.

Not assessed.

28 AAAs; includes Meals on Wheels in some areas.

Medicare Savings Program (MSP)

Texas Medicare Savings Program

Age 65+ or disabled, TX resident, Medicare Part A/B.

~$2,510/month (QMB), ~$3,380/month (SLMB), ~$3,598/month (QI)—individual.

$9,430 (individual), $14,130 (couple).

Includes Extra Help for Part D; no waitlist.

Low-Income Home Energy Assistance Program (LIHEAP)

Texas Comprehensive Energy Assistance Program (CEAP)

Age 60+ prioritized, TX resident, low-income.

~$3,970/month (185% FPL).

Not assessed.

Priority for elderly/disabled; covers gas, electric, propane.

Family Caregiver Support Program (FCSP)

Texas Family Caregiver Support Program

Caregivers of 60+ needing care or 55+ caregivers of others; TX resident; 2+ ADLs.

No strict cap; prioritizes low-income (~$24,980/year).

Not assessed.

High rural demand; includes grandparent caregivers.

Senior Community Service Employment Program (SCSEP)

Texas SCSEP

Age 55+, unemployed, low-income, TX resident.

~$1,983/month (125% FPL).

Not specified.

Priority for veterans, rural residents; AARP partnership.

VA Aid and Attendance (A&A) and Housebound Benefits

Texas VA Aid and Attendance/Housebound

Age 65+ or disabled veteran/spouse, TX resident, wartime service, ADL help (A&A) or homebound.

Net income < ~$1,984/month (veteran with dependent, A&A); pension offsets income.

~$155,356 (net worth).

High veteran population; supports rural/urban needs.

Property Tax Exemption for Seniors

Texas Senior Property Tax Exemption

Age 65+, TX resident, homeowner (homestead).

None; tax-based eligibility.

Not assessed.

$25,000+ exemption; optional freeze in some counties; saves ~$500-$1,000/year.

Senior Farmers’ Market Nutrition Program (SFMNP)

Texas SFMNP

Age 60+, TX resident, low-income.

~$2,322/month (185% FPL).

Not assessed.

Vouchers (~$50/season); serves ~20,000 via 28 AAAs.

Tour Icon
Planning a tour? Check our touring checklist.
Chat Icon
Thinking of living here? We can help you speak to a current resident