Nursing Home

Aurora Health and Rehabilitation

Overview of Aurora Health and Rehabilitation

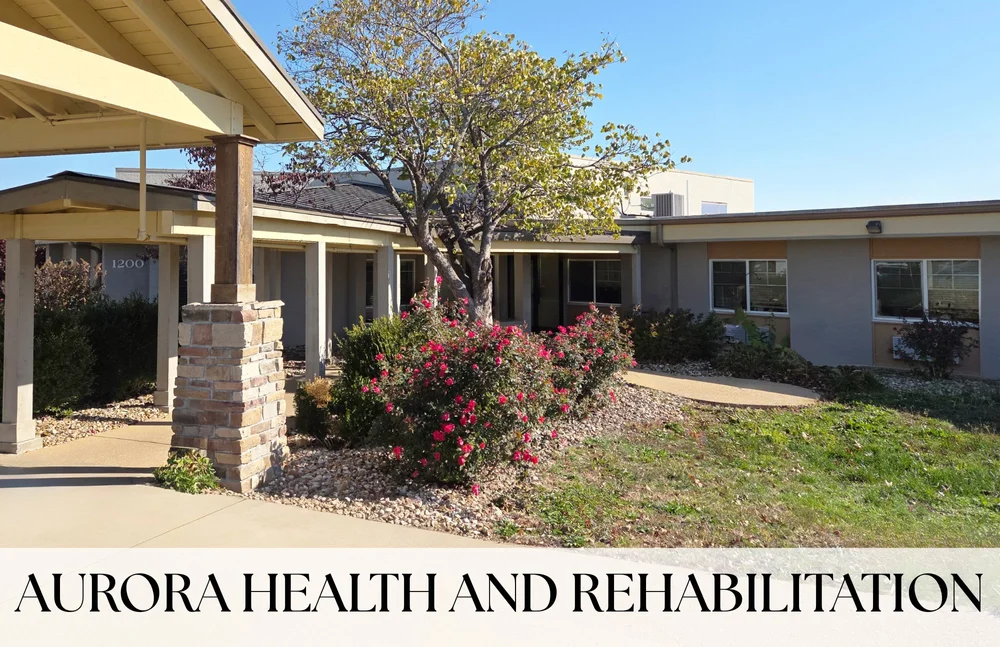
Aurora Health and Rehabilitation is a nursing home in Rolla, MO, offering rehabilitation and skilled nursing. Promoting a home-like atmosphere, the community features comfortable and spacious living areas for older adults’ comfort and familiarity. Exceptional services, including 24-hour support, wound care, and nutritious meals, are also offered to improve residents’ quality of life. The community also goes above and beyond to meet residents’ unique needs and preferences with a multi-disciplinary team and personalized care plans.

Fun events and light exercises provide residents with more opportunities to interact with friends and explore new hobbies. Residents can rest and feel at home, as top-notch amenities like the cafe and country kitchen are also available. Shops, restaurants, and schools are also available in the area, providing residents with quick access to their necessities and leisure. This nursing home is a good option for senior living in Missouri, especially with its commitment to older adults’ welfare.

Quality ratings

Measured by Centers for Medicare & Medicaid Services (CMS)

Overall rating Info Official CMS rating based on health inspections, staffing and quality measures.
1/5
Missouri average: 2.6/5
Health Inspection Info Official CMS rating based on deficiencies found during state health inspections.
2/5
Missouri average: 2.9/5
Staffing Info Official CMS rating based on nurse staffing hours per resident per day.
1/5
Missouri average: 2.2/5
Quality Measures Info Official CMS rating based on clinical outcomes for residents.
4/5
Missouri average: 2.8/5

Nursing care per resident

Info Average daily nursing hours per resident (adjusted for acuity). Higher values indicate more nursing time per resident.
2h 35m per day

This home provides 32% less nursing time per resident than the Missouri average.

Missouri average: 3h 49m per day

Staffing hours breakdown

Info Hours of care per resident per day, broken down by staff type. Data from CMS Medicare.
Staff type Facility State avg National avg
Registered Nurse (RN) Info Registered nurse hours per resident per day. 39m per day 28m per day 41m per day
Nurse Aide Info Nurse aide hours per resident per day. 1h 58m per day 2h 20m per day 2h 21m per day
Total Nursing (Weekend) Info Total number of nurse staff hours per resident per day on weekends. 2h 41m per day 3h 3m per day 3h 26m per day
Physical Therapist Info Physical therapist staff hours per resident per day. 4m per day 2m per day 4m per day
RN (Weekend) Info Registered nurse hours per resident per day on weekends. 32m per day 20m per day 29m per day

Capacity and availability

Medium-capacity home

Offers a balance of services and community atmosphere.

Total beds 116

This home usually has availability

Lower occupancy suggests more openings may be available.

Lower demand than the Missouri average
Occupancy rate 62%
Residents per day (avg) 78
Occupancy rate
62%
Residents per day (avg)
78

Who this home usually serves

TYPE OF STAY

Mostly short-term rehab stays

Most residents typically stay for a few weeks or months before returning home or moving on.

Might be optimal for
Short stays Recovery Medicare-covered care

Breakdown by payment type

Medicare

39% of new residents, usually for short-term rehab.

Typical stay 15 days

Private pay

38% of new residents, often for short stays.

Typical stay 26 days

Medicaid

23% of new residents, often for long-term daily care.

Typical stay 5 - 6 months

Finances and operations

Privately-owned community
Home revenue
$5.8M
Profit
$419.8K
Privately-owned community
Home revenue
$5,806,045.00
Profit
$419,824.00
Payroll costs Info The portion of the home's budget spent on staff, including nurses, caregivers, and other employees who support care and operations.
$2.5M
42.3% of revenue
Other operating costs Info All remaining costs needed to run the home, such as food, utilities, building maintenance, supplies and administrative expenses.
$2.9M
Total costs $5.4M
Bed community size
116-bed community
A larger shared setting that may offer more common spaces and organized community services.

About this community

Occupancy

Occupancy rate
62%
In line with Missouri average
Occupied beds
72 / 116
Average residents 72 per day

License details

Facility type
Snf
County: PHELPS

Additional licensing details

CMS Certification Number: 265844
Certification type: Medicare/Medicaid

Ownership & operating entity

Aurora Health and Rehabilitation is administrated by ELIZABETH KUHN.

Owner name: MCCUTCHEN RD HEALTHCARE LLC

Care Services

Nursing Services
Rehabilitation Services
Licensed Nurses/CNAs
24-Hour Staffing

Programs & Activities

Specific Programs
Clinical Capabilities, Therapy Services, Community Partnerships, Careers
Operating Hours
Open 24 Hours/7 Days A Week
Contact Aurora Health and Rehabilitation

Inspection History

In Missouri, the Department of Health and Senior Services, Division of Regulation and Licensure performs the inspections and unannounced surveys required for all long-term care providers.

Health Inspection History

Inspections
Total health inspections 11

Missouri average 6.6


Last Health inspection on Jul 2025

Total health citations 59
Citations per inspection
5.36

Health citations are formal notices following inspections when they fail to comply with safety and care standards.

44 of 59 citations resulted from standard inspections; 14 of 59 resulted from complaint investigations; and 1 of 59 came from combined inspections (standard and complaint).

Breakdown of citation severity (last 3 years)
Critical Health citations More info 2
186% worse than Missouri average

Missouri average: 0.7


Serious Health citations More info 0
100% better than Missouri average

Missouri average: 1

2 critical citations More info Missouri average: 0.7

0 serious citations More info Missouri average: 1

50 moderate citations More info Missouri average: 33.6

7 minor citations More info Missouri average: 1.2
Citations history (last 3 years)
Resident Rights moderate citation Jul 02, 2025
Corrected

Quality of Care moderate citation Mar 20, 2025
Corrected

Resident Rights moderate citation Mar 20, 2025
Corrected

Resident Rights moderate citation Mar 20, 2025
Corrected

Compare Nursing Homes around Rolla

The information below is reported by the Missouri Department of Health and Senior Services, Division of Regulation and Licensure.
Aurora Health and Rehabilitation
SNF

Nursing Home 24/7 care needed

AL

Assisted Living For seniors needing help with daily tasks but not full-time nursing.

MO 65401-2615
116
ALIPOUR, IRAJ
62.0%
$5,805,545.00
$2,455,586.00
42.3%
78
1/5
2.5801
2/5
1/5
4/5
6
59
2
+44%
-31%
-7%
Cedar Pointe
SNF

Nursing Home 24/7 care needed

AL

Assisted Living For seniors needing help with daily tasks but not full-time nursing.

MO 65401-2044
102
ROLLA GRAND LLC
68.5%
$4,812,143.00
$2,660,780.00
55.3%
65
1/5
3.3569
2/5
1/5
1/5
1
40
1
-12%
-10%
+3%

Places of interest near Aurora Health and Rehabilitation

Address 0.0 miles from city center

Address ROLLA, MO 65401-2615

Calculate Travel Distance to Aurora Health and Rehabilitation

Add your location

Address

Staffing Data

Source: CMS Payroll-Based Journal (Q2 2025)

106
Total Staff
101
Employees
5
Contractors
27,145
Total Hours (Quarter)
36
Avg Staff/Day
8.3
Avg Shift (hrs)
Nursing Staff Breakdown
Role Count Avg Shift (hrs) Uses Contractors?
Registered Nurse 12 9.5 No
Licensed Practical Nurse 12 9.3 No
Certified Nursing Assistant 48 8.8 No
Staff by Category
Administration
2 staff
7.1hs shift avg
Nursing Staff
81 staff
8.8hs shift avg
Physicians & Practitioners
3 staff
8hs shift avg
Therapy Services
13 staff
6.5hs shift avg
Activities & Recreation
3 staff
6.4hs shift avg
Social Services
1 staff
6.9hs shift avg
Dietary Services
2 staff
6.9hs shift avg
Other Services
1 staff
8hs shift avg
Contractor Analysis
4.1%
of total hours from contractors
1,124 contractor hours this quarter
Qualified Social Worker: 1 Physical Therapy Aide: 1 Respiratory Therapy Technician: 1 Medical Director: 1 Occupational Therapy Assistant: 1
Role Employees Contractors Total Staff Total Hours Days Worked % of Days Avg Shift (hrs)
Certified Nursing Assistant 48 0 48 11,369 91 100% 8.8
Registered Nurse 12 0 12 3,241 91 100% 9.5
Licensed Practical Nurse 12 0 12 3,228 87 96% 9.3
Medication Aide/Technician 8 0 8 3,117 91 100% 8.6
Physical Therapy Aide 3 1 4 778 66 73% 6.5
Therapeutic Recreation Specialist 3 0 3 669 58 64% 6.4
Other Dietary Services Staff 2 0 2 658 61 67% 6.9
Clinical Nurse Specialist 2 0 2 632 64 70% 8
Administrator 1 0 1 520 65 71% 8
Nurse Practitioner 1 0 1 496 62 68% 8
Mental Health Service Worker 1 0 1 472 59 65% 8
Speech Language Pathologist 2 0 2 452 57 63% 7.9
Respiratory Therapy Technician 2 1 3 395 60 66% 6.3
Physical Therapy Assistant 2 0 2 387 58 64% 6.5
Qualified Social Worker 0 1 1 366 53 58% 6.9
Occupational Therapy Aide 1 0 1 171 32 35% 5.3
RN Director of Nursing 1 0 1 133 39 43% 3.4
Occupational Therapy Assistant 0 1 1 33 10 11% 3.3
Medical Director 0 1 1 30 12 13% 2.5

Facility Characteristics

Source: CMS Long-Term Care Facility Characteristics (Data as of Jan 2026)

Total census
83 residents
Residents by payment source
Medicare
9 residents (10.8%)
Medicaid
49 residents (59%)
Private pay or other
25 residents (30.1%)
Programs & Services
Residents' Group

Residents meet regularly to discuss policies, care quality, and activities

Nurse Aide Training

State-approved Nurse Aide Training and Competency Evaluation Program on-site

Active Resident Council

Organized group of residents that meets regularly to discuss facility policies, quality of life, and activities.

Quality of care over time

These measures show how residents usually do over time at this home, based on health outcomes and preventive care.

High-risk clinical events score Info A composite score based on pressure ulcers, falls with injury, weight loss, walking ability decline, and activities of daily living decline. 2.3
79% better than Missouri average

Missouri average: 10.9

Functional decline score Info A composite score based on activities of daily living decline, walking ability decline, and incontinence. 9.9
49% better than Missouri average

Missouri average: 19.5

Long-stay resident measures
Significantly above average Missouri avg: 3.1 Info CMS star rating based on long-stay quality measure performance. 5 stars = significantly above average, 1 star = significantly below average.
Need for Help with Daily Activities Increased Info Percent of long-stay residents whose need for help with daily activities has increased 2.6%
87% better than Missouri average

Missouri average: 19.8%

Walking Ability Worsened Info Percent of long-stay residents whose ability to move independently worsened 3.8%
81% better than Missouri average

Missouri average: 20.6%

Low Risk Residents with Bowel/Bladder Incontinence Info Percent of low risk long-stay residents who lose control of their bowels or bladder 23.1%
28% worse than Missouri average

Missouri average: 18.1%

Falls with Major Injury Info Percent of long-stay residents experiencing one or more falls with major injury 0.8%
81% better than Missouri average

Missouri average: 4.0%

High Risk Residents with Pressure Ulcers Info Percent of long-stay high risk residents with pressure ulcers 2.5%
50% better than Missouri average

Missouri average: 5.0%

Urinary Tract Infection Info Percent of long-stay residents with a urinary tract infection 0.0%
100% better than Missouri average

Missouri average: 2.7%

Lost Too Much Weight Info Percent of long-stay residents who lose too much weight 1.7%
69% better than Missouri average

Missouri average: 5.6%

Depressive Symptoms Info Percent of long-stay residents who have depressive symptoms 58.7%
357% worse than Missouri average

Missouri average: 12.8%

Antipsychotic Use Info Percent of long-stay residents who received an antipsychotic medication 19.4%
12% better than Missouri average

Missouri average: 22.0%

Pneumococcal Vaccine Info Percent of long-stay residents assessed and appropriately given the pneumococcal vaccine 64.0%
25% worse than Missouri average

Missouri average: 85.2%

Influenza Vaccine Info Percent of long-stay residents assessed and appropriately given the seasonal influenza vaccine 83.1%
9% worse than Missouri average

Missouri average: 90.9%

Hospitalizations per 1,000 days Info Number of hospitalizations per 1,000 long-stay resident days. 0.88
58% better than Missouri average

Missouri average: 2.08

ED visits per 1,000 days Info Number of outpatient emergency department visits per 1,000 long-stay resident days. 2.11
10% better than Missouri average

Missouri average: 2.35

Short-stay resident measures
Below average Missouri avg: 2.6 Info CMS star rating based on short-stay quality measure performance. 5 stars = much above average, 1 star = much below average.
Pneumococcal Vaccine Info Percent of short-stay residents assessed and appropriately given the pneumococcal vaccine 27.9%
58% worse than Missouri average

Missouri average: 66.6%

Antipsychotic medication increase Info Percent of short-stay residents who newly received an antipsychotic medication 0.0%
100% better than Missouri average

Missouri average: 2.2%

Influenza Vaccine Info Percent of short-stay residents assessed and appropriately given the seasonal influenza vaccine 27.4%
57% worse than Missouri average

Missouri average: 63.5%

Re-hospitalized after SNF stay Info Percentage of short-stay residents who were re-hospitalized after their nursing home admission. 28.5%
13% worse than Missouri average

Missouri average: 25.3%

Emergency department visits Info Percentage of short-stay residents who had an outpatient emergency department visit. 23.6%
76% worse than Missouri average

Missouri average: 13.4%

Falls with major injury Info Percentage of SNF residents who experience falls with major injury during their stay. 0.0%
100% better than Missouri average

Missouri average: 0.8%

Ability to care for self at discharge Info Percentage of residents at or above expected ability to care for themselves at discharge. 26.3%
51% worse than Missouri average

Missouri average: 53.7%

Successful return to home or community Info Rate of successful return to home or community from a skilled nursing facility. 54.9%
9% better than Missouri average

Missouri average: 50.6%

Penalties and fines

Federal penalties imposed by CMS for regulatory violations, including civil money penalties (fines) and denials of payment for new Medicare/Medicaid admissions.

Source: CMS Penalties Database (Data as of Jan 2026)

Total fines amount $65K
11% lower than Missouri average

Missouri average: $73K

Number of fines 6
146% more fines than Missouri average

Missouri average: 2.4

Payment Denials Info Serious action where Medicare and/or Medicaid temporarily stops payments for new residents until issues are fixed. 0
100% fewer payment denials than Missouri average

Missouri average: 0.7

Fines amount comparison
This facility $65K
Missouri average $73K
Penalty History

Penalties are imposed by CMS for violations of federal nursing home regulations.

Civil Money Penalty Info Fines imposed for noncompliance, which can be assessed per day or per instance of violation. Jun 28, 2024
$14K
Civil Money Penalty Info Fines imposed for noncompliance, which can be assessed per day or per instance of violation. Sep 25, 2023
$5K
Civil Money Penalty Info Fines imposed for noncompliance, which can be assessed per day or per instance of violation. Sep 5, 2023
$14K
Civil Money Penalty Info Fines imposed for noncompliance, which can be assessed per day or per instance of violation. Jul 31, 2023
$14K

Last updated: Jan 2026

Guides for Better Senior Living

Care Cost Calculator: See Prices in Your Area

Nursing Home Data Explorer

Don’t Wait Too Long: 7 Red Flag Signs Your Parent Needs Assisted Living Now

The True Cost of Assisted Living in 2025 – And How Families Are Paying For It

Understanding Senior Living Costs: Pricing Models, Discounts & Financial Assistance

Financial Aid for Missouri Seniors

Get financial aid guidance

Aged and Disabled Waiver

Missouri Medicaid A&D Waiver

Age 65+ or disabled, Missouri resident, Medicaid- eligible, nursing home-level care need.

~$2,829/month (300% FBR, individual).

$2,000 (individual), $3,000 (couple).

Rural access prioritized.

Missouri Supplemental Nursing Care (SNC)

MO SNC

Age 65+, Missouri resident, in approved facility.

~$1,215/month (individual).

$2,000 (individual).

Supplements SSI; facility-based only.

Structured Family Caregiving Waiver (SFCW)

Missouri Structured Family Caregiving Waiver

Age 65+, Missouri resident, MO HealthNet-eligible, NFLOC, dementia diagnosis, live with caregiver.

~$2,901/month (300% FBR, individual); QIT required.

$5,909.25 (individual), $11,818.45 (couple).

Caregiver must be family; small program size.

MO HealthNet Aged, Blind, and Disabled (ABD)

Missouri MO HealthNet ABD

Age 65+ or disabled, Missouri resident, MO HealthNet-eligible, needs help with 1+ ADL.

~$1,690/month (individual, projected); spenddown allowed.

$5,909.25 (individual), $11,818.45 (couple).

Less intensive than waivers; statewide access.

Medicare Savings Program (MSP)

Missouri Medicare Savings Program

Age 65+ or disabled, Missouri resident, Medicare Part A/B.

~$2,510/month (QMB), ~$3,380/month (SLMB), ~$3,598/month (QI)—individual.

$9,430 (individual), $14,130 (couple).

Three tiers; no waitlist; includes Extra Help for Part D.

Missouri Caregiver Program (Customized Caregiver Training & Relief)

Missouri Caregiver Program

Caregivers of 60+ with dementia, Missouri resident, functional needs (2+ ADLs).

No strict cap; prioritizes low-income (~$24,980/year individual).

Not assessed; need-based.

Administered via AAAs and Alzheimer’s Association; rural focus.

Senior Community Service Employment Program (SCSEP)

Missouri SCSEP

Age 55+, unemployed, low-income, Missouri resident.

~$1,983/month (125% FPL).

Not specified; income-focused.

Priority for veterans, rural residents; AARP partnership.

VA Aid and Attendance (A&A) and Housebound Benefits

Missouri VA Aid and Attendance/Housebound

Age 65+ or disabled veteran/spouse, Missouri resident, wartime service, need for ADL help (A&A) or homebound.

Net income < ~$1,984/month (veteran with dependent, A&A); pension offsets income.

~$155,356 (net worth limit).

High veteran demand in rural/urban areas.