

Total health inspections
3
Maryland average 3.9
Last Health inspection on Mar 2024

We arrange tours, appointments, and even moving support so you don’t have to

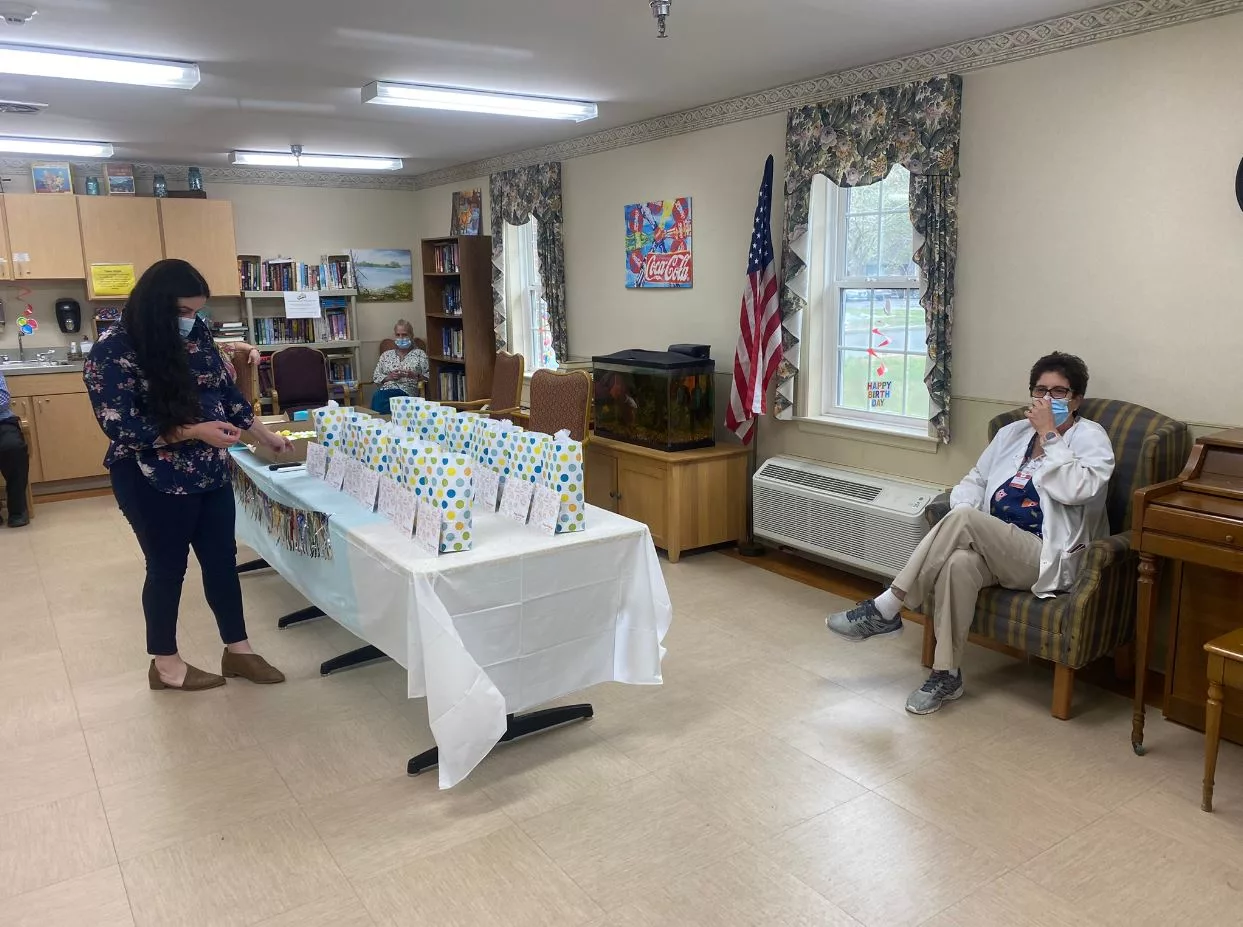
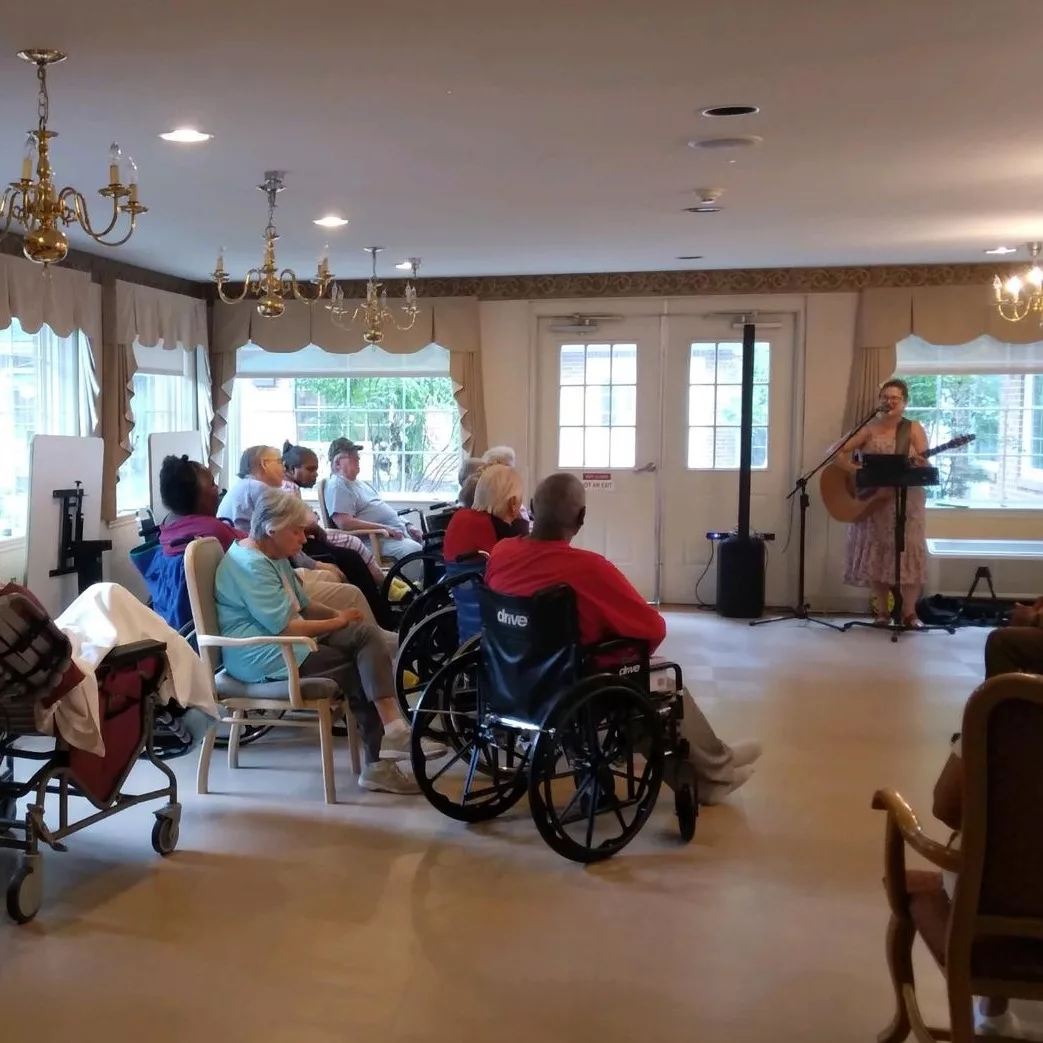
Tucked in the historic town of Cambridge, Maryland, Autumn Lake Healthcare at Chesapeake Woods offers seniors an idyllic retreat with a vibrant, active community. This home provides a spectrum of services, including subacute rehabilitation, skilled nursing, and long-term care nursing home options, tailored to individual needs.
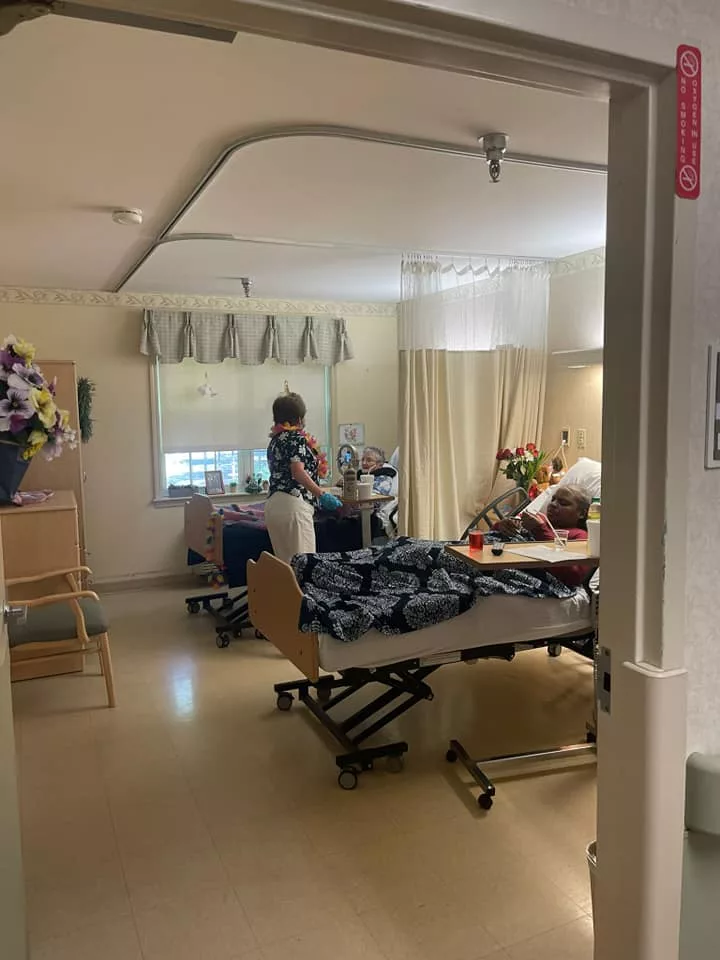
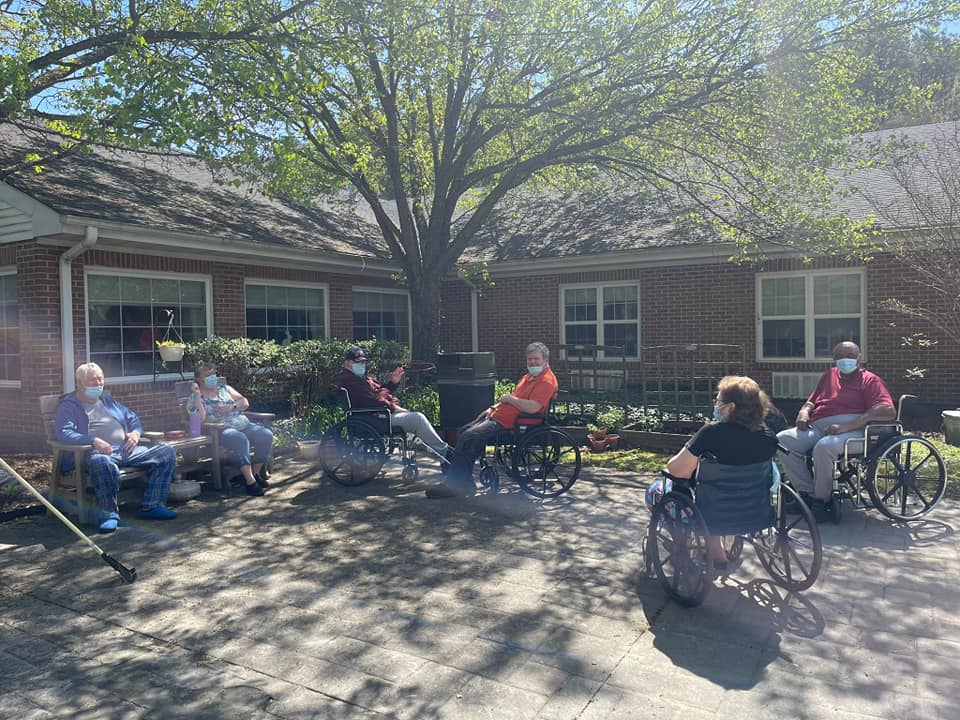
In addition to specialized care such as IV therapy, stroke recovery, colostomy care, podiatry services, and bariatric patient support, Autumn Lake Healthcare at Chesapeake Woods is mindful of nursing home prices. They strive to provide a comprehensive and affordable solution for seniors as they accept a variety of insurances. Alongside modern amenities like Wi-Fi and cable, residents can choose between private and semi-private rooms, with inviting outdoor spaces for relaxation and socialization. This center truly embodies the essence of a supportive and engaging environment for its residents.
Autumn Lake Healthcare at Chesapeake Woods is an independently owned and operated healthcare center that is licensed to use the Autumn Lake Healthcare name and receive non-healthcare related services. All healthcare-related services are provided solely by Autumn Lake Healthcare at Chesapeake Woods.
 Official CMS rating based on health inspections, staffing and quality measures.
Official CMS rating based on deficiencies found during state health inspections.
Official CMS rating based on nurse staffing hours per resident per day.
Official CMS rating based on clinical outcomes for residents.
Average daily nursing hours per resident (adjusted for acuity). Higher values indicate more nursing time per resident.
Hours of care per resident per day, broken down by staff type. Data from CMS Medicare.
Registered nurse hours per resident per day.
Licensed Practical Nurse / Licensed Vocational Nurse hours per resident per day.
Nurse aide hours per resident per day.
Total number of nurse staff hours per resident per day on weekends.
Physical therapist staff hours per resident per day.
Registered nurse hours per resident per day on weekends.
Official CMS rating based on health inspections, staffing and quality measures.
Official CMS rating based on deficiencies found during state health inspections.
Official CMS rating based on nurse staffing hours per resident per day.
Official CMS rating based on clinical outcomes for residents.
Average daily nursing hours per resident (adjusted for acuity). Higher values indicate more nursing time per resident.
Hours of care per resident per day, broken down by staff type. Data from CMS Medicare.
Registered nurse hours per resident per day.
Licensed Practical Nurse / Licensed Vocational Nurse hours per resident per day.
Nurse aide hours per resident per day.
Total number of nurse staff hours per resident per day on weekends.
Physical therapist staff hours per resident per day.
Registered nurse hours per resident per day on weekends.
May offer a more intimate, personalized care environment.
Occupancy is moderate, suggesting balanced demand.
Most residents typically stay for a few weeks or months before returning home or moving on.
67% of new residents, usually for short-term rehab.
17% of new residents, often for short stays.
16% of new residents, often for long-term daily care.
The portion of the home's budget spent on staff, including nurses, caregivers, and other employees who support care and operations.
All remaining costs needed to run the home, such as food, utilities, building maintenance, supplies and administrative expenses.
Nursing Home 24/7 care needed
Assisted Living For seniors needing help with daily tasks but not full-time nursing.
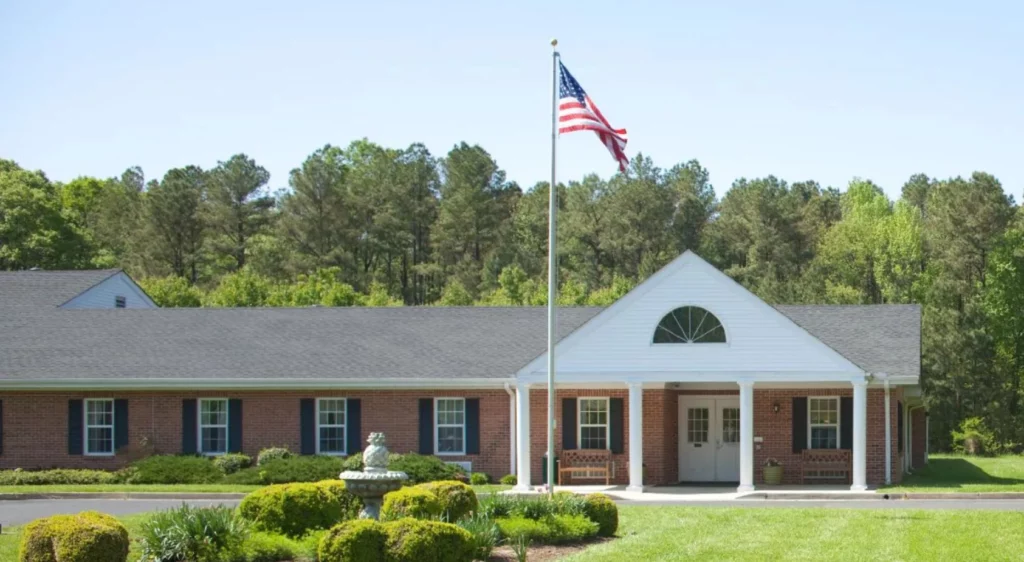 Autumn Lake Healthcare at Chesapeake Woods
![]() 1.6 miles from city center — 1.75 miles to nearest hospital (DaVita Cambridge Dialysis Center)
1.6 miles from city center — 1.75 miles to nearest hospital (DaVita Cambridge Dialysis Center)
![]() 525 Glenburn Ave, Cambridge, MD 21613
525 Glenburn Ave, Cambridge, MD 21613
Add your location
Source: CMS Payroll-Based Journal (Q2 2025)
| Role ⓘ | Count ⓘ | Avg Shift (hrs) ⓘ | Uses Contractors? ⓘ |
|---|---|---|---|
| Registered Nurse | 17 | 9.4 | Yes |
| Licensed Practical Nurse | 14 | 8.7 | Yes |
| Certified Nursing Assistant | 87 | 8 | Yes |
| Role ⓘ | Employees ⓘ | Contractors ⓘ | Total Staff ⓘ | Total Hours ⓘ | Days Worked ⓘ | % of Days ⓘ | Avg Shift (hrs) ⓘ |
|---|---|---|---|---|---|---|---|
| Certified Nursing Assistant | 48 | 39 | 87 | 23,718 | 91 | 100% | 8 |
| Licensed Practical Nurse | 9 | 5 | 14 | 4,876 | 91 | 100% | 8.7 |
| Registered Nurse | 4 | 13 | 17 | 3,508 | 91 | 100% | 9.4 |
| Clinical Nurse Specialist | 3 | 0 | 3 | 1,450 | 65 | 71% | 8.3 |
| Other Social Services Staff | 3 | 0 | 3 | 1,423 | 90 | 99% | 7.6 |
| RN Director of Nursing | 2 | 0 | 2 | 965 | 66 | 73% | 7.9 |
| Physical Therapy Aide | 0 | 4 | 4 | 888 | 65 | 71% | 7 |
| Speech Language Pathologist | 0 | 2 | 2 | 630 | 65 | 71% | 5.9 |
| Administrator | 1 | 0 | 1 | 504 | 63 | 69% | 8 |
| Respiratory Therapy Technician | 0 | 2 | 2 | 500 | 70 | 77% | 7.1 |
| Qualified Social Worker | 0 | 1 | 1 | 497 | 62 | 68% | 8 |
| Mental Health Service Worker | 1 | 0 | 1 | 488 | 60 | 66% | 8.1 |
| Other Dietary Services Staff | 1 | 0 | 1 | 473 | 63 | 69% | 7.5 |
| Nurse Practitioner | 1 | 0 | 1 | 440 | 55 | 60% | 8 |
| Physical Therapy Assistant | 0 | 3 | 3 | 282 | 49 | 54% | 5.8 |
| Medical Director | 1 | 0 | 1 | 112 | 14 | 15% | 8 |
| Occupational Therapy Assistant | 1 | 0 | 1 | 56 | 14 | 15% | 4 |
Maryland average 3.9
Last Health inspection on Mar 2024
Health citations are formal notices following inspections when they fail to comply with safety and care standards.
32 of 40 citations resulted from standard inspections; 6 of 40 resulted from complaint investigations; and 2 of 40 came from combined inspections (standard and complaint).
Maryland average: 0.5
Maryland average: 0.6
Data sourced from CMS Health Deficiencies reports. Citation severity codes range from A (least serious) to L (most serious). Immediate Jeopardy (J-L) citations indicate situations where the facility's noncompliance has placed residents at risk of death or serious harm.
Source: CMS Long-Term Care Facility Characteristics (Data as of Jan 2026)
Active councils help families stay involved in care decisions and facility operations.
These measures show how residents usually do over time at this home, based on health outcomes and preventive care.
Maryland average: 12.9
Maryland average: 25.7
Maryland average: 23.7%
Maryland average: 27.7%
Maryland average: 25.9%
Maryland average: 2.3%
Maryland average: 6.5%
Maryland average: 1.6%
Maryland average: 5.8%
Maryland average: 20.2%
Maryland average: 12.9%
Maryland average: 92.0%
Maryland average: 96.6%
Maryland average: 1.32
Maryland average: 1.21
Maryland average: 78.4%
Maryland average: 1.4%
Maryland average: 80.6%
Maryland average: 21.2%
Maryland average: 9.9%
Maryland average: 0.8%
Maryland average: 53.7%
Maryland average: 50.6%
Quality measures are calculated from Minimum Data Set (MDS) assessments. For most measures, lower percentages indicate better care quality.
Federal penalties imposed by CMS for regulatory violations, including civil money penalties (fines) and denials of payment for new Medicare/Medicaid admissions.
Source: CMS Penalties Database (Data as of Jan 2026)
Maryland average: $61K
Maryland average: 1.5
Maryland average: 0.1
Penalties are imposed by CMS for violations of federal nursing home regulations.
Last updated: Jan 2026
Historical financial and operational data for Autumn Lake Healthcare at Chesapeake Woods based on CMS SNF Cost Reports.
Loading trend charts...
Care Cost Calculator: See Prices in Your Area
Nursing Home Data Explorer
Don’t Wait Too Long: 7 Red Flag Signs Your Parent Needs Assisted Living Now
The True Cost of Assisted Living in 2025 – And How Families Are Paying For It
Understanding Senior Living Costs: Pricing Models, Discounts & Financial Assistance
We help families find affordable senior communities and unlock same day discounts, Medicaid, and Medicare options tailored to your needs.
Contact us Today
Touring a community? Use this expert-backed checklist to stay organized, ask the right questions, and find the perfect fit.
We'll send you a PDF version of the touring checklist.


