Avamere Rehabilitation at Ridgemont

Nursing Home
Overview of Avamere Rehabilitation at Ridgemont

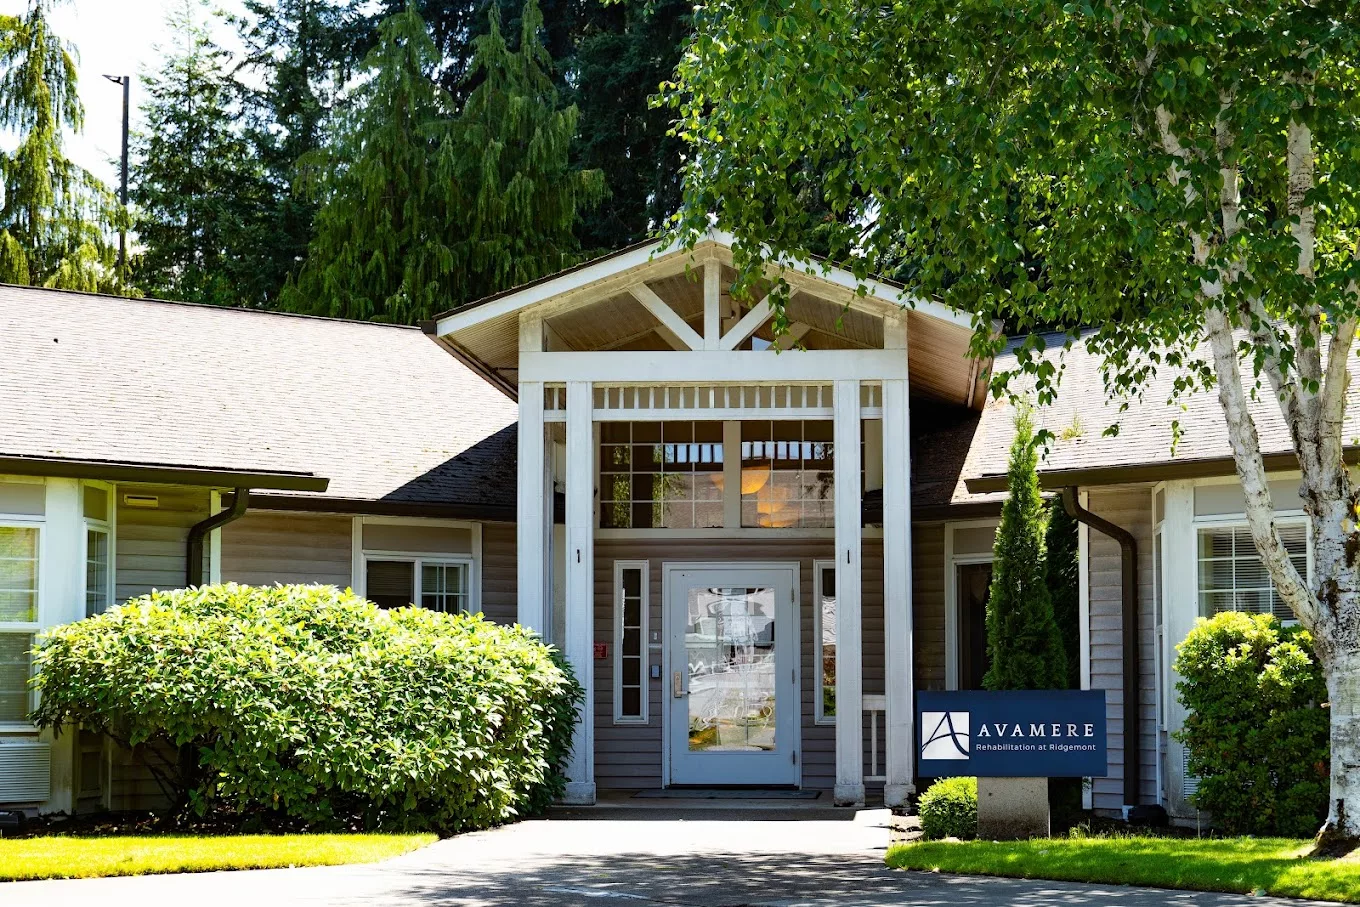
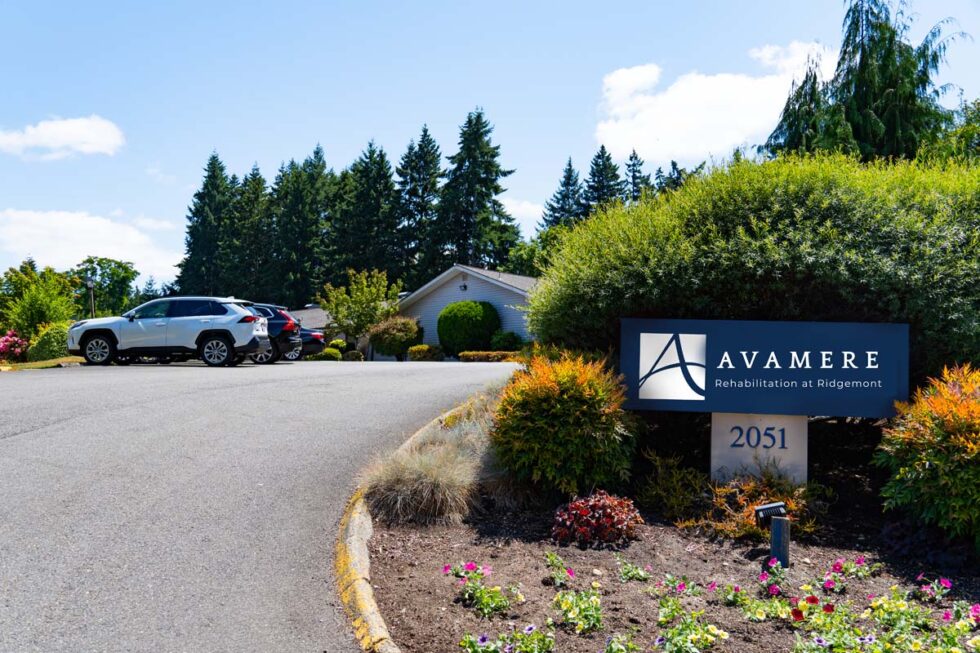
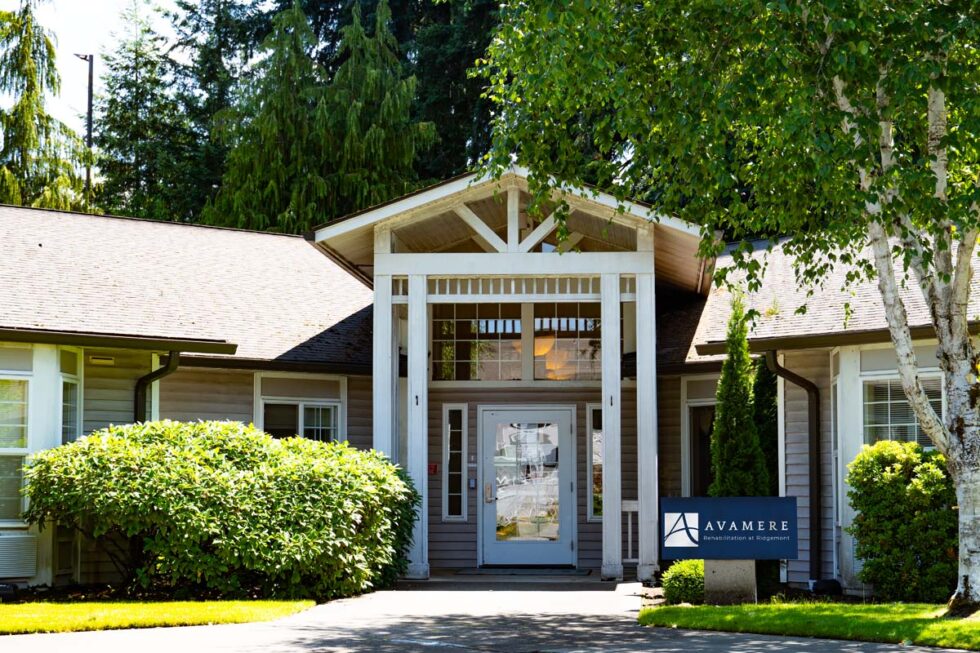
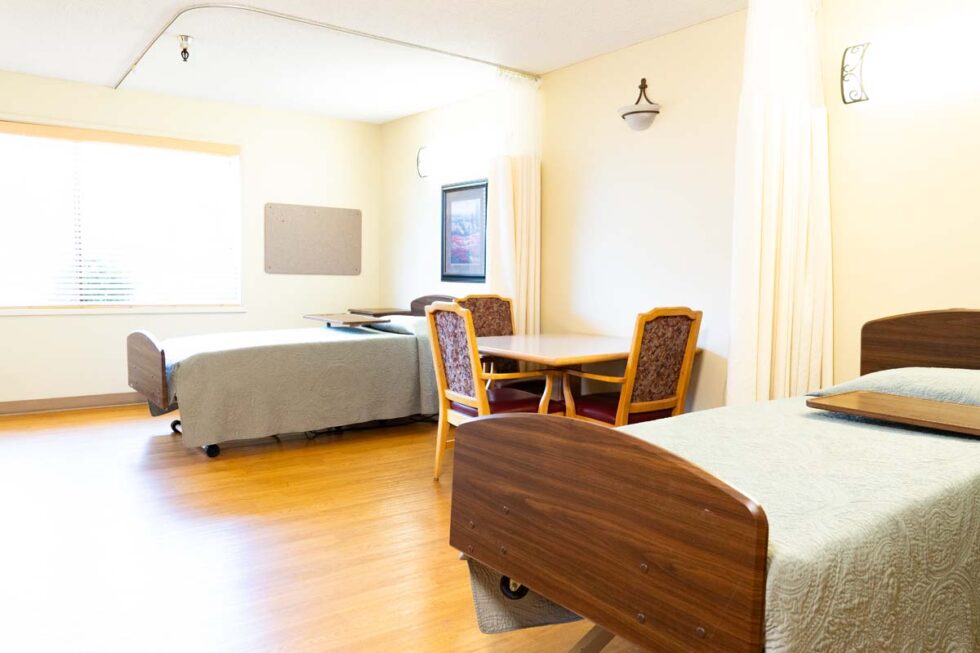
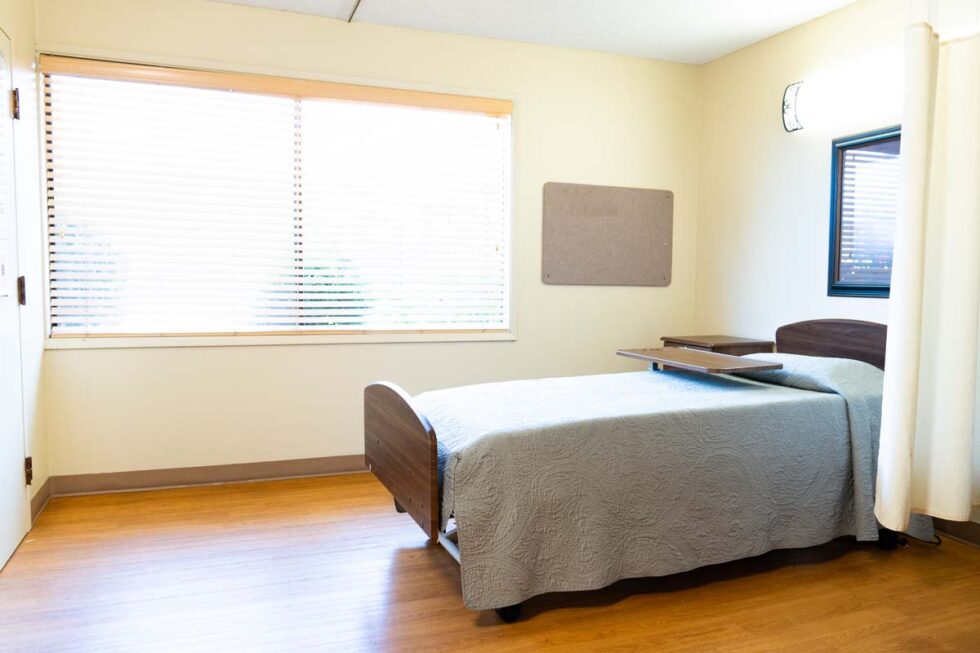
The Villas at Ridgemont is an Independent-Living community in the Avamere Living network of facilities. Sharing a parking lot with Avamere Rehabilitation at Ridgemont, The Villas offers high-quality senior living in the Port Orchard area, with easy access to higher levels of care. The staff at The Villas makes sure each resident has the freedom to live the life they choose, with a variety of community programs each month and top-quality customer service.
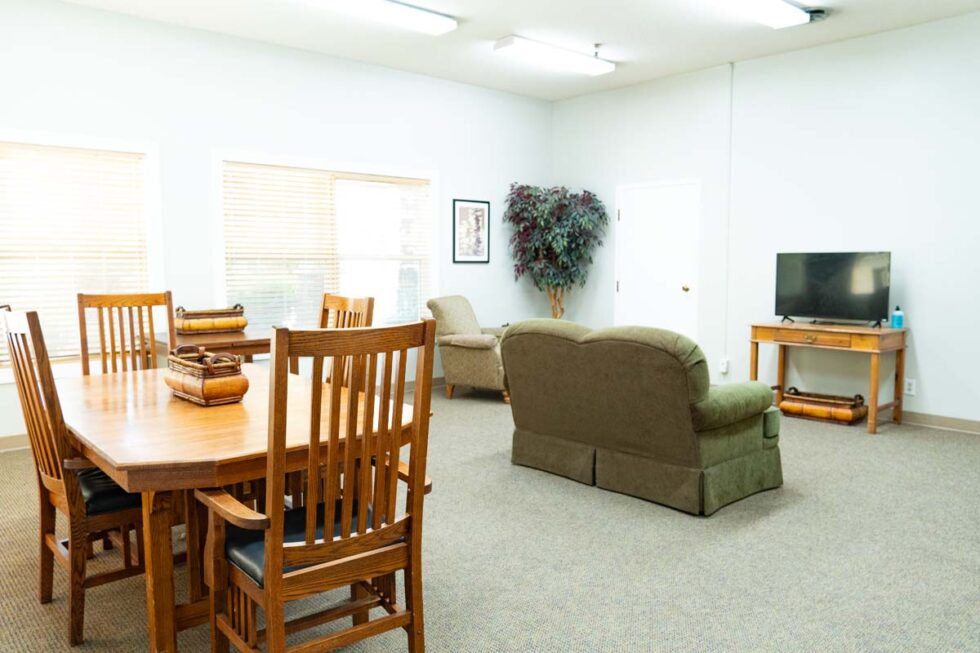
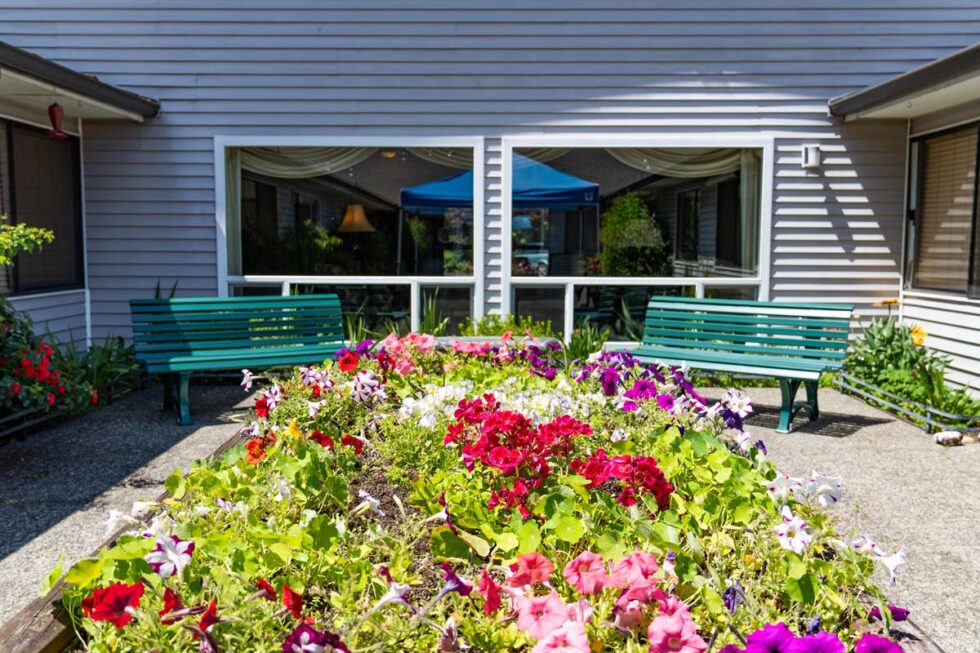
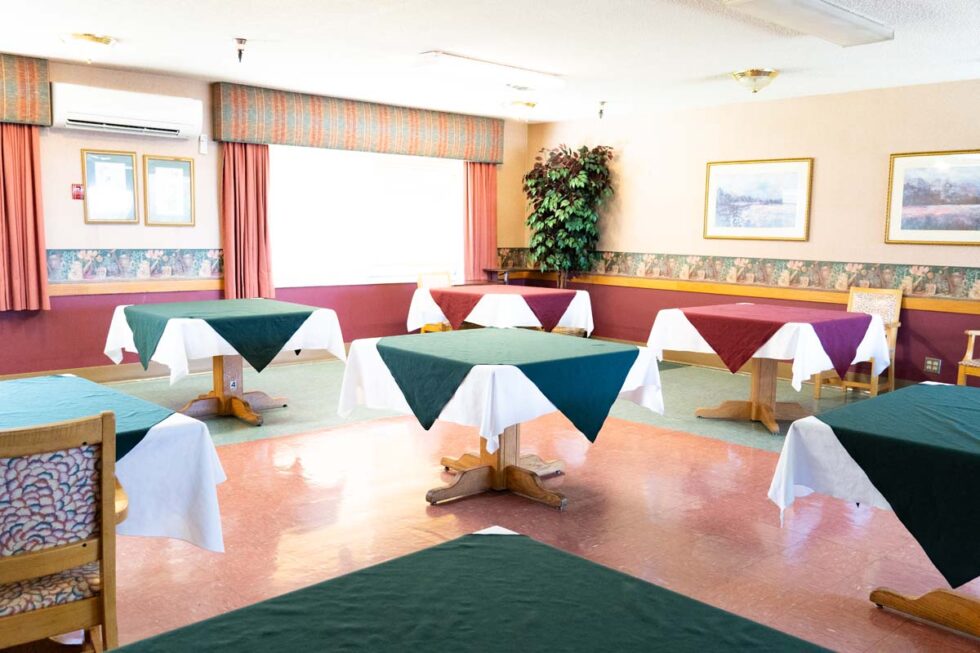
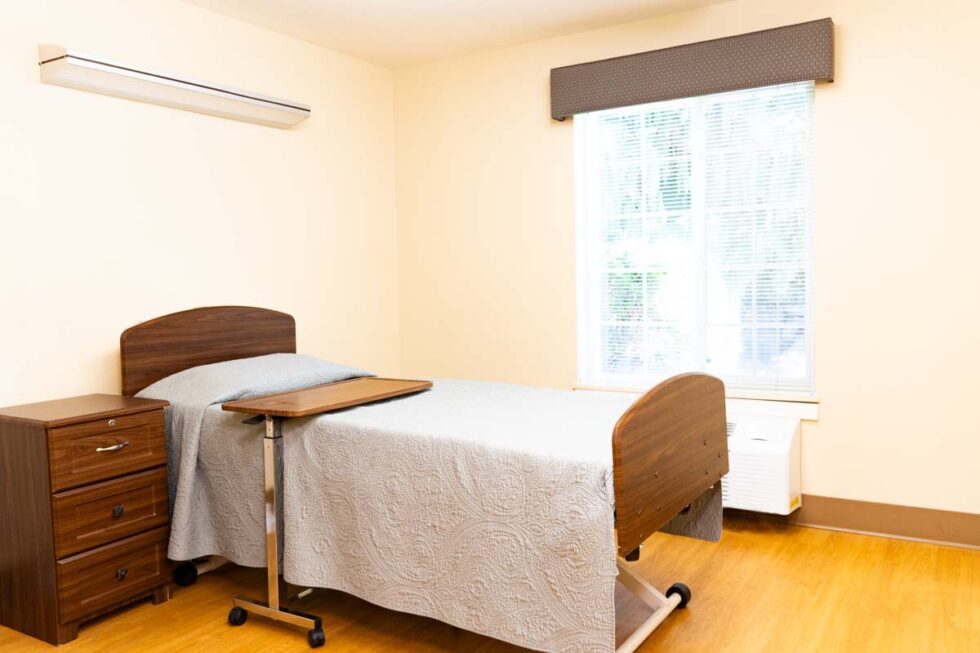
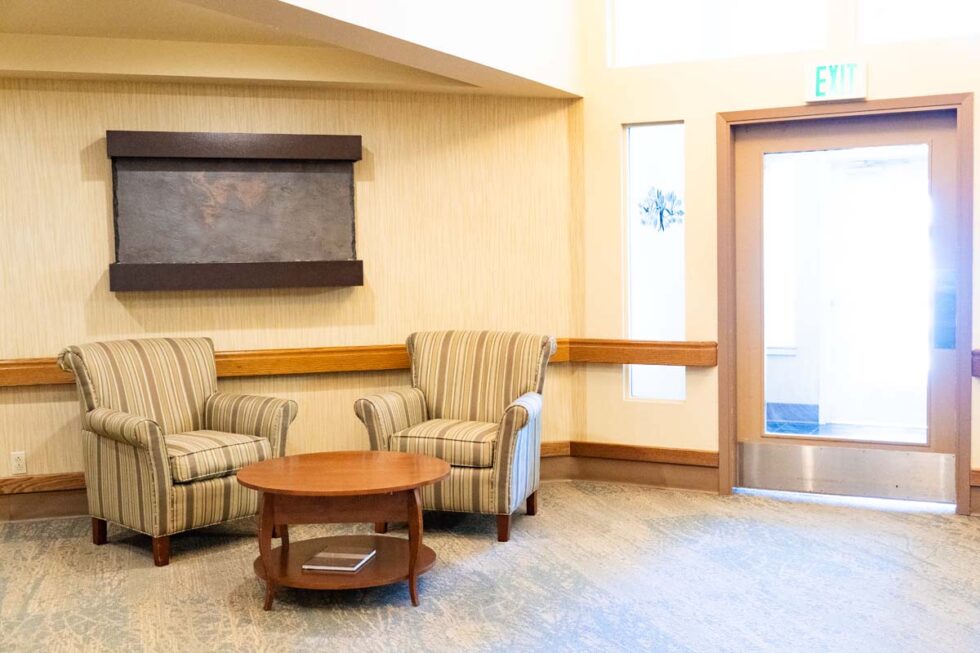
Prepare for a comfortable and beautiful place to call home, with private verandas, large windows, and numerous floor plans to suit your needs. The large, private dining room offers daily meals, as well as a variety of events and entertainment options. There are also laundry machines on every floor, a library and game room, an event space with full kitchen, and a beautiful resident lobby to socialize in. The Villas at Ridgemont provide top-quality service, access to care, and the independent lifestyle you or your loved one is looking for. Make an appointment today!

(360) 876-4461

Quality ratings

Measured by Centers for Medicare & Medicaid Services (CMS)

Overall rating Info Official CMS rating based on health inspections, staffing and quality measures.
4/5
Washington average: 3.2/5
Health Inspection Info Official CMS rating based on deficiencies found during state health inspections.
4/5
Washington average: 2.8/5
Staffing Info Official CMS rating based on nurse staffing hours per resident per day.
2/5
Washington average: 3.4/5
Quality Measures Info Official CMS rating based on clinical outcomes for residents.
4/5
Washington average: 3.9/5

Nursing care per resident

Info Average daily nursing hours per resident (adjusted for acuity). Higher values indicate more nursing time per resident.
3h 28m per day

This home provides 18% less nursing time per resident than the state average.

Washington average: 4h 13m per day

Staffing hours breakdown

Info Hours of care per resident per day, broken down by staff type. Data from CMS Medicare.
Staff type Facility State avg National avg
Registered Nurse (RN) Info Registered nurse hours per resident per day. 36m per day 53m per day 41m per day
LPN / LVN Info Licensed Practical Nurse / Licensed Vocational Nurse hours per resident per day. 1h 11m per day 49m per day 52m per day
Nurse Aide Info Nurse aide hours per resident per day. 2h 31m per day 2h 41m per day 2h 21m per day
Total Nursing (Weekend) Info Total number of nurse staff hours per resident per day on weekends. 3h 55m per day 3h 47m per day 3h 26m per day
Physical Therapist Info Physical therapist staff hours per resident per day. 4m per day 5m per day 4m per day
RN (Weekend) Info Registered nurse hours per resident per day on weekends. 26m per day 38m per day 29m per day

Capacity and availability

Smaller home

May offer a more intimate, personalized care environment.

Total beds 96

This home usually has availability

Lower occupancy suggests more openings may be available.

Lower demand than the Washington average
Occupancy rate 77.1%
Residents per day (avg) 69
Occupancy rate
77.1%
Residents per day (avg)
69

Who this home usually serves

TYPE OF STAY

Mostly short-term rehab stays

Most residents typically stay for a few weeks or months before returning home or moving on.

Might be optimal for
Short stays Recovery Medicare-covered care

Breakdown by payment type

Medicare

65% of new residents, usually for short-term rehab.

Typical stay 9 days

Private pay

16% of new residents, often for short stays.

Typical stay 1 - 2 months

Medicaid

19% of new residents, often for long-term daily care.

Typical stay 4 - 5 months

Finances and operations

Proprietary home
Corporation
Home revenue
$5.5M
Operating loss
-$79.0K
Proprietary home Corporation
Home revenue
$5,489,287.00
Operating loss
$-78,966.00
Payroll costs Info The portion of the home's budget spent on staff, including nurses, caregivers, and other employees who support care and operations.
$2.4M
43.5% of revenue
Other operating costs Info All remaining costs needed to run the home, such as food, utilities, building maintenance, supplies and administrative expenses.
$3.2M
Total costs $5.6M
Walk Score
Walk Score: 29 / 100
Somewhat walkable. A few nearby services may be reachable on foot, but most trips require transportation.

About this community

Care Services

Nursing Services
Rehabilitation Services
Skilled Nursing
24-Hour Staffing

Amenities & Lifestyle

On-site therapy gym
Telemedicine assistance
Transportation assistance
Personalized
compassionate care
Regular wellness checks
Close collaboration between staff and overseeing physician
Nurse call system
24-hour healthcare professionals
Safety features in each room
On-site therapists
Licensed nurse on-site 24/7

Programs & Activities

Specific Programs
Skilled Nursing, Rehabilitation, Short & Long-Term Care
Contact Avamere Rehabilitation at Ridgemont

Compare Nursing Homes around Port Orchard

The information below is reported by the Washington Department of Social and Health Services, Residential Care Services.
Avamere Rehabilitation at Ridgemont
SNF

Nursing Home 24/7 care needed

AL

Assisted Living For seniors needing help with daily tasks but not full-time nursing.

Port Orchard
96
No
29
CARLSTON, SCOTT
77.1%
$5,486,797.00
$2,388,091.00
43.5%
68.90
4/5
3.4639
4/5
2/5
4/5
30
1
-42%
-18%
+6%

Places of interest near Avamere Rehabilitation at Ridgemont

Address 2.4 miles from city center — 5.77 miles to nearest hospital (Naval Hospital Bremerton)
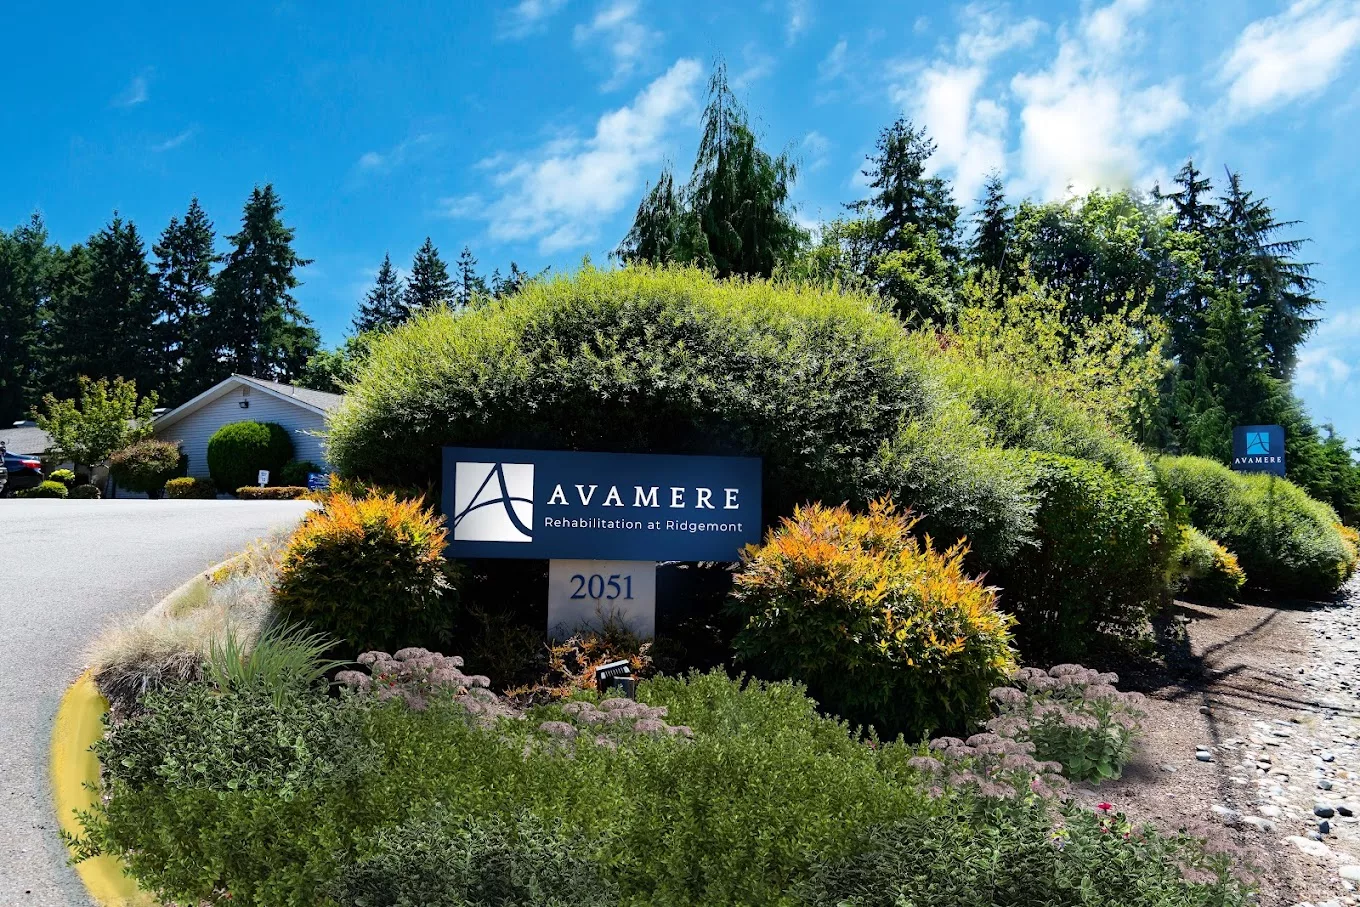
Address 2051 Pottery Ave, Port Orchard, WA 98366

Calculate Travel Distance to Avamere Rehabilitation at Ridgemont

Add your location

Address

Staffing Data

Source: CMS Payroll-Based Journal (Q2 2025)

138
Total Staff
129
Employees
9
Contractors
32,972
Total Hours (Quarter)
48
Avg Staff/Day
7.5
Avg Shift (hrs)
Nursing Staff Breakdown
Role Count Avg Shift (hrs) Uses Contractors?
Registered Nurse117.5 Yes
Licensed Practical Nurse249 Yes
Certified Nursing Assistant667.2 Yes
Staff by Category
Administration
2 staff
6.5hs shift avg
Nursing Staff
104 staff
7.6hs shift avg
Physicians & Practitioners
3 staff
8hs shift avg
Therapy Services
19 staff
6.6hs shift avg
Activities & Recreation
0 staff
0hs shift avg
Social Services
3 staff
4.5hs shift avg
Dietary Services
4 staff
7hs shift avg
Other Services
3 staff
7.7hs shift avg
Contractor Analysis
0.7%
of total hours from contractors
239 contractor hours this quarter
Licensed Practical Nurse: 2 Certified Nursing Assistant: 1 Registered Nurse: 2 Medical Director: 1 Diagnostic X-ray Services Staff: 1 Occupational Therapy Assistant: 2
Role Employees Contractors Total Staff Total Hours Days Worked % of Days Avg Shift (hrs)
Certified Nursing Assistant6516616,10091100%7.2
Licensed Practical Nurse222247,78491100%9
Registered Nurse92112,52091100%7.5
Clinical Nurse Specialist2029097481%8.1
Speech Language Pathologist7078066774%7.1
Other Dietary Services Staff30374391100%6.6
Mental Health Service Worker1015126470%8
Administrator1014886167%8
Physical Therapy Aide3034356571%6.5
Respiratory Therapy Technician3034266470%6.5
Dietitian1014165358%7.8
Nurse Practitioner1013925055%7.8
Physical Therapy Assistant2023666369%5.8
Dental Services Staff1013404448%7.7
Occupational Therapy Aide2021882831%6.7
RN Director of Nursing2021673741%4.1
Qualified Social Worker3031252730%4.5
Nurse Aide in Training1011211719%7.1
Medical Director011682426%2.8
Diagnostic X-ray Services Staff0113789%4.6
Occupational Therapy Assistant0223167%5.1

Health Inspection History

Inspections
Total health inspections 5

Washington average 7.8


Last Health inspection on Sep 2025

Total health citations 30
Citations per inspection
6

Health citations are formal notices following inspections when they fail to comply with safety and care standards.

28 of 30 citations resulted from standard inspections; and 2 of 30 resulted from complaint investigations.

Breakdown of citation severity (last 3 years)
Critical Health citations More info 0
100% better than Washington average

Washington average: 0.3


Serious Health citations More info 1
41% better than Washington average

Washington average: 1.7

0 critical citations More info Washington average: 0.3

1 serious citation More info Washington average: 1.7

29 moderate citations More info Washington average: 46.3

0 minor citations More info Washington average: 0.5
Citations history (last 3 years)
Abuse/Neglect moderate citation Sep 12, 2025
Corrected

Infection Control moderate citation Sep 12, 2025
Corrected

Pharmacy moderate citation Sep 12, 2025
Corrected

Quality of Care moderate citation Sep 12, 2025
Corrected

Facility Characteristics

Source: CMS Long-Term Care Facility Characteristics (Data as of Jan 2026)

Ownership: For-Profit LLC
Part of: Avamere Group, LLC
Resident Census by Payment Source
77 Total Residents
Medicare 12 (15.6%)
Medicaid 40 (51.9%)
Private Pay/Other 25 (32.5%)
Programs & Services
Residents' Group
CCRC
Family Engagement

Active councils help families stay involved in care decisions and facility operations.

Quality of care over time

These measures show how residents usually do over time at this home, based on health outcomes and preventive care.

High-risk clinical events score Info A composite score based on pressure ulcers, falls with injury, weight loss, walking ability decline, and activities of daily living decline. 8.4
17% better than Washington average

Washington average: 10.0

Functional decline score Info A composite score based on activities of daily living decline, walking ability decline, and incontinence. 18.6
11% better than Washington average

Washington average: 20.9

Long-stay resident measures
Need for Help with Daily Activities Increased Info Percent of long-stay residents whose need for help with daily activities has increased 20.9%
28% worse than Washington average

Washington average: 16.4%

Walking Ability Worsened Info Percent of long-stay residents whose ability to move independently worsened 13.4%
39% better than Washington average

Washington average: 21.8%

Low Risk Residents with Bowel/Bladder Incontinence Info Percent of low risk long-stay residents who lose control of their bowels or bladder 21.4%
12% better than Washington average

Washington average: 24.3%

Falls with Major Injury Info Percent of long-stay residents experiencing one or more falls with major injury 3.1%
20% worse than Washington average

Washington average: 2.6%

High Risk Residents with Pressure Ulcers Info Percent of long-stay high risk residents with pressure ulcers 2.4%
51% better than Washington average

Washington average: 4.9%

Urinary Tract Infection Info Percent of long-stay residents with a urinary tract infection 0.0%
100% better than Washington average

Washington average: 1.7%

Lost Too Much Weight Info Percent of long-stay residents who lose too much weight 1.9%
67% better than Washington average

Washington average: 5.8%

Depressive Symptoms Info Percent of long-stay residents who have depressive symptoms 59.6%
268% worse than Washington average

Washington average: 16.2%

Antipsychotic Use Info Percent of long-stay residents who received an antipsychotic medication 15.5%
7% worse than Washington average

Washington average: 14.5%

Pneumococcal Vaccine Info Percent of long-stay residents assessed and appropriately given the pneumococcal vaccine 100.0%
In line with Washington average

Washington average: 96.2%

Influenza Vaccine Info Percent of long-stay residents assessed and appropriately given the seasonal influenza vaccine 100.0%
7% better than Washington average

Washington average: 93.8%

Hospitalizations per 1,000 days Info Number of hospitalizations per 1,000 long-stay resident days. 2.31
67% worse than Washington average

Washington average: 1.38

ED visits per 1,000 days Info Number of outpatient emergency department visits per 1,000 long-stay resident days. 1.53
In line with Washington average

Washington average: 1.51

Short-stay resident measures
Pneumococcal Vaccine Info Percent of short-stay residents assessed and appropriately given the pneumococcal vaccine 98.9%
12% better than Washington average

Washington average: 88.1%

Antipsychotic medication increase Info Percent of short-stay residents who newly received an antipsychotic medication 0.9%
40% better than Washington average

Washington average: 1.4%

Influenza Vaccine Info Percent of short-stay residents assessed and appropriately given the seasonal influenza vaccine 95.0%
16% better than Washington average

Washington average: 82.0%

Re-hospitalized after SNF stay Info Percentage of short-stay residents who were re-hospitalized after their nursing home admission. 30.2%
52% worse than Washington average

Washington average: 19.9%

Emergency department visits Info Percentage of short-stay residents who had an outpatient emergency department visit. 23.6%
79% worse than Washington average

Washington average: 13.2%

Falls with major injury Info Percentage of SNF residents who experience falls with major injury during their stay. 0.8%
In line with Washington average

Washington average: 0.8%

Ability to care for self at discharge Info Percentage of residents at or above expected ability to care for themselves at discharge. 59.4%
11% better than Washington average

Washington average: 53.7%

Successful return to home or community Info Rate of successful return to home or community from a skilled nursing facility. 64.5%
27% better than Washington average

Washington average: 50.6%

Guides for Better Senior Living

Care Cost Calculator: See Prices in Your Area

Nursing Home Data Explorer

Don’t Wait Too Long: 7 Red Flag Signs Your Parent Needs Assisted Living Now

The True Cost of Assisted Living in 2025 – And How Families Are Paying For It

Understanding Senior Living Costs: Pricing Models, Discounts & Financial Assistance

Financial Aid for Washington Seniors

Get financial aid guidance

Community Options Program Entry System (COPES)

WA Medicaid COPES

Age 65+ or disabled, Washington resident, Medicaid-eligible, nursing home-level care need.

~$2,829/month (300% FBR, individual).

$2,000 (individual), $3,000 (couple).

High demand in urban areas (e.g., Seattle).

Washington Family Caregiver Support Program

WA NFCSP

Caregiver of someone 60+ (or with dementia), Washington resident.

No strict limit; prioritizes low-income.

Not applicable.

High urban demand; rural outreach.

Community First Choice (CFC)

Washington Community First Choice

Age 65+ (or disabled 18+), WA resident, Medicaid-eligible, need help with 2+ ADLs/IADLs.

~$2,829/month; QIT optional.

$2,000 (individual), $3,000 (couple).

Broader than COPES; serves ~20,000; self-directed option.

Older Americans Act (OAA) Services

Washington OAA Services

Age 60+, WA resident; no income/asset limits.

None; donations encouraged.

Not assessed.

13 AAAs; includes Meals on Wheels; rural focus.

Medicare Savings Program (MSP)

Washington Medicare Savings Program

Age 65+ or disabled, WA resident, Medicare Part A/B.

~$2,510/month (QMB), ~$3,380/month (SLMB), ~$3,598/month (QI)—individual.

$9,430 (individual), $14,130 (couple).

Includes Extra Help for Part D; no waitlist.

Low-Income Home Energy Assistance Program (LIHEAP)

Washington LIHEAP

Age 60+ prioritized, WA resident, low-income household.

~$3,970/month (185% FPL).

Not assessed.

Covers gas, electric, wood; emergency aid available.

Senior Community Service Employment Program (SCSEP)

Washington SCSEP

Age 55+, unemployed, low-income, WA resident.

~$1,983/month (125% FPL).

Not specified.

Priority for veterans, rural residents; AARP partnership.

VA Aid and Attendance (A&A) and Housebound Benefits

Washington VA Aid and Attendance/Housebound

Age 65+ or disabled veteran/spouse, WA resident, wartime service, ADL help (A&A) or homebound.

Net income < ~$1,984/month (veteran with dependent, A&A); pension offsets income.

~$155,356 (net worth).

High veteran use; supports rural/urban needs.

Senior Citizens Property Tax Exemption

Washington Senior Property Tax Exemption

Age 61+ or disabled retiree, WA resident, homeowner, income-based.

~$45,000-$70,000/year (varies by county, e.g., King: $70,000).

Not assessed; home value cap varies (~$250,000-$400,000).

Saves ~$500-$1,500/year; offered statewide.

Senior Farmers’ Market Nutrition Program (SFMNP)

Washington SFMNP

Age 60+, WA resident, low-income.

~$2,322/month (185% FPL).

Not assessed.

Vouchers (~$80/season); serves ~20,000 via AAAs.

Who we are

Your Senior Care Partner, Every Step of the Way

We help families find affordable senior communities and unlock same day discounts, Medicaid, and Medicare options tailored to your needs.

Contact us Today