Avina Milwaukee

Senior Communities Home
Overview of Avina Milwaukee

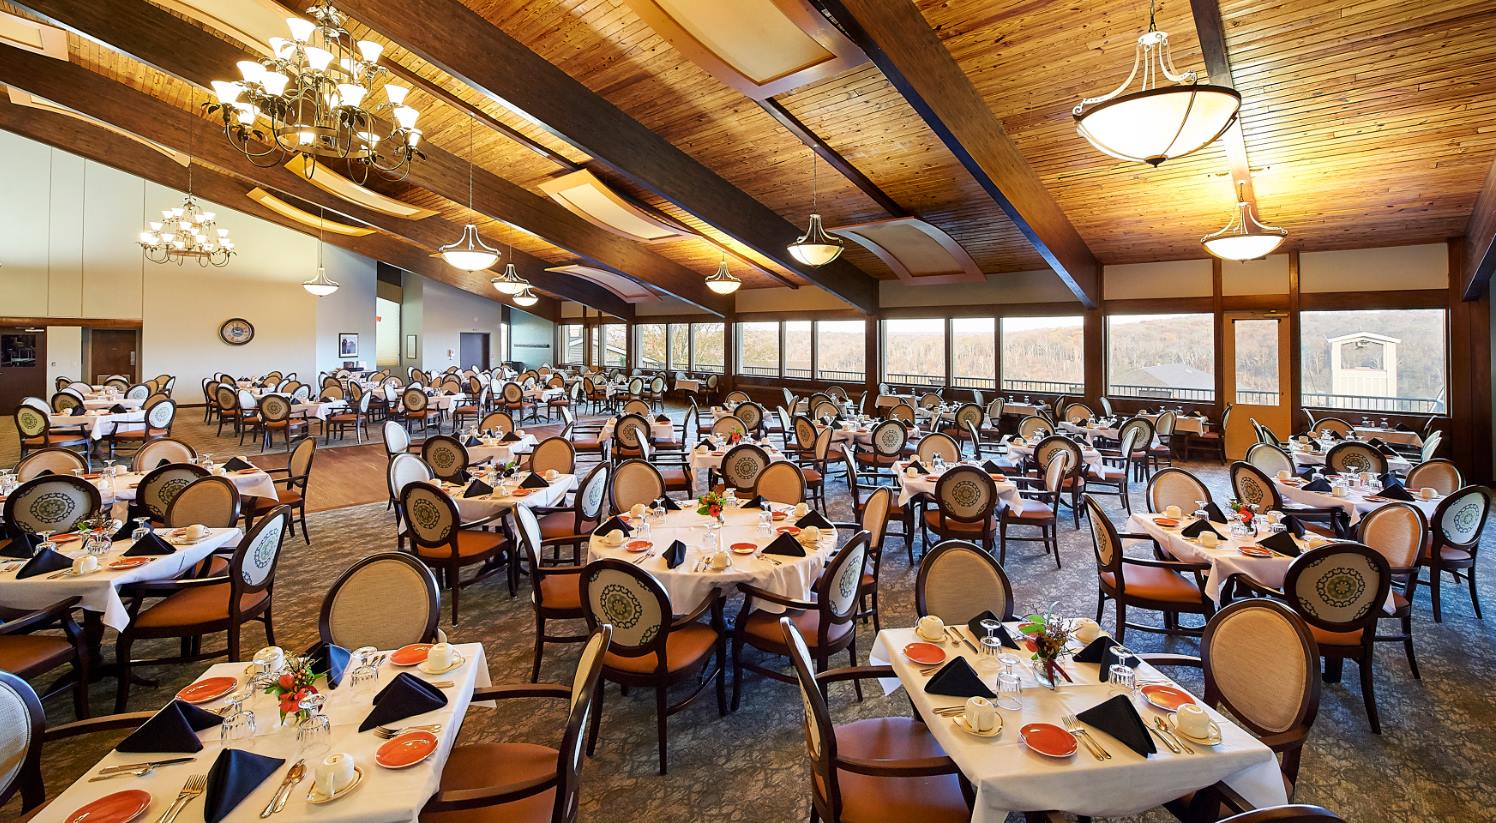
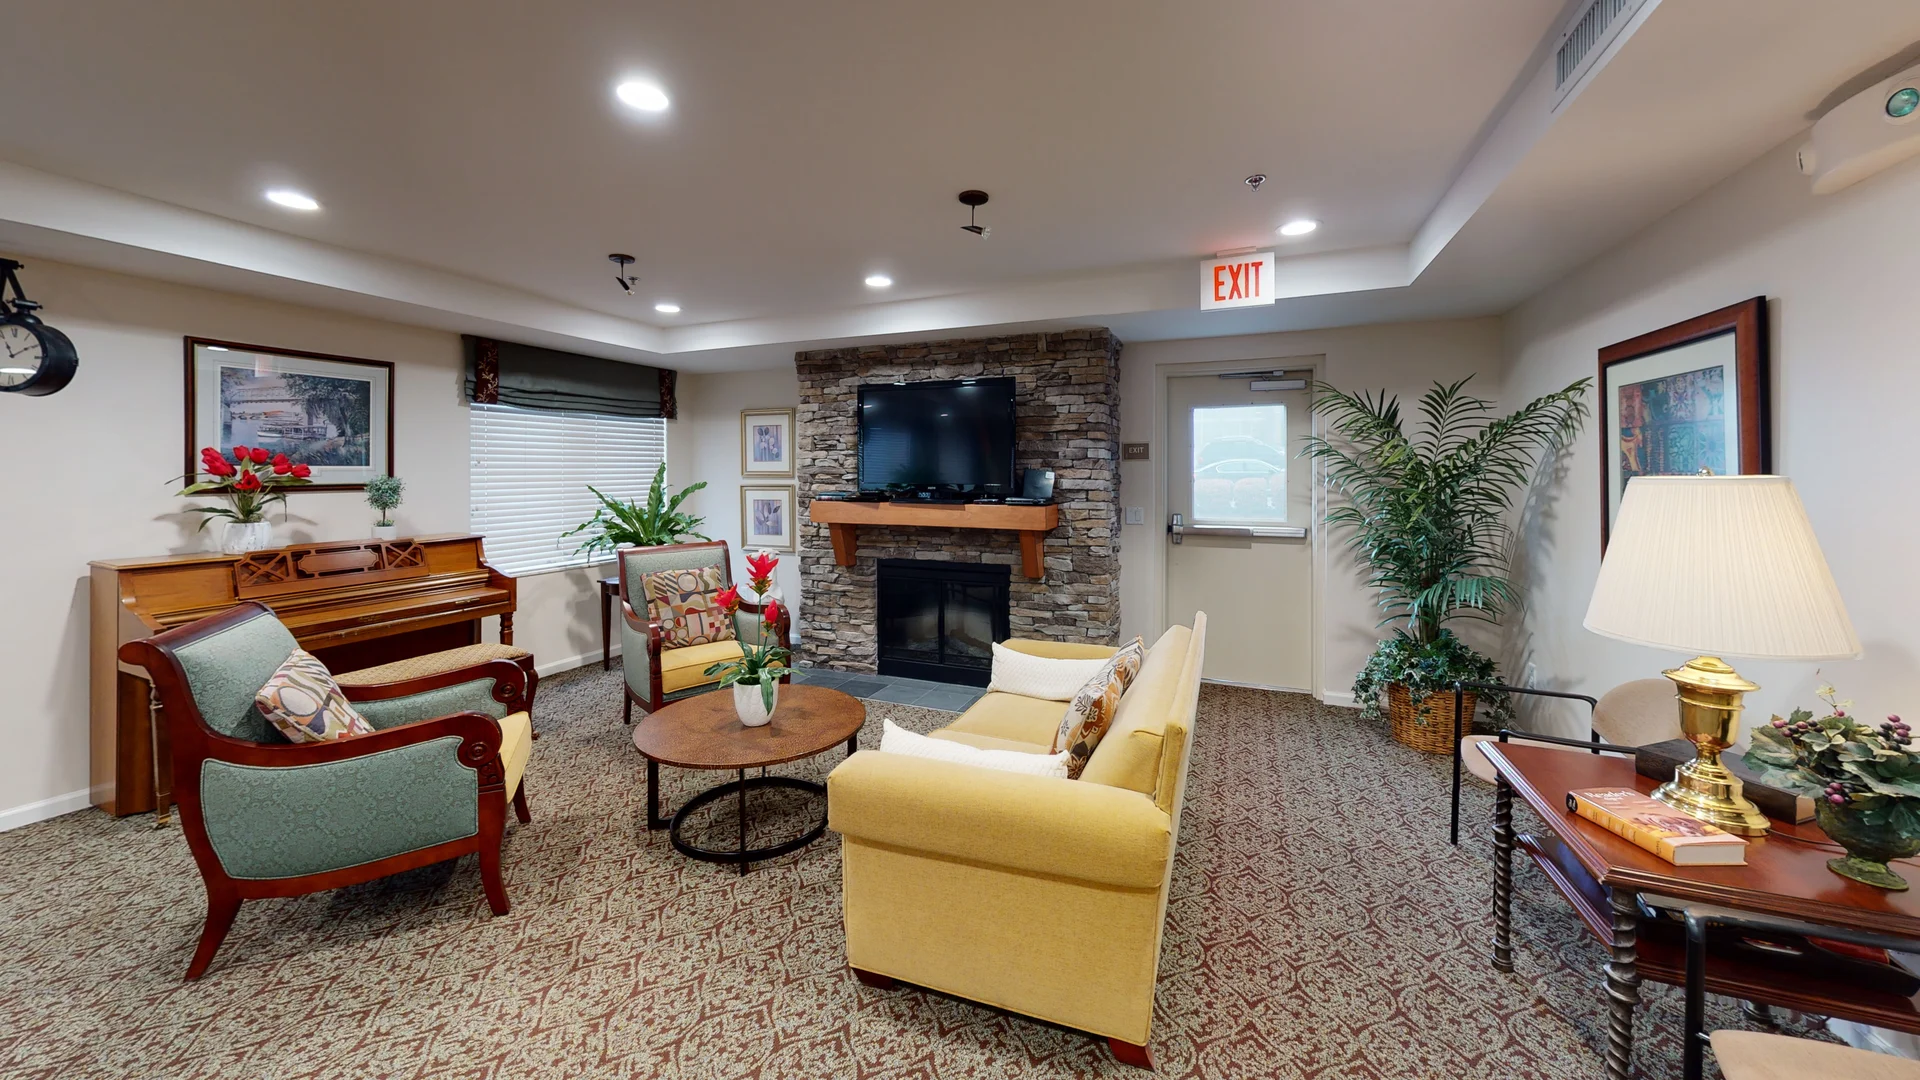
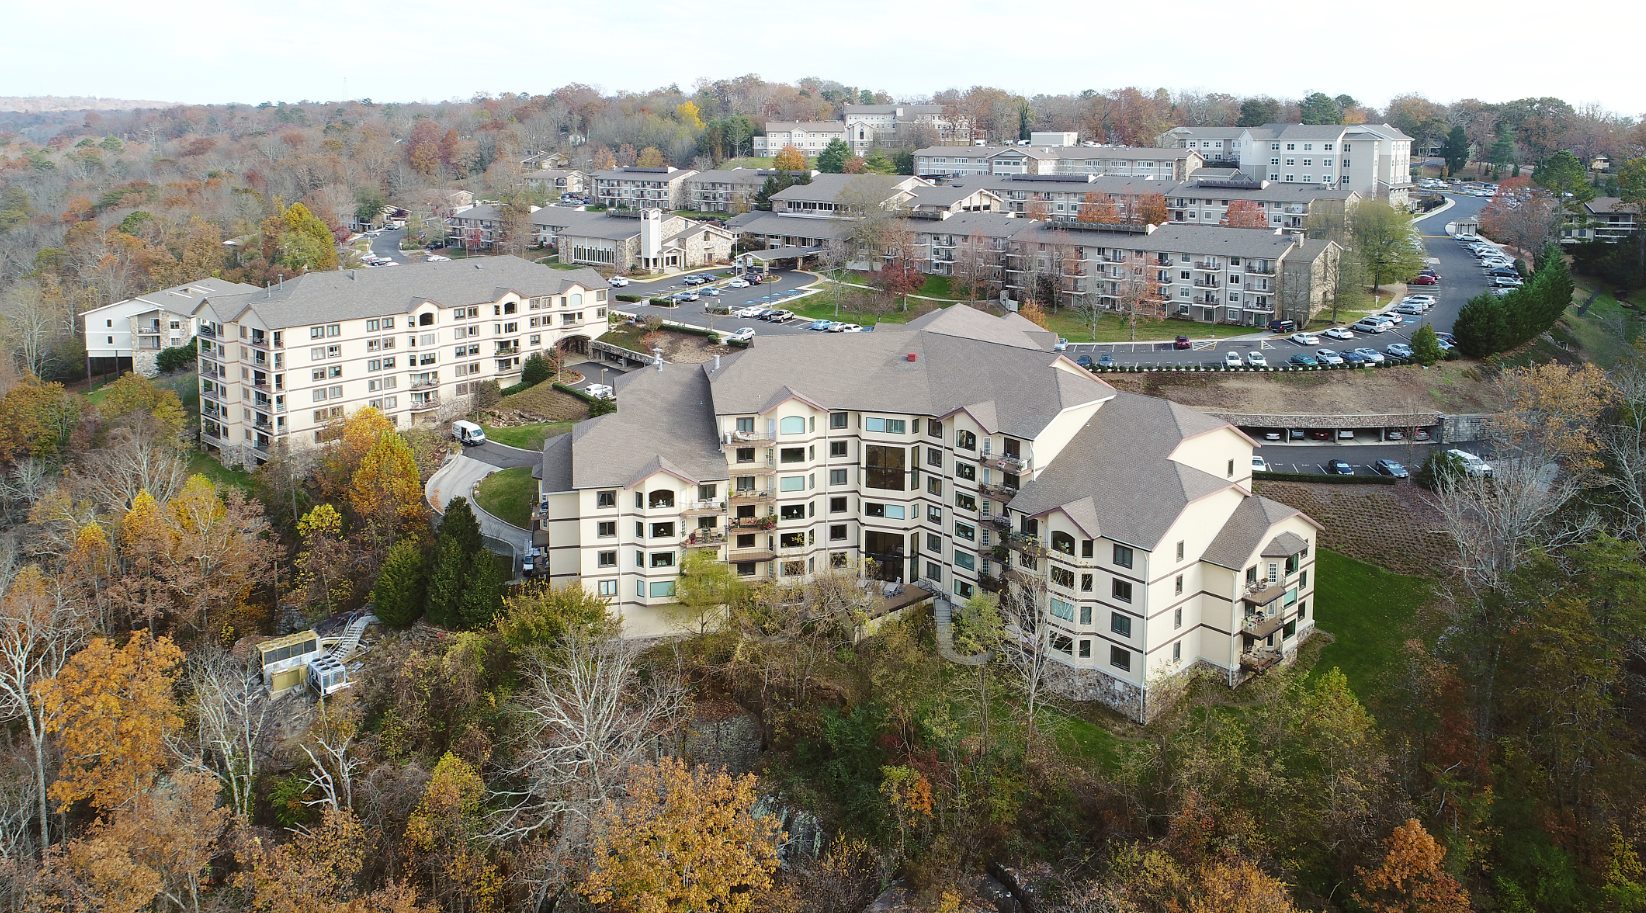
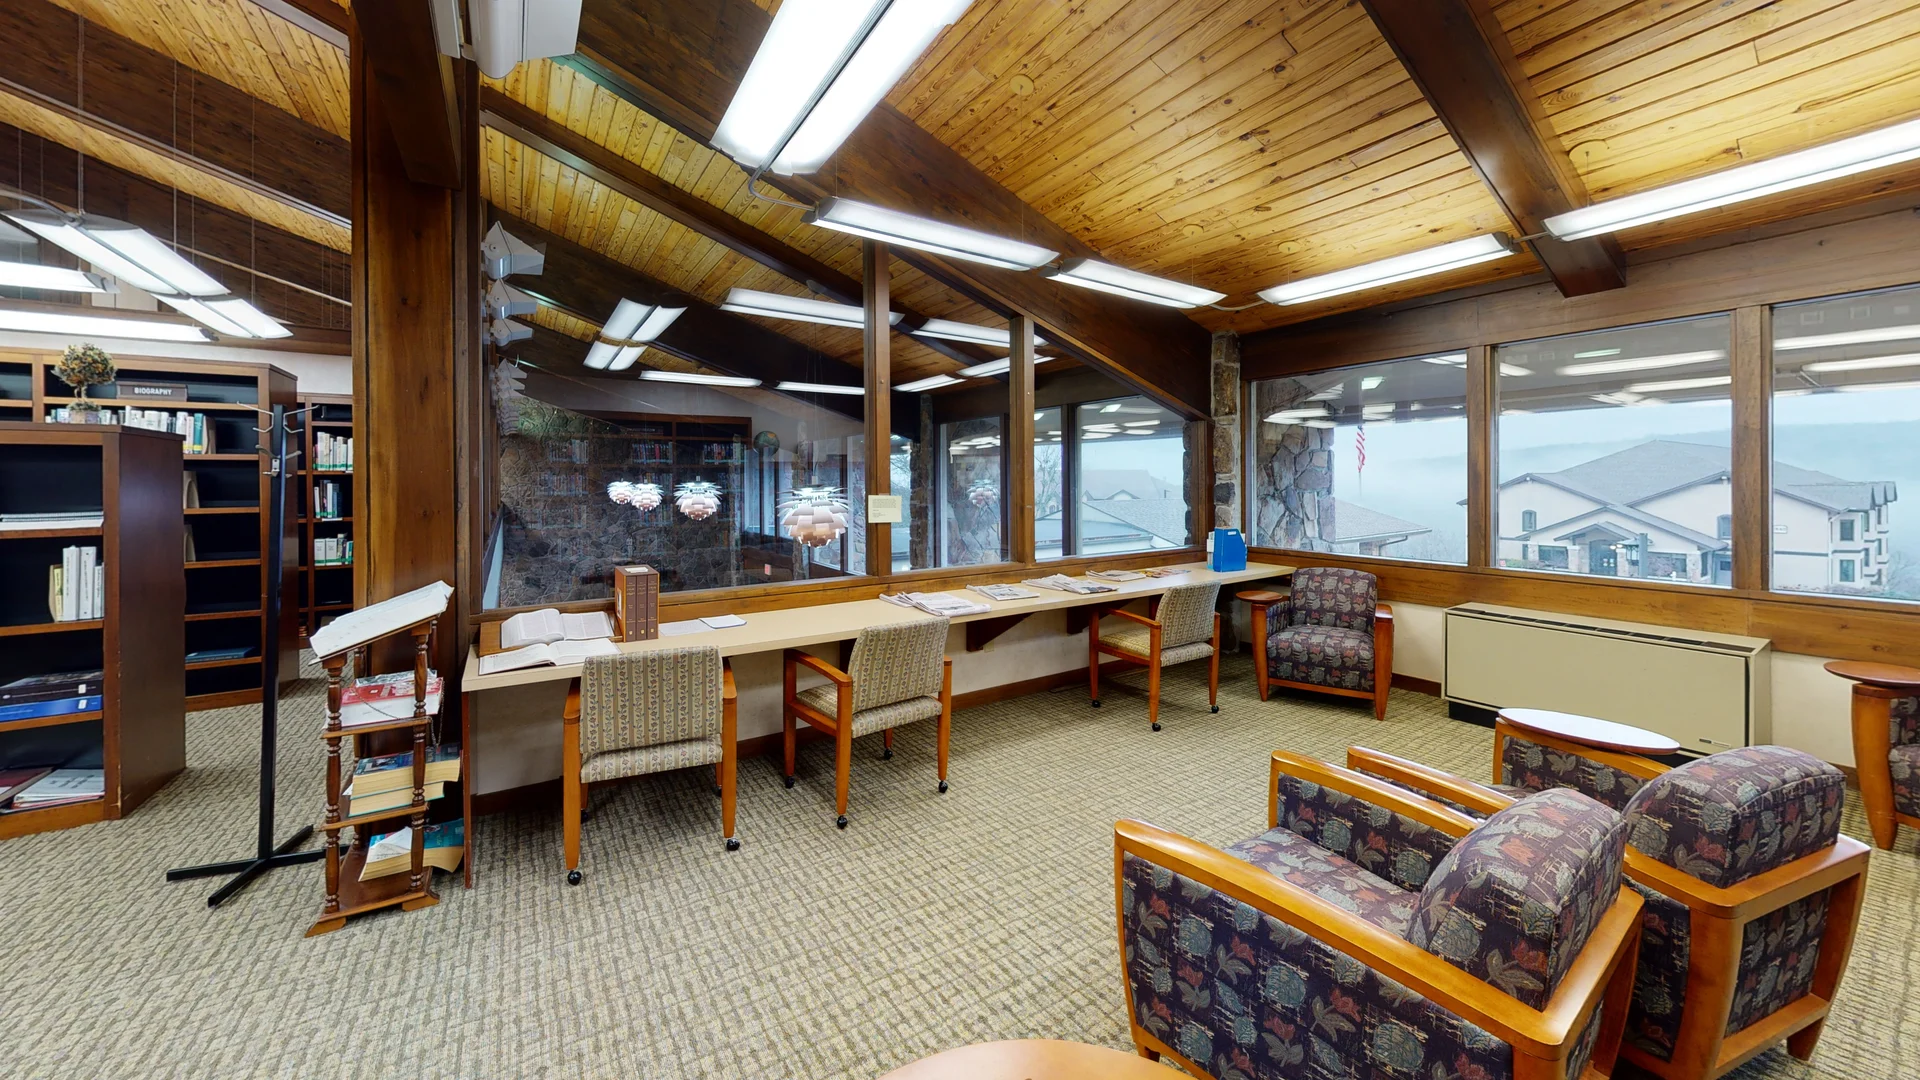
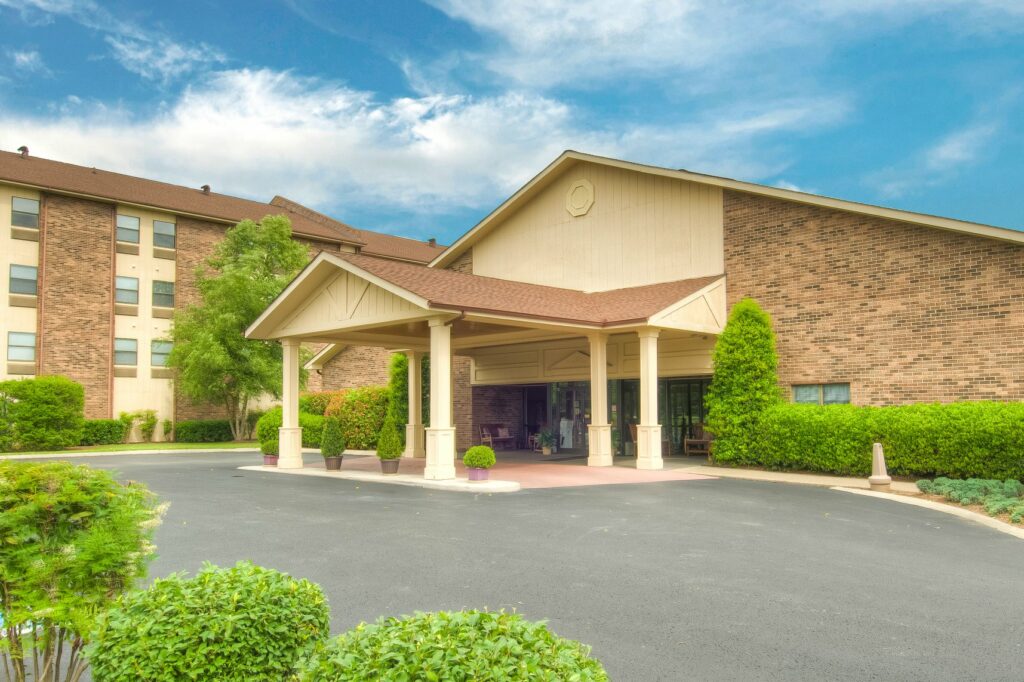
Spend your twilight years surrounded by the lush landscapes of Chattanooga, Tennessee, from the comfort of Avina Milwaukee’s senior community. Overlooking from Signal Mountain, Avina’s offers gold standard independent, assisted living, memory support, skilled nursing, rehabilitation, and adult day care services for seniors looking for a scenic place to retire to.

Enjoy close proximity to the serene atmosphere of nature, as well as the conveniences of city living, all while nestled into cozy and elegant living quarters in Avina. Take full control of your time with round the clock assistance with daily living activities, medical management tailored to your specific needs, so you can live senior life to the fullest.

(423) 886-0100

Quality ratings

Measured by Centers for Medicare & Medicaid Services (CMS)

Overall rating Info Official CMS rating based on health inspections, staffing and quality measures.
1/5
Tennessee average: 2.8/5
Health Inspection Info Official CMS rating based on deficiencies found during state health inspections.
1/5
Tennessee average: 2.8/5
Staffing Info Official CMS rating based on nurse staffing hours per resident per day.
3/5
Tennessee average: 2.4/5
Quality Measures Info Official CMS rating based on clinical outcomes for residents.
2/5
Tennessee average: 3.4/5

Nursing care per resident

Info Average daily nursing hours per resident (adjusted for acuity). Higher values indicate more nursing time per resident.
4h 29m per day

This home provides 24% more nursing time per resident than the state average.

Tennessee average: 3h 38m per day

Capacity and availability

Medium-capacity home

Offers a balance of services and community atmosphere.

Total beds 184

This home usually has availability

Lower occupancy suggests more openings may be available.

Lower demand than the Tennessee average
Occupancy rate 75.5%
Residents per day (avg) 84
Occupancy rate
75.5%
Residents per day (avg)
84

Who this home usually serves

TYPE OF STAY

Primarily short stays

Residents typically stay for brief periods, with frequent admissions and discharges throughout the year.

Might be optimal for
Post-acute recovery Temporary care Transitional stays

Breakdown by payment type

Medicare

19% of new residents, usually for short-term rehab.

Typical stay 1 - 2 months

Private pay

81% of new residents, often for short stays.

Typical stay 7 - 8 months

Finances and operations

Voluntary non-profit home
Church
Home revenue
$31.1M
Operating deficit
-$2.4M
Voluntary non-profit home Church
Home revenue
$31,091,335.00
Operating deficit
$-2,435,239.00
Payroll costs Info The portion of the home's budget spent on staff, including nurses, caregivers, and other employees who support care and operations.
$6.0M
19.4% of revenue
Other operating costs Info All remaining costs needed to run the home, such as food, utilities, building maintenance, supplies and administrative expenses.
$27.5M
Total costs $33.5M

What does this home offer?

Housing options icon

Housing Options: Studio / 1 Bed / 2 Bed

Building type icon
Building type icon

Building Type: Mid-rise

Transportation services icon

Transportation Services

Fitness and recreation icon

Fitness and Recreation

Types of Care at Avina Milwaukee

Independent Living Assisted Living Memory Care Nursing Home
Contact Avina Milwaukee

Compare Senior Communities around Tennessee

The information below is reported by the Tennessee Department of Health, Division of Health Care Facilities.
Avina Milwaukee
AL

Assisted Living For seniors needing help with daily tasks but not full-time nursing.

IL

Independent Living For self-sufficient seniors seeking community and minimal assistance.

MC

Memory Care Specialized care for those with Memory Loss, Alzheimer's, or dementia, ensuring safety and support.

SNF

Nursing Homes 24/7 care needed

Signal Mountain
184
No
-
4
MILLER, AARON
75.5%
$30,204,753.00
$6,042,437.00
20%
84.40
1/5
4.4826
1/5
3/5
2/5
1
27
5
+9%
+24%
+3%
Studio / 1 Bed / 2 Bed
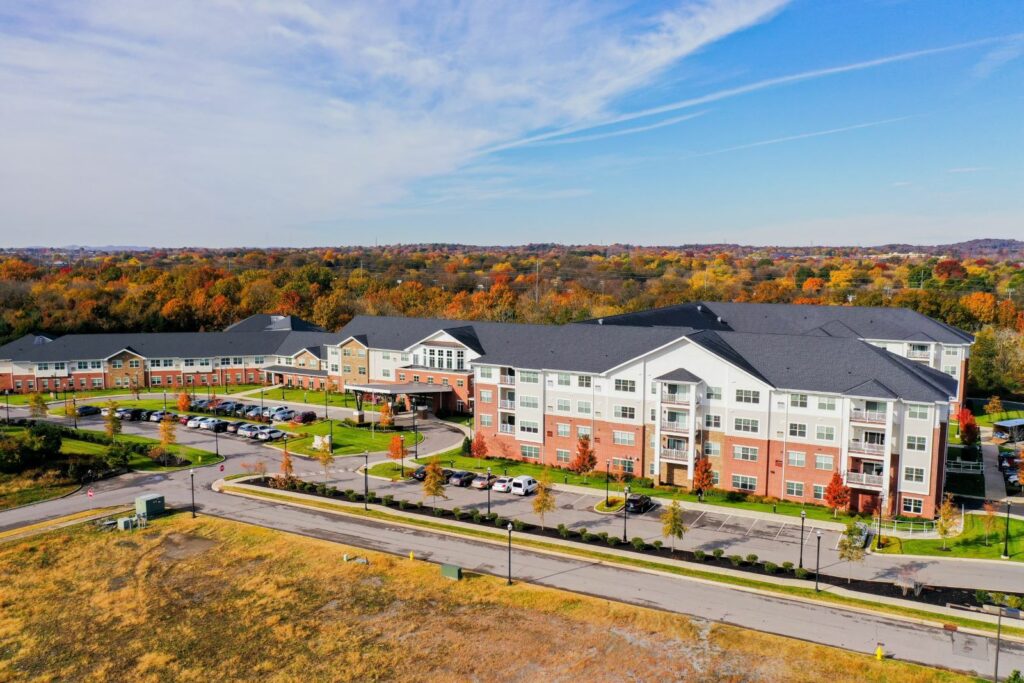
Clarendale at Indian Lake
AL

Assisted Living For seniors needing help with daily tasks but not full-time nursing.

IL

Independent Living For self-sufficient seniors seeking community and minimal assistance.

MC

Memory Care Specialized care for those with Memory Loss, Alzheimer's, or dementia, ensuring safety and support.

Hendersonville
78
No
A+
38
Hendersonville TN Senior LIving LeaseCo,
93.6%
-
-
-
-
-
-
-
-
-
-
-
-
-
-
+28%
Studio / 1 Bed / 2 Bed
Park Place Retirement Community
AL

Assisted Living For seniors needing help with daily tasks but not full-time nursing.

IL

Independent Living For self-sufficient seniors seeking community and minimal assistance.

Hendersonville
49
No
-
60
Park Place Senior Living, LLC
-
-
-
-
-
-
-
-
-
-
-
-
-
-
-
-
Studio / 1 Bed / 2 Bed
Fairfield Glade
AL

Assisted Living For seniors needing help with daily tasks but not full-time nursing.

Crossville
14
No
-
20
-
-
-
-
-
-
-
-
-
-
-
-
-
-
-
-
-
Studio / 1 Bed / 2 Bed
New Hope Senior Living of Hendersonville
AL

Assisted Living For seniors needing help with daily tasks but not full-time nursing.

Hendersonville
-
No
A+
0
-
-
-
-
-
-
-
-
-
-
-
-
-
-
-
-
-
Private Suites

Places of interest near Avina Milwaukee

Address 113 miles from city center — 3.56 miles to nearest hospital (Erlanger North Hospital)
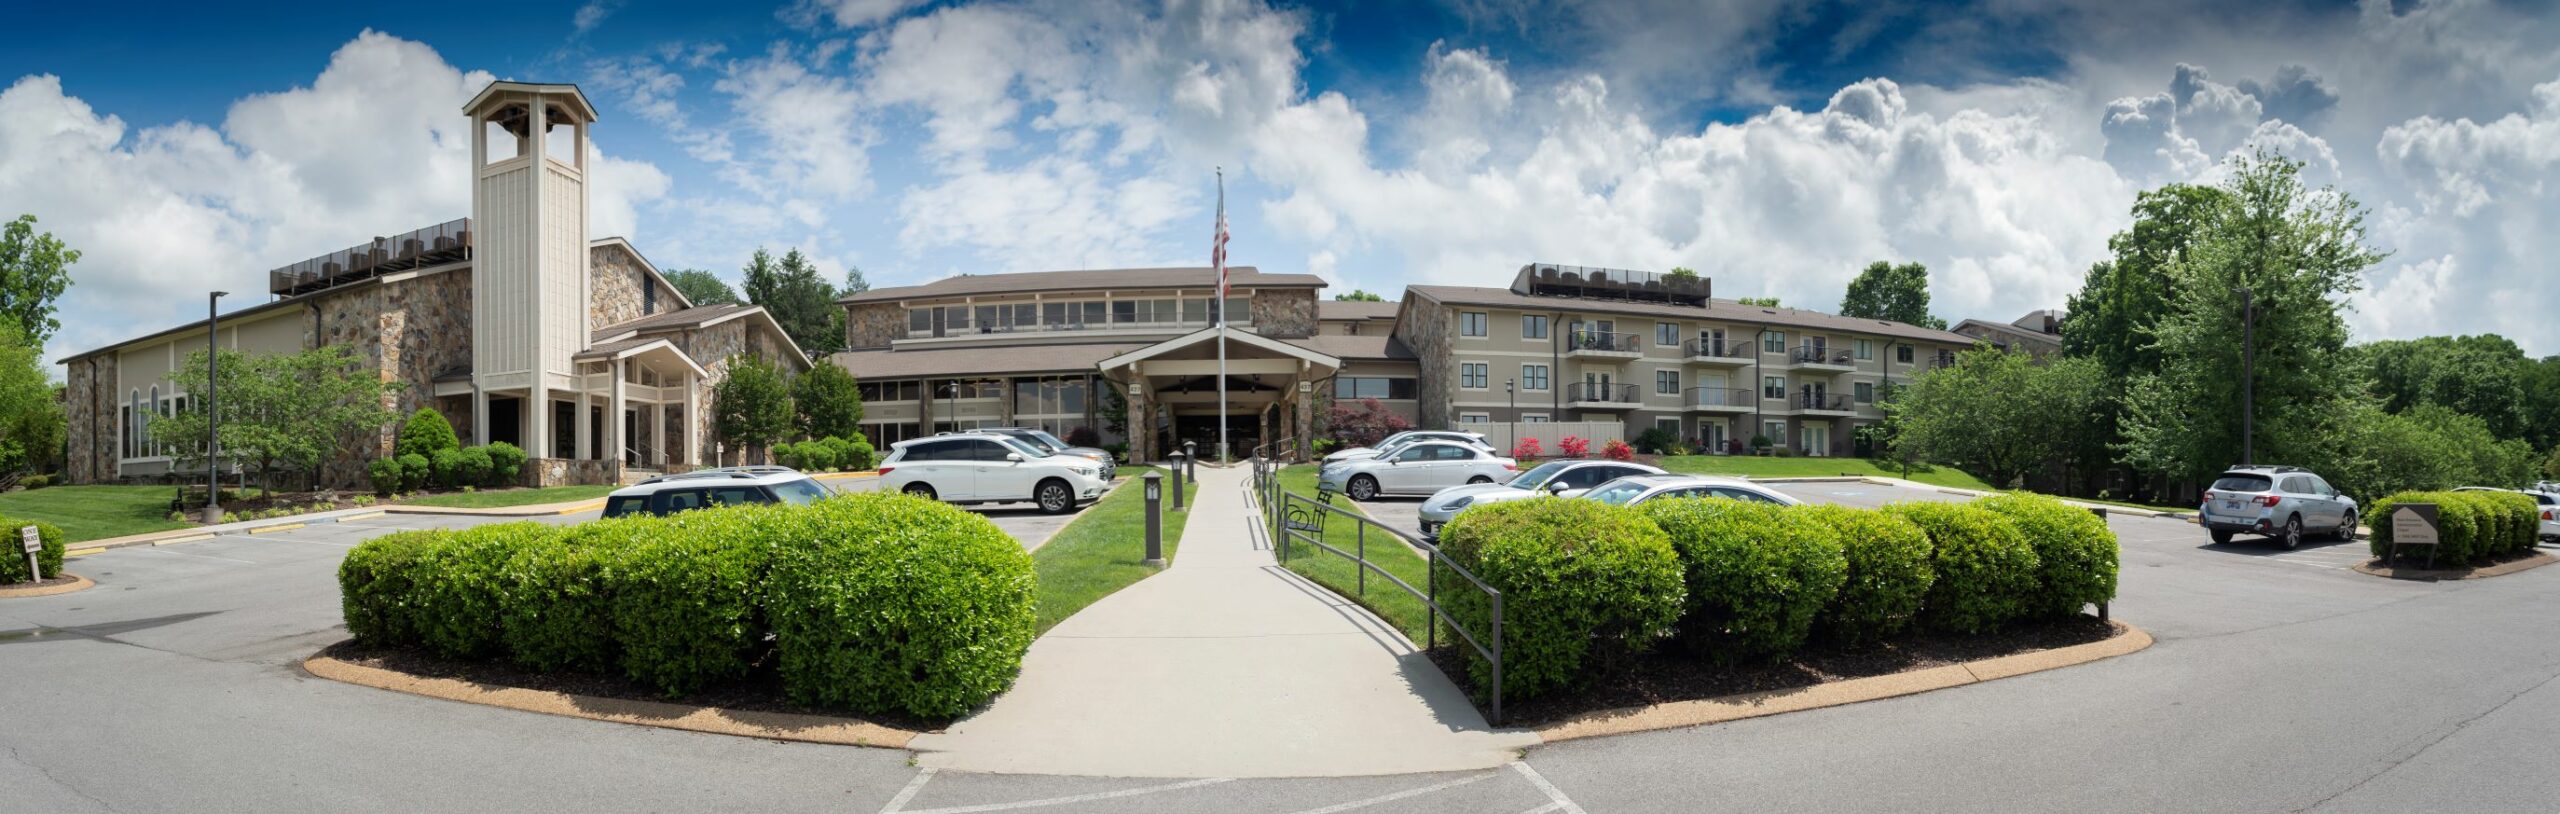
Address 437 Alexian Way, Signal Mountain, TN 37377

Calculate Travel Distance to Avina Milwaukee

Add your location

Address

Staffing Data

Source: CMS Payroll-Based Journal (Q2 2025)

190
Total Staff
83
Employees
107
Contractors
39,040
Total Hours (Quarter)
47
Avg Staff/Day
9.1
Avg Shift (hrs)
Nursing Staff Breakdown
Role Count Avg Shift (hrs) Uses Contractors?
Registered Nurse188.6 Yes
Licensed Practical Nurse439.8 Yes
Certified Nursing Assistant879.8 Yes
Staff by Category
Administration
2 staff
8hs shift avg
Nursing Staff
149 staff
9.7hs shift avg
Physicians & Practitioners
5 staff
8hs shift avg
Therapy Services
26 staff
7.1hs shift avg
Activities & Recreation
0 staff
0hs shift avg
Social Services
2 staff
5.1hs shift avg
Dietary Services
4 staff
8hs shift avg
Other Services
2 staff
7.6hs shift avg
Contractor Analysis
27.6%
of total hours from contractors
10,771 contractor hours this quarter
Speech Language Pathologist: 4 Registered Nurse: 10 Certified Nursing Assistant: 40 Clinical Nurse Specialist: 1 Respiratory Therapy Technician: 3 Licensed Practical Nurse: 28 Qualified Social Worker: 2 Occupational Therapy Aide: 16 Physical Therapy Assistant: 3
Role Employees Contractors Total Staff Total Hours Days Worked % of Days Avg Shift (hrs)
Certified Nursing Assistant47408716,97591100%9.8
Licensed Practical Nurse15284310,93591100%9.8
Registered Nurse810182,5839099%8.6
Speech Language Pathologist0441,7116673%7.2
Clinical Nurse Specialist3141,4086369%8
Other Dietary Services Staff4049296571%8
Respiratory Therapy Technician0338407178%6.6
Administrator2026965662%8
Physical Therapy Assistant0335946571%7.1
Qualified Social Worker0224966875%5.1
Occupational Therapy Aide016164686167%7.7
Mental Health Service Worker1014485662%8
Dental Services Staff1014426167%7.2
Nurse Practitioner1014405560%8
RN Director of Nursing101741112%6.7

Health Inspection History

Inspections
Total health inspections 6

State average 3.5


Last Health inspection on Sep 2024

Total health citations 27
Citations per inspection
4.5

Health citations are formal notices following inspections when they fail to comply with safety and care standards.

11 of 27 citations resulted from standard inspections; and 16 of 27 resulted from complaint investigations.

Breakdown of citation severity (last 3 years)
Critical Health citations More info 5
355% worse than State average

State average: 1.1


Serious Health citations More info 0
100% better than State average

State average: 0.6

5 critical citations More info State average: 1.1

0 serious citations More info State average: 0.6

22 moderate citations More info State average: 13.7

0 minor citations More info State average: 0.1
Citations history (last 3 years)
Infection Control moderate citation Sep 25, 2024
Corrected

Care Planning moderate citation Sep 25, 2024
Corrected

Resident Rights moderate citation Sep 25, 2024
Corrected

Pharmacy moderate citation Aug 07, 2024
Corrected

Facility Characteristics

Source: CMS Long-Term Care Facility Characteristics (Data as of Jan 2026)

Ownership: Non-Profit Corporation
Part of: Ascension Living
Resident Census by Payment Source
83 Total Residents
Medicare 5 (6%)
Medicaid 10 (12%)
Private Pay/Other 68 (81.9%)
Programs & Services
Residents' Group
CCRC
Family Engagement

Active councils help families stay involved in care decisions and facility operations.

Quality of care over time

These measures show how residents usually do over time at this home, based on health outcomes and preventive care.

High-risk clinical events score Info A composite score based on pressure ulcers, falls with injury, weight loss, walking ability decline, and activities of daily living decline. 16.8
60% worse than Tennessee average

Tennessee average: 10.5

Functional decline score Info A composite score based on activities of daily living decline, walking ability decline, and incontinence. 28.6
46% worse than Tennessee average

Tennessee average: 19.5

Long-stay resident measures
Need for Help with Daily Activities Increased Info Percent of long-stay residents whose need for help with daily activities has increased 24.8%
54% worse than Tennessee average

Tennessee average: 16.0%

Walking Ability Worsened Info Percent of long-stay residents whose ability to move independently worsened 31.4%
45% worse than Tennessee average

Tennessee average: 21.7%

Low Risk Residents with Bowel/Bladder Incontinence Info Percent of low risk long-stay residents who lose control of their bowels or bladder 29.5%
42% worse than Tennessee average

Tennessee average: 20.7%

Falls with Major Injury Info Percent of long-stay residents experiencing one or more falls with major injury 11.0%
201% worse than Tennessee average

Tennessee average: 3.7%

High Risk Residents with Pressure Ulcers Info Percent of long-stay high risk residents with pressure ulcers 8.0%
47% worse than Tennessee average

Tennessee average: 5.4%

Urinary Tract Infection Info Percent of long-stay residents with a urinary tract infection 1.8%
13% better than Tennessee average

Tennessee average: 2.1%

Lost Too Much Weight Info Percent of long-stay residents who lose too much weight 8.5%
35% worse than Tennessee average

Tennessee average: 6.3%

Depressive Symptoms Info Percent of long-stay residents who have depressive symptoms 4.0%
64% better than Tennessee average

Tennessee average: 11.0%

Antipsychotic Use Info Percent of long-stay residents who received an antipsychotic medication 18.3%
11% worse than Tennessee average

Tennessee average: 16.5%

Pneumococcal Vaccine Info Percent of long-stay residents assessed and appropriately given the pneumococcal vaccine 82.4%
8% worse than Tennessee average

Tennessee average: 89.9%

Influenza Vaccine Info Percent of long-stay residents assessed and appropriately given the seasonal influenza vaccine 98.7%
In line with Tennessee average

Tennessee average: 94.5%

Short-stay resident measures
Pneumococcal Vaccine Info Percent of short-stay residents assessed and appropriately given the pneumococcal vaccine 73.1%
8% worse than Tennessee average

Tennessee average: 79.7%

Antipsychotic medication increase Info Percent of short-stay residents who newly received an antipsychotic medication 0.0%
100% better than Tennessee average

Tennessee average: 1.7%

Influenza Vaccine Info Percent of short-stay residents assessed and appropriately given the seasonal influenza vaccine 81.0%
In line with Tennessee average

Tennessee average: 79.8%

Penalties and fines

Federal penalties imposed by CMS for regulatory violations, including civil money penalties (fines) and denials of payment for new Medicare/Medicaid admissions.

Source: CMS Penalties Database (Data as of Jan 2026)

Total fines amount $214K
148% higher than Tennessee average

Tennessee average: $86K

Number of fines 1
43% fewer fines than Tennessee average

Tennessee average: 1.7

Payment Denials Info Serious action where Medicare and/or Medicaid temporarily stops payments for new residents until issues are fixed. 1
96% more payment denials than Tennessee average

Tennessee average: 0.5

Fines amount comparison
This facility $214K
Tennessee average $86K
Penalty History

Penalties are imposed by CMS for violations of federal nursing home regulations.

Civil Money Penalty Info Fines imposed for noncompliance, which can be assessed per day or per instance of violation. Oct 11, 2023
$214K
Payment Denial Info Serious action where Medicare and/or Medicaid temporarily stops payments for new residents until issues are fixed. Oct 11, 2023
63 days

Last updated: Jan 2026

Guides for Better Senior Living

Care Cost Calculator: See Prices in Your Area

Nursing Home Data Explorer

Don’t Wait Too Long: 7 Red Flag Signs Your Parent Needs Assisted Living Now

The True Cost of Assisted Living in 2025 – And How Families Are Paying For It

Understanding Senior Living Costs: Pricing Models, Discounts & Financial Assistance

Financial Aid for Tennessee Seniors

Get financial aid guidance

CHOICES Program

TN Medicaid CHOICES

Age 65+ or disabled, Tennessee resident, Medicaid-eligible, nursing home-level care need.

~$2,829/month (300% FBR, individual).

$2,000 (individual), $3,000 (couple).

Managed care model; high rural demand.

Tennessee Options for Community Living

TN Options

Age 60+, Tennessee resident, at risk of nursing home.

~$2,000/month (individual, varies).

$5,000 (individual).

Limited funding; rural/urban balance.

Medicare Savings Program (MSP)

Tennessee Medicare Savings Program

Age 65+ or disabled, TN resident, Medicare Part A/B.

~$2,510/month (QMB), ~$3,380/month (SLMB), ~$3,598/month (QI)—individual.

$9,430 (individual), $14,130 (couple).

Three tiers; includes Extra Help for Part D; no waitlist.

Low-Income Home Energy Assistance Program (LIHEAP)

Tennessee LIHEAP

Age 60+ prioritized, TN resident, low-income household.

~$3,970/month (individual, 185% FPL).

Not assessed; income-focused.

Covers gas, electric, propane; emergency aid available.

Family Caregiver Support Program (FCSP)

Tennessee Family Caregiver Support Program

Caregivers of 60+ needing care or 55+ caregivers of others; TN resident; functional needs (2+ ADLs).

No strict cap; prioritizes low-income (~$24,980/year).

Not assessed; need-based.

Includes grandparent caregivers; high rural demand.

Senior Community Service Employment Program (SCSEP)

Tennessee SCSEP

Age 55+, unemployed, low-income, TN resident.

~$1,983/month (125% FPL).

Not specified; income-focused.

Priority for veterans, rural residents; AARP/Goodwill partnership.

VA Aid and Attendance (A&A) and Housebound Benefits

Tennessee VA Aid and Attendance/Housebound

Age 65+ or disabled veteran/spouse, TN resident, wartime service, need for ADL help (A&A) or homebound.

Net income < ~$1,984/month (veteran with dependent, A&A); pension offsets income.

~$155,356 (net worth limit).

High veteran population; supports rural/urban care needs.

Elderly Nutrition Program

Tennessee Elderly Nutrition Program

Age 60+, TN resident; no income limit but prioritizes low-income.

None; donations encouraged.

Not assessed.

Serves ~50,000 annually; 200+ congregate sites plus Meals on Wheels.

Property Tax Relief Program

Tennessee Property Tax Relief Program

Age 65+, TN resident, homeowner/renter (or widow/er 50+, disabled 18+).

~$45,000/year (household, excludes half of Social Security).

Not assessed; income-focused.

Rebates up to $1,000; serves ~100,000 annually.

Who we are

Your Senior Care Partner, Every Step of the Way

We help families find affordable senior communities and unlock same day discounts, Medicaid, and Medicare options tailored to your needs.

Contact us Today
Tour Icon
Planning a tour? Check our touring checklist.
Chat Icon
Thinking of living here? We can help you speak to a current resident