

Total health inspections
4
Massachusetts average 4.5
Last Health inspection on Dec 2024

We arrange tours, appointments, and even moving support so you don’t have to
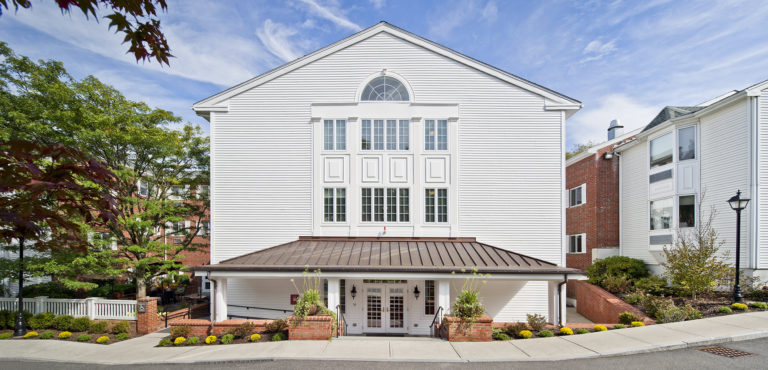
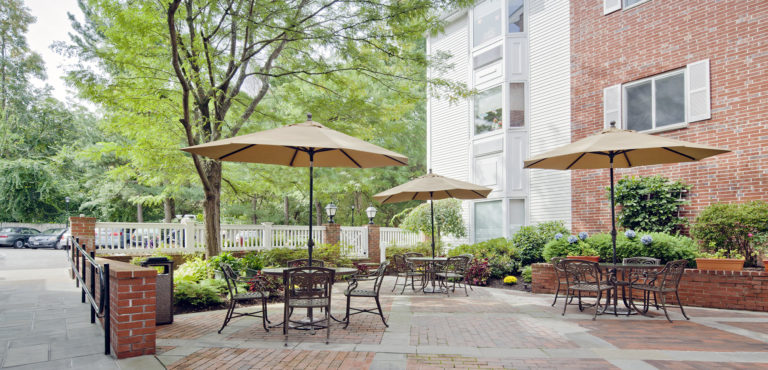
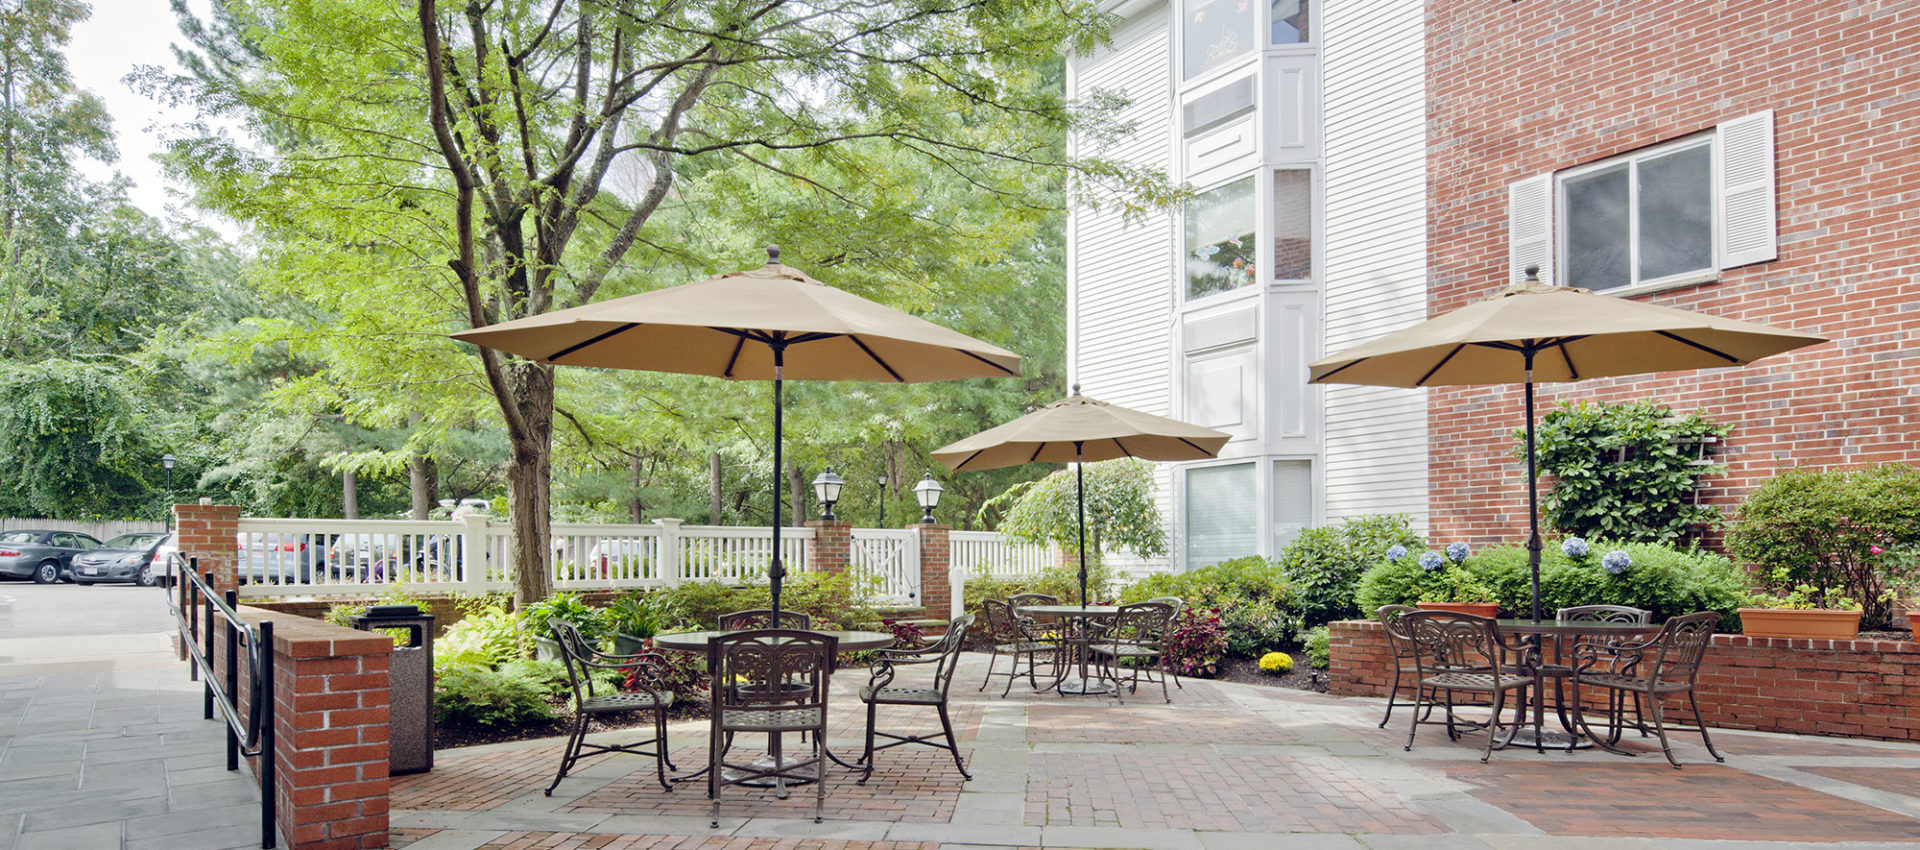

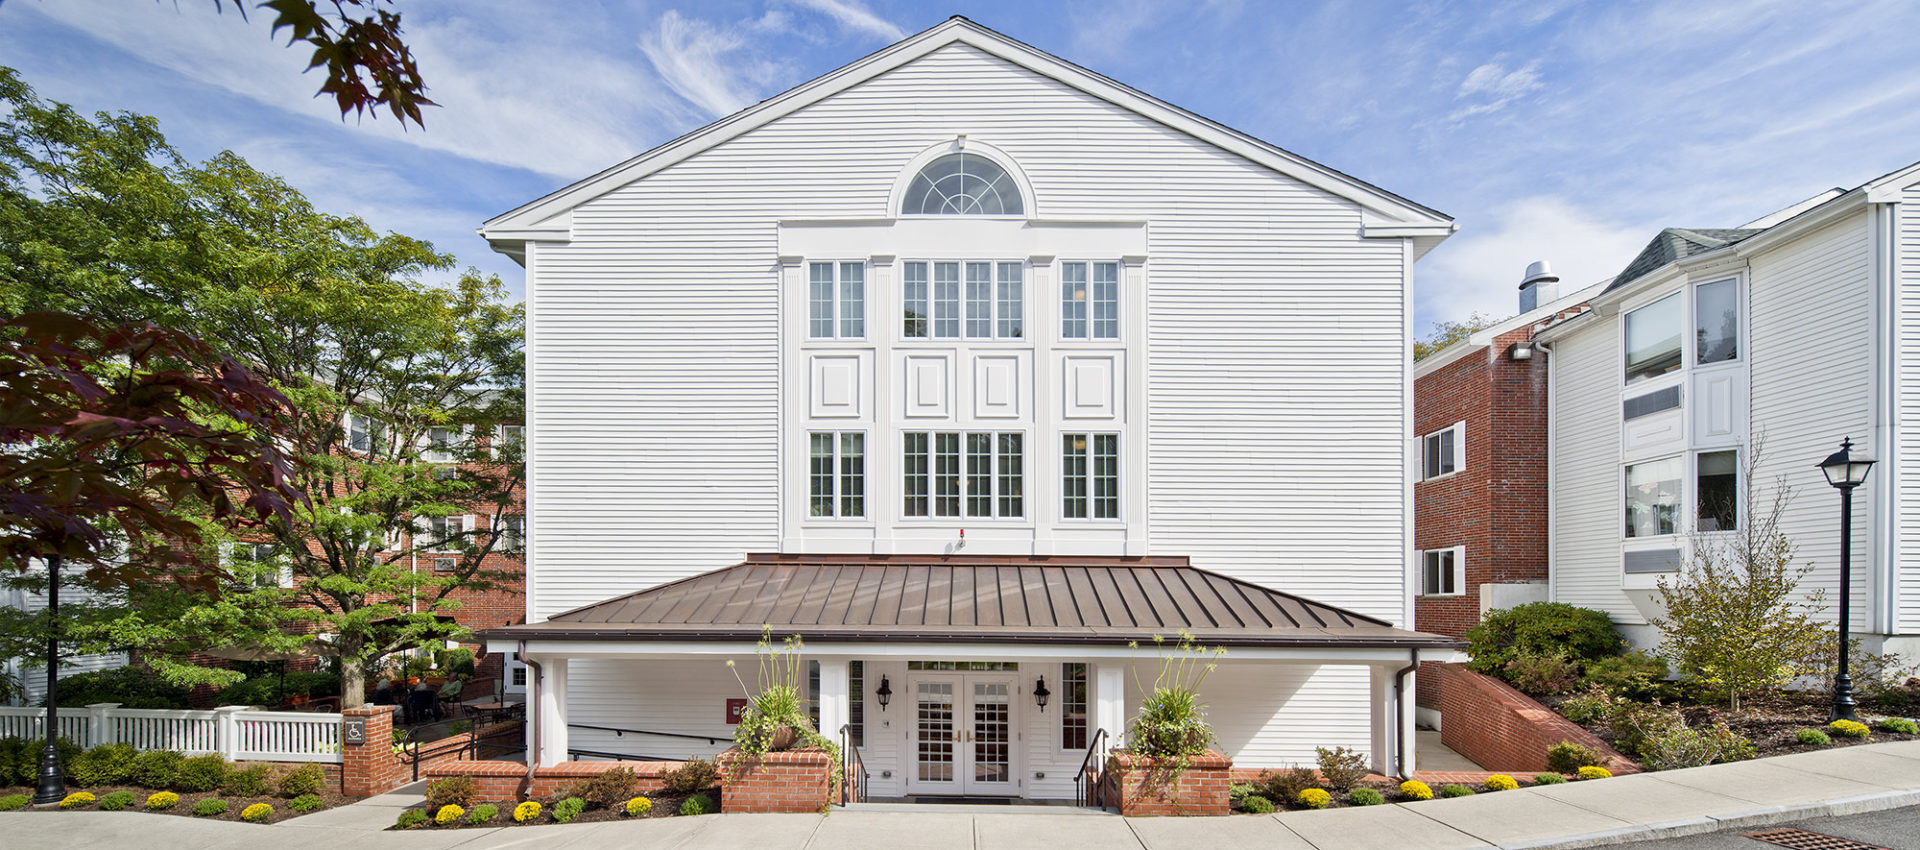


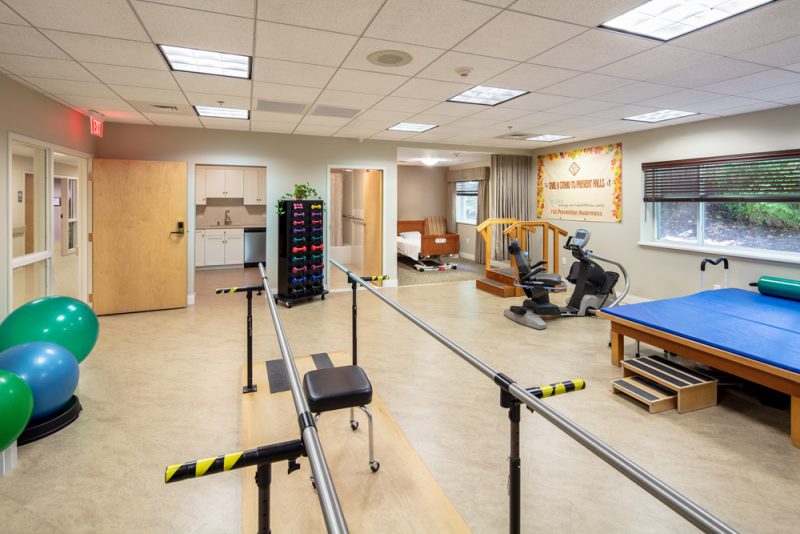
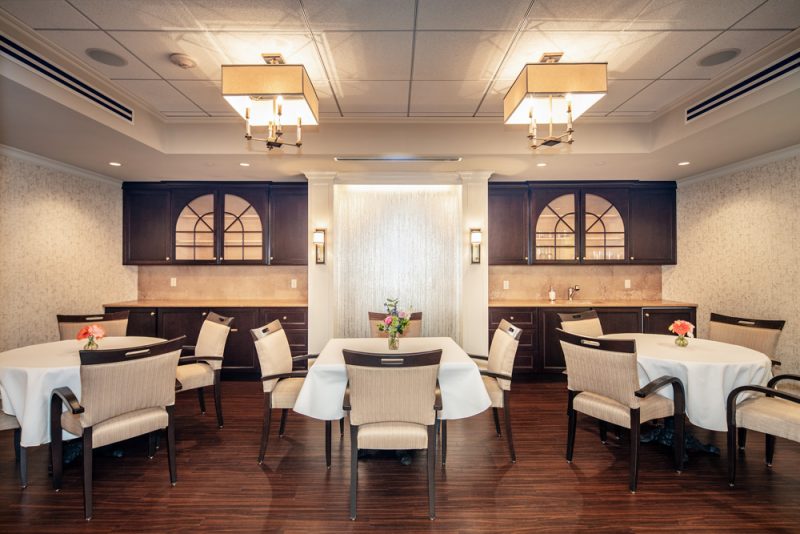
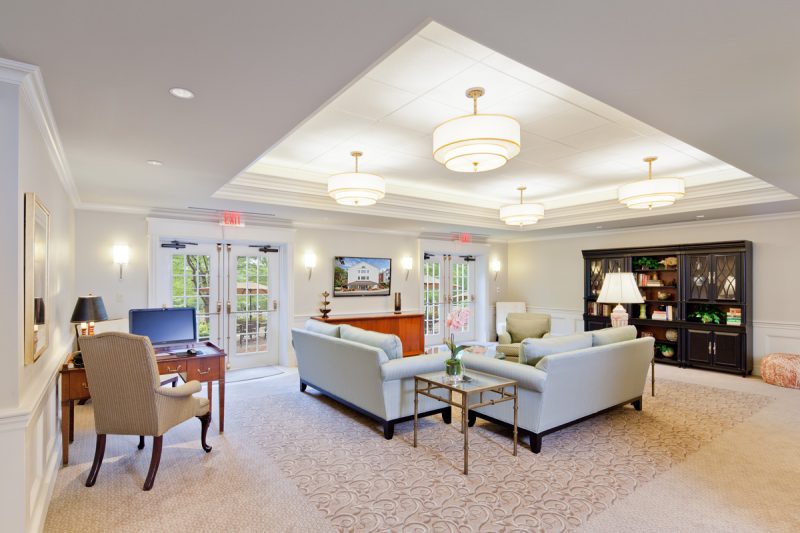

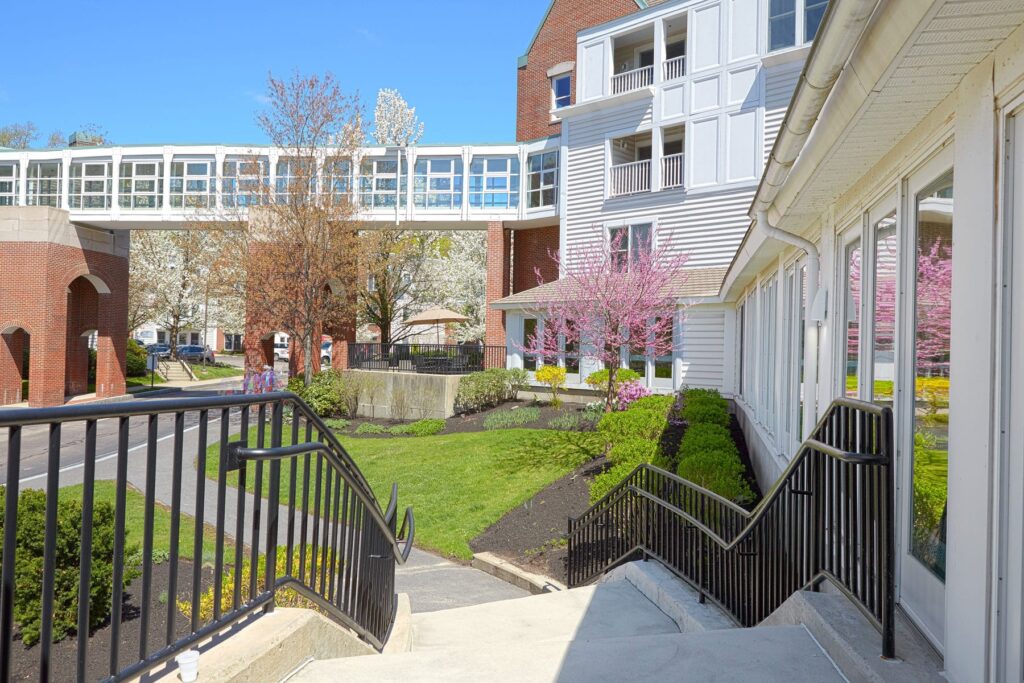
Belmont Manor is an idyllic community located near recreation sites and convenient local amenities on Agassiz Avenue, Belmont, MA, that offers skilled nursing. The community features a wide range of care options, including podiatry, respite care, short-term rehabilitation, and therapy services, alongside Alzheimer’s special care unit, ensuring residents can find the care they need. As a Medicaid- and Medicare-certified community, the community strives to ease residents’ financial challenges.
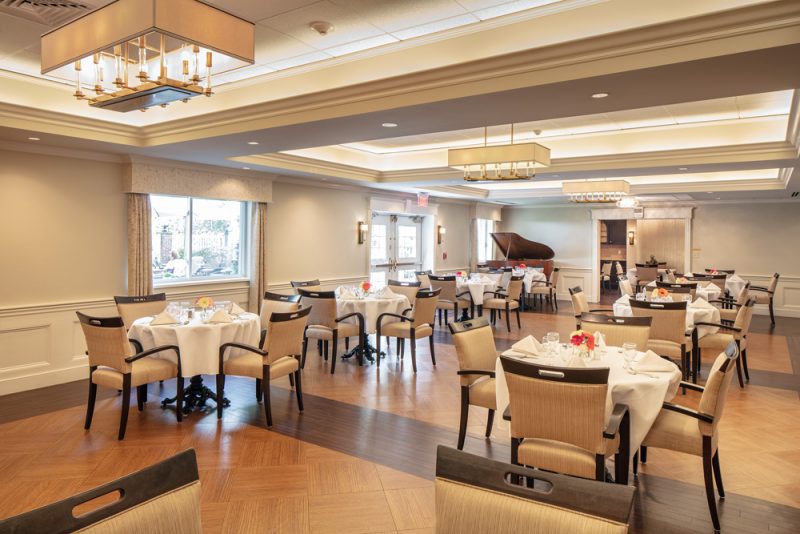
Aside from their healthcare needs, the community also conducts fun recreational activities and engaging social events to keep residents active and happy. Accommodating residents’ dietary needs, dietitian-approved meals are served for a delightful dining experience. The community is great for those who need supplementary care to live comfortably in their golden years.
Stewart A. Karger has been the Administrator of Belmont Manor Nursing & Rehabilitation Center since 1985, continuing a family legacy. He leads department heads to ensure residents receive the highest quality care and maintains an open-door policy for resident and staff concerns. Stewart has been part of the community since 1979, dedicated to fulfilling the mission of Belmont Manor.
 Official CMS rating based on health inspections, staffing and quality measures.
Official CMS rating based on deficiencies found during state health inspections.
Official CMS rating based on nurse staffing hours per resident per day.
Official CMS rating based on clinical outcomes for residents.
Average daily nursing hours per resident (adjusted for acuity). Higher values indicate more nursing time per resident.
Official CMS rating based on health inspections, staffing and quality measures.
Official CMS rating based on deficiencies found during state health inspections.
Official CMS rating based on nurse staffing hours per resident per day.
Official CMS rating based on clinical outcomes for residents.
Average daily nursing hours per resident (adjusted for acuity). Higher values indicate more nursing time per resident.
Offers a balance of services and community atmosphere.
That suggests steady demand, but availability may be limited.
Most residents typically stay for a few weeks or months before returning home or moving on.
75% of new residents, usually for short-term rehab.
24% of new residents, often for short stays.
1% of new residents, often for long-term daily care.
The portion of the home's budget spent on staff, including nurses, caregivers, and other employees who support care and operations.
All remaining costs needed to run the home, such as food, utilities, building maintenance, supplies and administrative expenses.
Key information about the people who lead and staff this community.
Accept Medicaid: Yes
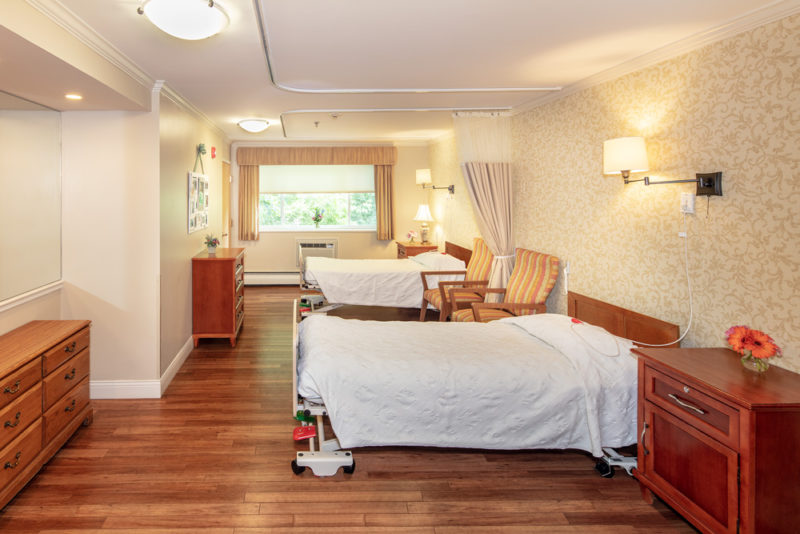
Housing Options: Private / 2 Bed Rooms
Building Type: 3-story
Dining Services
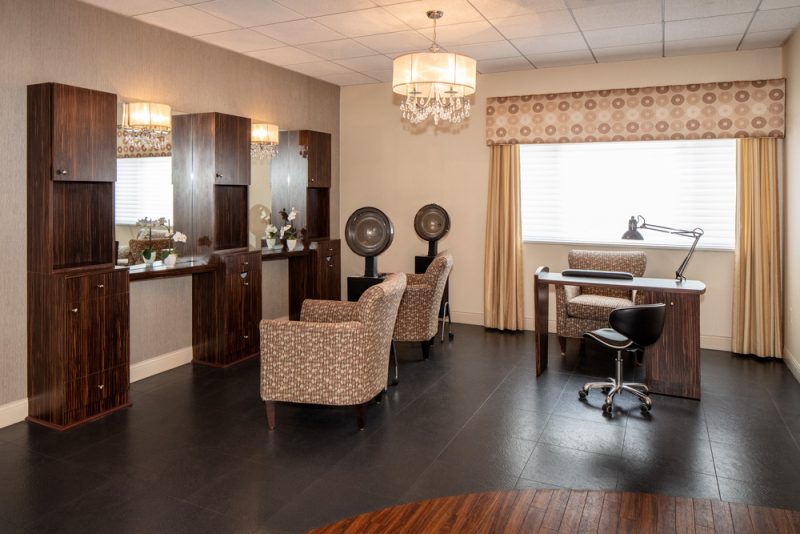
Beauty Services
Housekeeping Services
Recreational Activities
Exercise Programs
Ways to qualify for care at this community, including accepted programs and payment options.
This facility is certified for eligible Medicaid services.
Nursing Homes 24/7 care needed
Nursing Homes 24/7 care needed
Nursing Homes 24/7 care needed
Memory Care Specialized care for those with Memory Loss, Alzheimer's, or dementia, ensuring safety and support.
Nursing Homes 24/7 care needed
Nursing Homes 24/7 care needed
 Lasell Village
 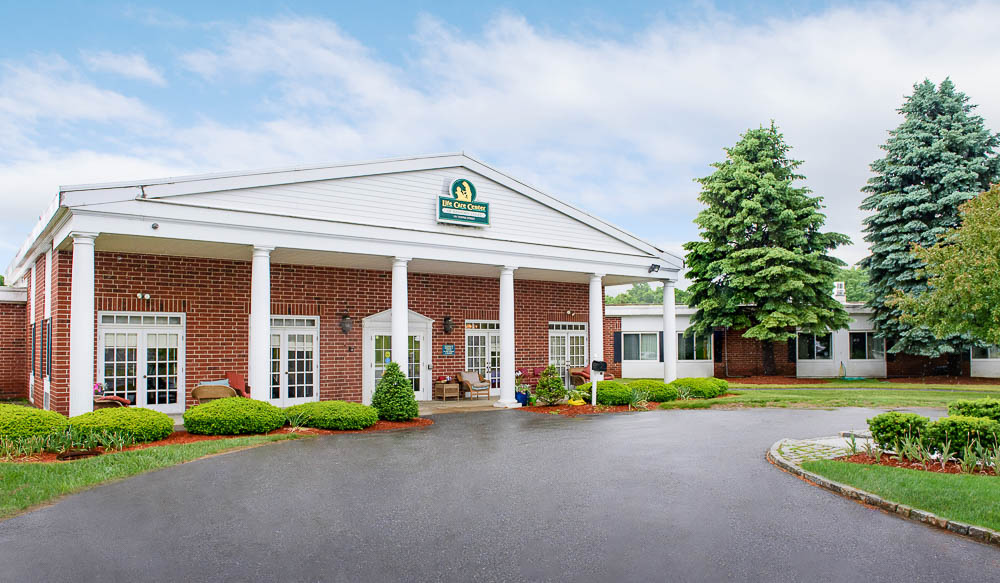 Life Care Center of Nashoba Valley
  Life Care Center of Acton
Belmont Manor Nursing & Rehabilitation Center
Life Care Center of Acton
Belmont Manor Nursing & Rehabilitation Center 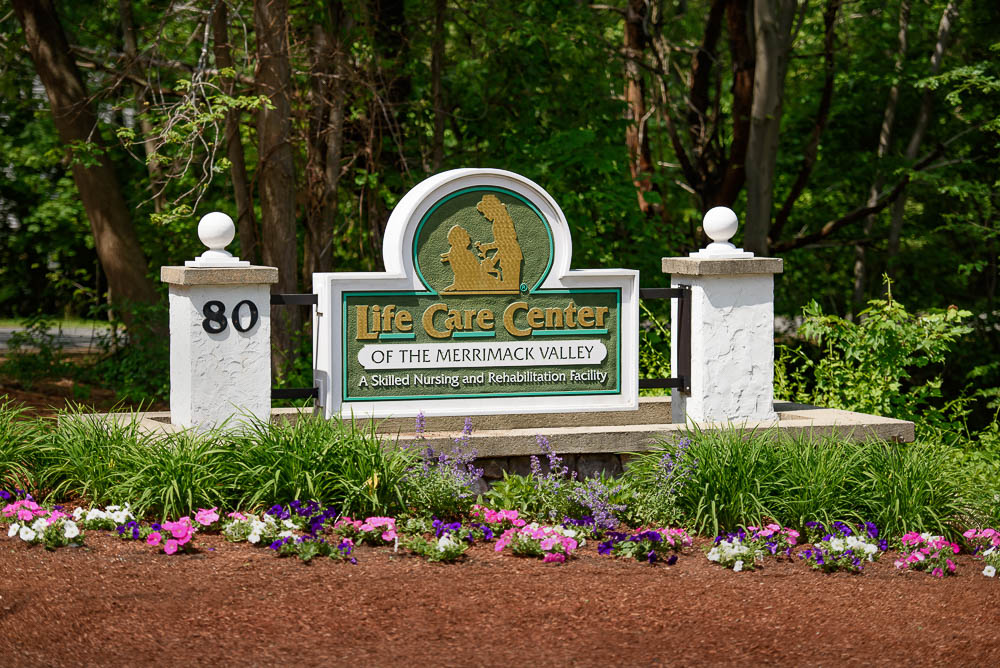 Life Care Center of Merrimack Valley
![]() 1.3 miles from city center
1.3 miles from city center
![]() 34 Agassiz Ave, Belmont, MA 02478
34 Agassiz Ave, Belmont, MA 02478
Add your location
Source: CMS Payroll-Based Journal (Q2 2025)
| Role ⓘ | Count ⓘ | Avg Shift (hrs) ⓘ | Uses Contractors? ⓘ |
|---|---|---|---|
| Registered Nurse | 32 | 8.8 | Yes |
| Licensed Practical Nurse | 29 | 8.2 | Yes |
| Certified Nursing Assistant | 76 | 8.1 | No |
| Role ⓘ | Employees ⓘ | Contractors ⓘ | Total Staff ⓘ | Total Hours ⓘ | Days Worked ⓘ | % of Days ⓘ | Avg Shift (hrs) ⓘ |
|---|---|---|---|---|---|---|---|
| Certified Nursing Assistant | 76 | 0 | 76 | 33,659 | 91 | 100% | 8.1 |
| Licensed Practical Nurse | 24 | 5 | 29 | 7,097 | 91 | 100% | 8.2 |
| Registered Nurse | 12 | 20 | 32 | 4,832 | 91 | 100% | 8.8 |
| Clinical Nurse Specialist | 7 | 0 | 7 | 2,579 | 83 | 91% | 7.9 |
| Other Dietary Services Staff | 6 | 0 | 6 | 2,091 | 91 | 100% | 7.1 |
| Physical Therapy Assistant | 5 | 0 | 5 | 1,046 | 79 | 87% | 5.9 |
| Respiratory Therapy Technician | 6 | 0 | 6 | 915 | 84 | 92% | 6.2 |
| RN Director of Nursing | 2 | 0 | 2 | 830 | 67 | 74% | 7.3 |
| Nurse Practitioner | 1 | 0 | 1 | 460 | 61 | 67% | 7.5 |
| Administrator | 1 | 0 | 1 | 443 | 59 | 65% | 7.5 |
| Dental Services Staff | 1 | 0 | 1 | 418 | 58 | 64% | 7.2 |
| Speech Language Pathologist | 1 | 0 | 1 | 402 | 49 | 54% | 8.2 |
| Physical Therapy Aide | 1 | 0 | 1 | 387 | 62 | 68% | 6.2 |
| Occupational Therapy Aide | 1 | 0 | 1 | 340 | 55 | 60% | 6.2 |
| Qualified Social Worker | 0 | 1 | 1 | 314 | 48 | 53% | 6.5 |
| Mental Health Service Worker | 1 | 0 | 1 | 306 | 45 | 49% | 6.8 |
| Medical Director | 0 | 2 | 2 | 54 | 6 | 7% | 9 |
Massachusetts average 4.5
Last Health inspection on Dec 2024
Health citations are formal notices following inspections when they fail to comply with safety and care standards.
27 of 28 citations resulted from standard inspections; and 1 of 28 resulted from complaint investigations.
Massachusetts average: 0.3
Massachusetts average: 1.5
Data sourced from CMS Health Deficiencies reports. Citation severity codes range from A (least serious) to L (most serious). Immediate Jeopardy (J-L) citations indicate situations where the facility's noncompliance has placed residents at risk of death or serious harm.
Source: CMS Long-Term Care Facility Characteristics (Data as of Jan 2026)
Active councils help families stay involved in care decisions and facility operations.
These measures show how residents usually do over time at this home, based on health outcomes and preventive care.
Massachusetts average: 10.2
Massachusetts average: 20.0
Massachusetts average: 18.7%
Massachusetts average: 19.3%
Massachusetts average: 22.1%
Massachusetts average: 3.6%
Massachusetts average: 4.7%
Massachusetts average: 2.1%
Massachusetts average: 5.2%
Massachusetts average: 10.7%
Massachusetts average: 20.3%
Massachusetts average: 91.9%
Massachusetts average: 94.8%
Massachusetts average: 1.86
Massachusetts average: 1.54
Massachusetts average: 76.7%
Massachusetts average: 1.3%
Massachusetts average: 77.7%
Massachusetts average: 25.8%
Massachusetts average: 11.8%
Massachusetts average: 0.8%
Massachusetts average: 53.7%
Massachusetts average: 50.6%
Quality measures are calculated from Minimum Data Set (MDS) assessments. For most measures, lower percentages indicate better care quality.
Federal penalties imposed by CMS for regulatory violations, including civil money penalties (fines) and denials of payment for new Medicare/Medicaid admissions.
Source: CMS Penalties Database (Data as of Jan 2026)
Massachusetts average: $72K
Massachusetts average: 1.7
Massachusetts average: 0.1
Penalties are imposed by CMS for violations of federal nursing home regulations.
Last updated: Jan 2026
Historical financial and operational data for Belmont Manor Nursing & Rehabilitation Center based on CMS SNF Cost Reports.
Loading trend charts...
Care Cost Calculator: See Prices in Your Area
Nursing Home Data Explorer
Don’t Wait Too Long: 7 Red Flag Signs Your Parent Needs Assisted Living Now
The True Cost of Assisted Living in 2025 – And How Families Are Paying For It
Understanding Senior Living Costs: Pricing Models, Discounts & Financial Assistance

We help families find affordable senior communities and unlock same day discounts, Medicaid, and Medicare options tailored to your needs.
Contact us Today
Touring a community? Use this expert-backed checklist to stay organized, ask the right questions, and find the perfect fit.
We'll send you a PDF version of the touring checklist.


