Explore Open Rooms

1 Contact details
2 What type of senior care service are you looking for?
3 What budget do you have in mind for senior care?
4 How soon do you need to find care?
5 Additional details

Thank you for your interest!

Our team will be in touch shortly to help with next steps.

Nursing Home

Berlin Health & Rehabilitation Center

Nursing Home

Berlin Health & Rehabilitation Center

98 Hospitality Dr, Barre, VT 05641 View map
Overview of Berlin Health & Rehabilitation Center

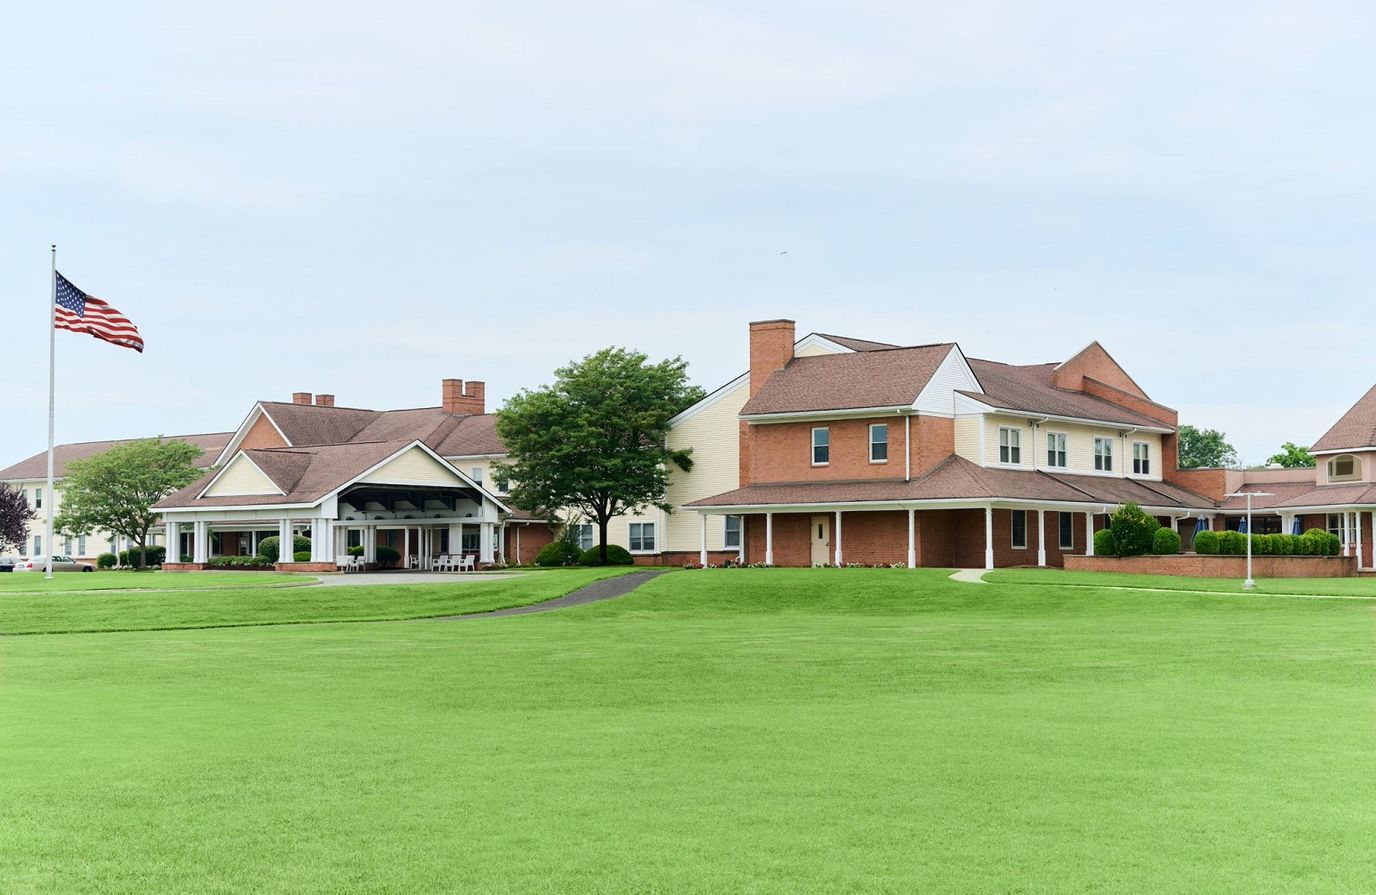
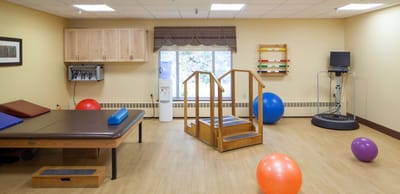
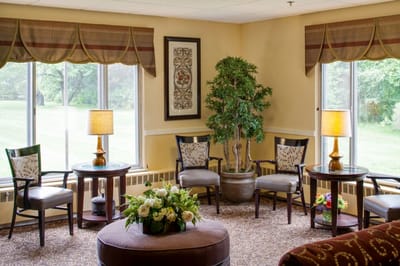
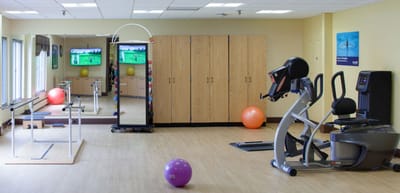
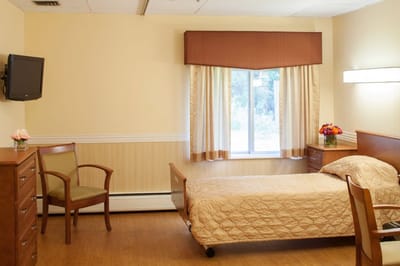
Located in Barre, VT, Berlin Health & Rehabilitation Center is a high-quality skilled nursing and rehabilitative care provider for its residents. The focus is on personalized care, offering both short-term and long-term care, respite care, and rehabilitation services within this nursing home community. With a 24-hour awake staff, a nutritionist, an onsite nurse available for 8 hours a day, and comprehensive medication management, your loved ones receive prioritized and attentive care. Residents have access to transportation for appointments, outings, and other necessary trips. The center features a sunroom serving as a relaxing hub where residents can bask in the sun, participate in activities, or unwind while connecting with friends and family.

Berlin Health and Rehabilitation Center takes pride in its housekeeping, fostering a clean and comfortable environment that promotes the well-being and comfort of residents. Additional amenities include activities, pet-friendly spaces, a barber shop, a beauty salon, a media center, common rooms, and an indoor atrium.

(802) 229-0308

Staffing hours breakdown

Info Hours of care per resident per day, broken down by staff type. Data from CMS Medicare.
Staff type Facility State avg National avg
Registered Nurse (RN) Info Registered nurse hours per resident per day. 35m per day 49m per day 41m per day
Nurse Aide Info Nurse aide hours per resident per day. 2h 19m per day 2h 35m per day 2h 21m per day
Total Nursing (Weekend) Info Total number of nurse staff hours per resident per day on weekends. 3h 19m per day 3h 41m per day 3h 26m per day
Physical Therapist Info Physical therapist staff hours per resident per day. 12m per day 6m per day 4m per day
RN (Weekend) Info Registered nurse hours per resident per day on weekends. 17m per day 32m per day 29m per day

Capacity and availability

Medium-capacity home

Offers a balance of services and community atmosphere.

Total beds 115

This home usually has availability

Lower occupancy suggests more openings may be available.

Lower demand than the Vermont average
Occupancy rate 65.7%
Residents per day (avg) 72
Occupancy rate
65.7%
Residents per day (avg)
72

Who this home usually serves

TYPE OF STAY

Mostly short-term rehab stays

Most residents typically stay for a few weeks or months before returning home or moving on.

Might be optimal for
Short stays Recovery Medicare-covered care

Breakdown by payment type

Medicare

62% of new residents, usually for short-term rehab.

Typical stay 1 - 2 months

Private pay

28% of new residents, often for short stays.

Typical stay 2 - 3 months

Medicaid

10% of new residents, often for long-term daily care.

Typical stay 3 - 4 years

Finances and operations

Privately-owned community
Operated by a business corporation.
Home revenue
$11.1M
Operating loss
-$494.0K
Privately-owned community Operated by a business corporation.
Home revenue
$11,065,613.00
Operating loss
$-493,969.00
Payroll costs Info The portion of the home's budget spent on staff, including nurses, caregivers, and other employees who support care and operations.
$1.7M
15% of revenue
Other operating costs Info All remaining costs needed to run the home, such as food, utilities, building maintenance, supplies and administrative expenses.
$9.9M
Total costs $11.6M
Walk Score
Walk Score: 21 / 100
Car-dependent. Most errands require a car, with limited nearby walkable options.

About this community

License details

Facility type
Nursing Home
County: Washington

Care Services

Provides Memory Care

Contact Information

Fax: 802-223-4864

Types of Care at Berlin Health & Rehabilitation Center

Skilled Nursing Memory Care Respite Care Hospice Care
Contact Berlin Health & Rehabilitation Center

Inspection History

In Vermont, the Department of Disabilities, Aging and Independent Living is the authority responsible for inspecting facilities and investigating complaints to protect resident well-being.

Health Inspection History

Inspections
Total health inspections 16

Vermont average 6.5


Last Health inspection on Aug 2025

Total health citations 83

Vermont average 28.9

Citations per inspection
5.19

Vermont average 4.31


Health citations are formal notices following inspections when they fail to comply with safety and care standards.

29 of 83 citations resulted from standard inspections; 45 of 83 resulted from complaint investigations; and 9 of 83 came from combined inspections (standard and complaint).

Breakdown of citation severity (last 3 years)
Critical Health citations More info 1
43% worse than Vermont average

Vermont average: 0.7


Serious Health citations More info 9
374% worse than Vermont average

Vermont average: 1.9

1 critical citation More info Vermont average: 0.7

9 serious citations More info Vermont average: 1.9

72 moderate citations More info Vermont average: 24.6

1 minor citation More info Vermont average: 1.5
Citations history (last 3 years)
Infection Control moderate citation Info Issues related to preventing and controlling infections, including hygiene practices and safety protocols. Aug 06, 2025
Corrected

Nutrition moderate citation Info Issues related to food quality, meal service, and resident's nutritional needs. Aug 06, 2025
Corrected

Pharmacy moderate citation Info Issues related to medication management, including how drugs are stored, administered, and monitored. Aug 06, 2025
Corrected

Quality of Care moderate citation Info Issues related to how well residents receive appropriate treatment and support for their medical and daily care needs. Aug 06, 2025
Corrected

Compare Nursing Homes around Barre The information below is reported by the Vermont Department of Disabilities, Aging and Independent Living.

2 facilities compared · CMS & VT Dept. of Health data · Updated Mar 2026

Barre Gardens
AL

Assisted Living A licensed, long-term care setting for seniors or individuals with disabilities who need help with daily activities — like bathing, dressing, and medication management — but not 24-hour skilled nursing. Offers housing, meals, and around-the-clock support while aiming to maximize resident independence.

HC

Home Care Professional care delivered in the person's own home — from companionship and errands to skilled nursing and therapy. Allows seniors to age in place. Medicare covers skilled home health when medically necessary.

NH

Nursing Home Licensed facility providing 24/7 skilled nursing care for residents with complex, ongoing medical needs. Staffed by RNs, LPNs, and CNAs. Inspected and star-rated annually by CMS. Accepts Medicare (short-term rehab) and Medicaid (long-term care).

RC

Respite Care Short-term temporary care — days to weeks — to give family caregivers a break. Full care provided during the stay. Often used after hospitalization or to trial a facility before a permanent placement decision.

Barre
96
92.9%
+15%
4.04
-44%
-5%
1
51
0
78
7
Moxley, Amanda
$15,4M
$3,2M
20.5%
475037
Berlin Health & Rehabilitation Center
-
HC

Home Care Professional care delivered in the person's own home — from companionship and errands to skilled nursing and therapy. Allows seniors to age in place. Medicare covers skilled home health when medically necessary.

MC

Memory Care Secured, specialized care for people living with Alzheimer's or dementia. Staff trained in cognitive impairment, with higher staff-to-resident ratios and an environment designed to reduce confusion and wandering risk.

NH

Nursing Home Licensed facility providing 24/7 skilled nursing care for residents with complex, ongoing medical needs. Staffed by RNs, LPNs, and CNAs. Inspected and star-rated annually by CMS. Accepts Medicare (short-term rehab) and Medicaid (long-term care).

RC

Respite Care Short-term temporary care — days to weeks — to give family caregivers a break. Full care provided during the stay. Often used after hospitalization or to trial a facility before a permanent placement decision.

Barre
115
65.7%
-19%
3.92
-
-
-
-46%
-8%
5
83
10
72
21
-
$10,9M
$1,7M
15.2%
475020

Places of interest near Berlin Health & Rehabilitation Center

Address 5.2 miles from city center — 0.38 miles to nearest hospital (Robert R. Davidson, PA)

Address 98 Hospitality Dr, Barre, VT 05641

Calculate Travel Distance to Berlin Health & Rehabilitation Center

Add your location

Address

Staffing Data (Q2 2025)

This data corresponds to Q2 2025 and is based on CMS Payroll-Based Journal.

Total staff 94
Employees 42
Contractors 52
Staff to resident ratio 1.31:1
20% worse than Vermont average

Vermont average ratio: 1.63:1

Avg staff/day 39
Average shift 9.1 hours
11% better than Vermont average

Vermont average: 8.2 hours

Total staff hours (quarter) 32,379
Nursing staff breakdown
Registered Nurse

Manages medical care and health needs.

Total count 6
Average shift length Info Average shift length. Calculated as total hours divided by days worked and average staff per day. 8.6 hours

This role is partially covered by contractors.

Licensed Practical Nurse

Assists with medical care and medications.

Total count 17
Average shift length Info Average shift length. Calculated as total hours divided by days worked and average staff per day. 10.3 hours

This role is partially covered by contractors.

Certified Nursing Assistant

Helps with daily care and mobility.

Total count 44
Average shift length Info Average shift length. Calculated as total hours divided by days worked and average staff per day. 9.9 hours

This role is partially covered by contractors.

Contractor staffing

Total hours from contractors

60.9%

19,717 contractor hours this quarter

Certified Nursing Assistant: 33 Licensed Practical Nurse: 16 Registered Nurse: 2 Physical Therapy Assistant: 1
Staff by category
Certified Nursing Assistant11334415,81491100%9.9
Licensed Practical Nurse116176,08091100%10.3
Registered Nurse4262,33791100%8.6
Other Dietary Services Staff4041,4148593%7.5
Respiratory Therapy Technician4041,2757684%7.5
Clinical Nurse Specialist2028086167%8
Physical Therapy Aide4046377380%5.9
Speech Language Pathologist1016056369%9.6
Dietitian1016036875%8.9
Administrator1015206571%8
Mental Health Service Worker1015076268%8.2
Nurse Practitioner1015046369%8
Therapeutic Recreation Specialist1014996571%7.7
Physical Therapy Assistant3144806066%7.8
Dental Services Staff1011842527%7.3
Qualified Social Worker2021151921%6
44 Certified Nursing Assistant
% of Days 100%
17 Licensed Practical Nurse
% of Days 100%
6 Registered Nurse
% of Days 100%
4 Other Dietary Services Staff
% of Days 93%
4 Respiratory Therapy Technician
% of Days 84%
2 Clinical Nurse Specialist
% of Days 67%
4 Physical Therapy Aide
% of Days 80%
1 Speech Language Pathologist
% of Days 69%
1 Dietitian
% of Days 75%
1 Administrator
% of Days 71%
1 Mental Health Service Worker
% of Days 68%
1 Nurse Practitioner
% of Days 69%
1 Therapeutic Recreation Specialist
% of Days 71%
4 Physical Therapy Assistant
% of Days 66%
1 Dental Services Staff
% of Days 27%
2 Qualified Social Worker
% of Days 21%

Facility Characteristics

Source: CMS Long-Term Care Facility Characteristics (Data as of Jan 2026)

Total census
72 residents
Residents by payment source
Medicare
13 residents (18.1%)
Medicaid
41 residents (56.9%)
Private pay or other
18 residents (25%)
Programs & Services
Residents' Group

Residents meet regularly to discuss policies, care quality, and activities

Family Member Group

Family members meet regularly to discuss policies, care quality, and activities

Active Family Council

Organized group of family members that meets regularly to discuss facility policies, resident care, and activities.

Active Resident Council

Organized group of residents that meets regularly to discuss facility policies, quality of life, and activities.

Quality of care over time

These measures show how residents usually do over time at this home, based on health outcomes and preventive care.

High-risk clinical events score Info A composite score based on pressure ulcers, falls with injury, weight loss, walking ability decline, and activities of daily living decline. 10.1
14% better than Vermont average

Vermont average: 11.6

Functional decline score Info A composite score based on activities of daily living decline, walking ability decline, and incontinence. 21.3
6% better than Vermont average

Vermont average: 22.7

Long-stay resident measures
Need for Help with Daily Activities Increased Info Percent of long-stay residents whose need for help with daily activities has increased 16.7%
18% better than Vermont average

Vermont average: 20.4%

Walking Ability Worsened Info Percent of long-stay residents whose ability to move independently worsened 17.6%
12% better than Vermont average

Vermont average: 20.1%

Low Risk Residents with Bowel/Bladder Incontinence Info Percent of low risk long-stay residents who lose control of their bowels or bladder 29.6%
7% worse than Vermont average

Vermont average: 27.6%

Falls with Major Injury Info Percent of long-stay residents experiencing one or more falls with major injury 3.4%
43% better than Vermont average

Vermont average: 5.8%

High Risk Residents with Pressure Ulcers Info Percent of long-stay high risk residents with pressure ulcers 3.3%
49% better than Vermont average

Vermont average: 6.4%

Urinary Tract Infection Info Percent of long-stay residents with a urinary tract infection 3.1%
22% worse than Vermont average

Vermont average: 2.5%

Lost Too Much Weight Info Percent of long-stay residents who lose too much weight 9.4%
71% worse than Vermont average

Vermont average: 5.5%

Depressive Symptoms Info Percent of long-stay residents who have depressive symptoms 16.9%
69% worse than Vermont average

Vermont average: 10.0%

Antipsychotic Use Info Percent of long-stay residents who received an antipsychotic medication 17.4%
10% better than Vermont average

Vermont average: 19.4%

Pneumococcal Vaccine Info Percent of long-stay residents assessed and appropriately given the pneumococcal vaccine 99.5%
In line with Vermont average

Vermont average: 95.6%

Influenza Vaccine Info Percent of long-stay residents assessed and appropriately given the seasonal influenza vaccine 92.5%
5% worse than Vermont average

Vermont average: 97.6%

Hospitalizations per 1,000 days Info Number of hospitalizations per 1,000 long-stay resident days. 2.94
104% worse than Vermont average

Vermont average: 1.44

ED visits per 1,000 days Info Number of outpatient emergency department visits per 1,000 long-stay resident days. 3.30
33% worse than Vermont average

Vermont average: 2.48

Short-stay resident measures
Pneumococcal Vaccine Info Percent of short-stay residents assessed and appropriately given the pneumococcal vaccine 74.6%
14% worse than Vermont average

Vermont average: 86.3%

Antipsychotic medication increase Info Percent of short-stay residents who newly received an antipsychotic medication 2.3%
34% worse than Vermont average

Vermont average: 1.7%

Influenza Vaccine Info Percent of short-stay residents assessed and appropriately given the seasonal influenza vaccine 66.7%
16% worse than Vermont average

Vermont average: 78.9%

Re-hospitalized after SNF stay Info Percentage of short-stay residents who were re-hospitalized after their nursing home admission. 31.7%
47% worse than Vermont average

Vermont average: 21.5%

Emergency department visits Info Percentage of short-stay residents who had an outpatient emergency department visit. 11.0%
38% better than Vermont average

Vermont average: 17.6%

Falls with major injury Info Percentage of SNF residents who experience falls with major injury during their stay. 2.9%
282% worse than Vermont average

Vermont average: 0.8%

Ability to care for self at discharge Info Percentage of residents at or above expected ability to care for themselves at discharge. 28.2%
47% worse than Vermont average

Vermont average: 53.7%

Successful return to home or community Info Rate of successful return to home or community from a skilled nursing facility. 43.5%
14% worse than Vermont average

Vermont average: 50.6%

Penalties and fines

Federal penalties imposed by CMS for regulatory violations, including civil money penalties (fines) and denials of payment for new Medicare/Medicaid admissions.

Source: CMS Penalties Database (Data as of Jan 2026)

Total fines amount $390K
206% higher than Vermont average

Vermont average: $128K

Number of fines 5
182% more fines than Vermont average

Vermont average: 1.8

Payment Denials Info Serious action where Medicare and/or Medicaid temporarily stops payments for new residents until issues are fixed. 1
83% more payment denials than Vermont average

Vermont average: 0.5

Fines amount comparison
This facility $390K
Vermont average $128K
Penalty History

Penalties are imposed by CMS for violations of federal nursing home regulations.

Civil Money Penalty Info Fines imposed for noncompliance, which can be assessed per day or per instance of violation. May 8, 2025
$81K
Civil Money Penalty Info Fines imposed for noncompliance, which can be assessed per day or per instance of violation. Aug 19, 2024
$78K
Civil Money Penalty Info Fines imposed for noncompliance, which can be assessed per day or per instance of violation. Feb 1, 2024
$149K
Civil Money Penalty Info Fines imposed for noncompliance, which can be assessed per day or per instance of violation. May 24, 2023
$10K

Last updated: Jan 2026

Guides for Better Senior Living

Care Cost Calculator: See Prices in Your Area

Nursing Home Data Explorer

Don’t Wait Too Long: 7 Red Flag Signs Your Parent Needs Assisted Living Now

The True Cost of Assisted Living in 2025 – And How Families Are Paying For It

Understanding Senior Living Costs: Pricing Models, Discounts & Financial Assistance

Financial Aid for Vermont Seniors

Get financial aid guidance

Choices for Care

VT Medicaid CFC

Age 65+ or disabled, Vermont resident, Medicaid-eligible, nursing home-level care need.

~$2,829/month (300% FBR, individual).

$2,000 (individual), $3,000 (couple).

Small state; rural access emphasis.

Vermont Assistive Community Care Services (ACCS)

VT ACCS

Age 65+, Vermont resident, in approved residential setting.

~$1,732/month (individual, varies).

$2,000 (individual).

Facility-based; limited funding.

Older Americans Act (OAA) Services

Vermont OAA Services

Age 60+, VT resident; no income/asset limits.

None; donations encouraged.

Not assessed.

5 AAAs (Age Well, CVCOA, NEKCOA, Senior Solutions, SVCOA); rural focus.

Medicare Savings Program (MSP)

Vermont Medicare Savings Program

Age 65+ or disabled, VT resident, Medicare Part A/B.

~$2,510/month (QMB), ~$3,380/month (SLMB), ~$3,598/month (QI)—individual.

$9,430 (individual), $14,130 (couple).

Includes Extra Help for Part D; no waitlist.

Fuel Assistance Program

Vermont Seasonal Fuel Assistance

Age 60+ prioritized, VT resident, low-income household.

~$3,970/month (185% FPL).

Not assessed.

Covers oil, gas, wood; emergency aid available.

Family Caregiver Support Program (FCSP)

Vermont Family Caregiver Support Program

Caregivers of 60+ needing care or 55+ caregivers of others; VT resident; 2+ ADLs.

No strict cap; prioritizes low-income (~$24,980/year).

Not assessed.

Includes grandparent caregivers; serves ~1,000 annually.

Senior Community Service Employment Program (SCSEP)

Vermont SCSEP

Age 55+, unemployed, low-income, VT resident.

~$1,983/month (125% FPL).

Not specified.

Priority for veterans, rural residents; AARP partnership.

VA Aid and Attendance (A&A) and Housebound Benefits

Vermont VA Aid and Attendance/Housebound

Age 65+ or disabled veteran/spouse, VT resident, wartime service, ADL help (A&A) or homebound.

Net income < ~$1,984/month (veteran with dependent, A&A); pension offsets income.

~$155,356 (net worth).

High rural veteran use; supports care costs.

Property Tax Adjustment Assistance

Vermont Property Tax Credit

Age 65+ (or all ages), VT resident, homeowner/renter, income-based.

~$47,000/year (household); caps credit at ~$128,000.

Not assessed.

Credits up to $8,000; serves ~20,000 households.

Commodity Supplemental Food Program (CSFP)

Vermont CSFP

Age 60+, VT resident, low-income.

~$1,632/month (130% FPL).

Not assessed.

Serves ~5,000 seniors via 50+ drop sites.

Attendant Services Program (ASP)

Vermont Attendant Services Program

Age 65+ (or disabled 18+), VT resident, severe/permanent disability, 2+ ADL needs.

Medicaid-eligible (~$2,829/month) or near-eligible for General Fund.

$2,000 (individual) for Medicaid; varies for General Fund.

Participants hire/manage caregivers; serves ~500 annually.