Total health inspections
3
Tennessee average 3.5
Last Health inspection on Mar 2022

We arrange tours, appointments, and even moving support so you don’t have to
Thank you for your interest!
Our team will be in touch shortly to help with next steps.


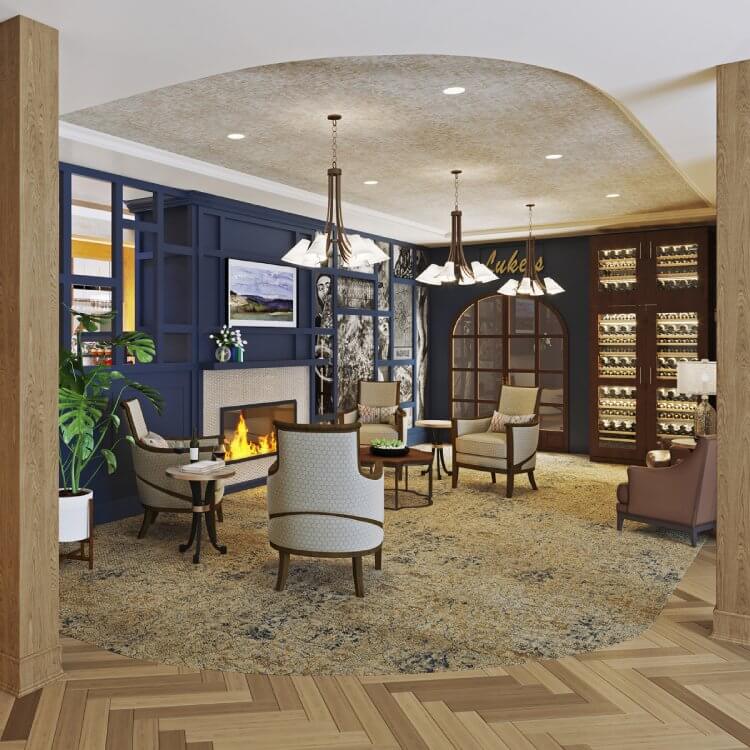
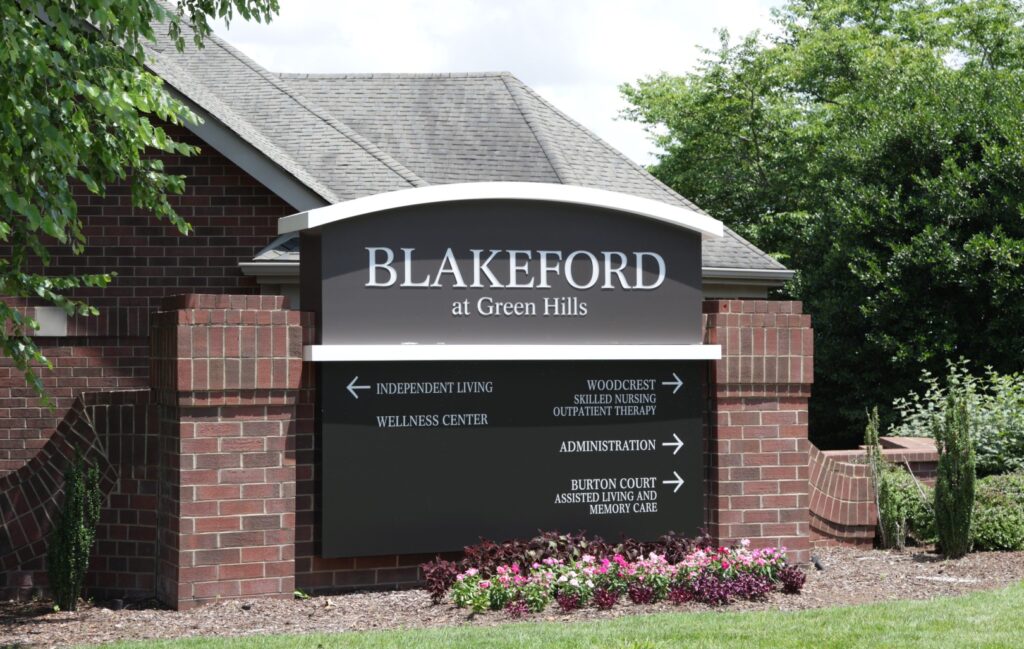
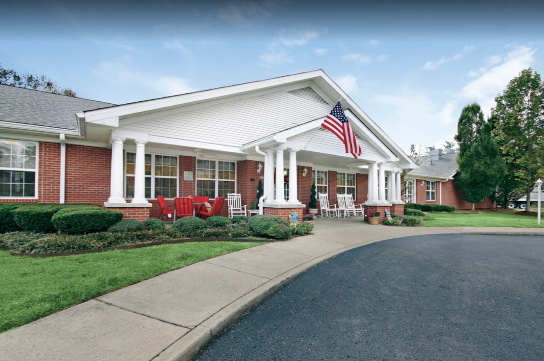
Blakeford Senior Life is a nonprofit organization based in Nashville that has been dedicated to serving seniors for over 20 years. Tucked in lush and scenic acres, the community focuses on enriching the lives of its residents. They offer various lifestyle options, including independent living, assisted living, and memory care. Their Life Care program offers a long-term care plan to protect the assets of their residents and ensure their peace of mind.
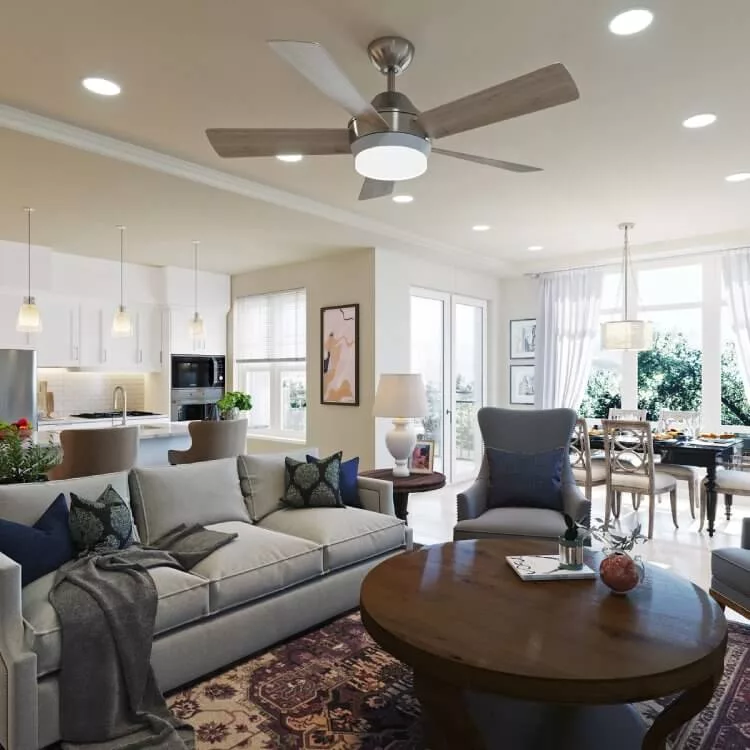
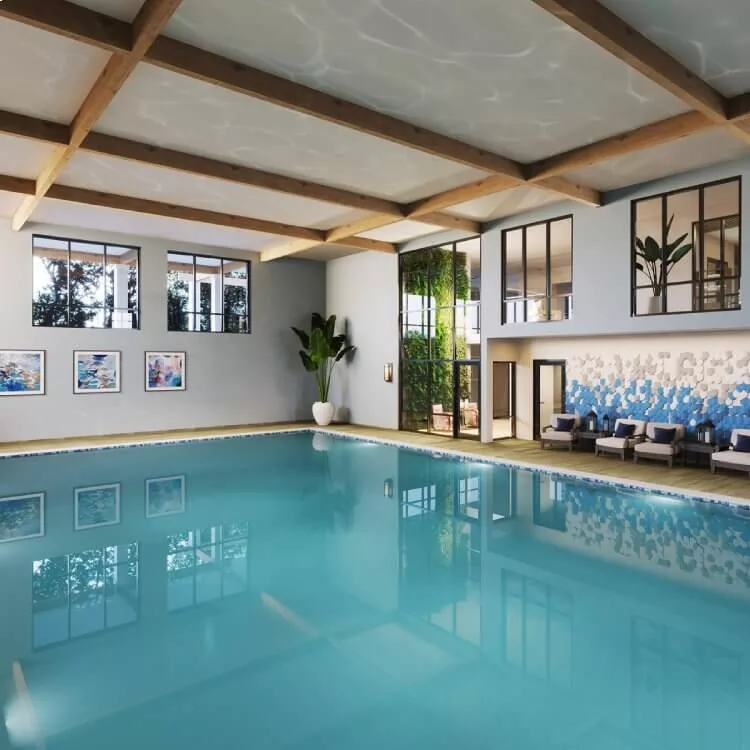
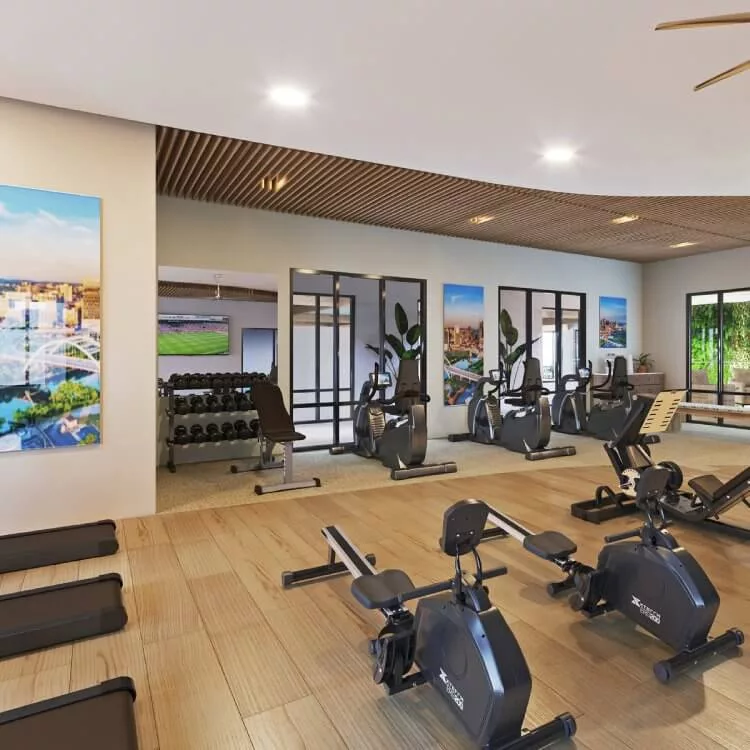
Currently, Blakeford Senior Life is expanding with 50 new spacious apartment homes and new facilities. They provide different amenities based on the lifestyle option chosen, but all residents have access to a library, wellness center with a pool, gym, and spa, wireless internet, utilities, programs and excursions, guest privileges, therapy services, transportation, and much more. This home is sure to offer a lot more in the years to come, providing seniors the unimaginable kind of care that they deserve.
Brian Barnes has served as President and CEO of Blakeford Senior Life since 2018. He brings over 20 years of senior leadership experience in finance and operations within not-for-profit senior living and healthcare organizations. Brian’s expertise includes campus development, mergers, and managing home and community-based services. He holds a bachelor’s degree in accounting and is a licensed CPA, having completed the Long-Term Care Administrator program.
May offer a more intimate, personalized care environment.
Lower occupancy suggests more openings may be available.
This home supports both short-term rehab and long-term care, with residents staying for a wide range of durations.
43% of new residents, usually for short-term rehab.
57% of new residents, often for short stays.
Tennessee average 3.5
Last Health inspection on Mar 2022
Tennessee average 15.4
Tennessee average 4.39
Health citations are formal notices following inspections when they fail to comply with safety and care standards.
All 13 citations resulted from standard inspections.
Tennessee average: 1.1
Tennessee average: 0.6
Data sourced from CMS Health Deficiencies reports. Citation severity codes range from A (least serious) to L (most serious). Immediate Jeopardy (J-L) citations indicate situations where the facility's noncompliance has placed residents at risk of death or serious harm.
Assisted Living A licensed, long-term care setting for seniors or individuals with disabilities who need help with daily activities — like bathing, dressing, and medication management — but not 24-hour skilled nursing. Offers housing, meals, and around-the-clock support while aiming to maximize resident independence.
Assisted Living A licensed, long-term care setting for seniors or individuals with disabilities who need help with daily activities — like bathing, dressing, and medication management — but not 24-hour skilled nursing. Offers housing, meals, and around-the-clock support while aiming to maximize resident independence.
Assisted Living A licensed, long-term care setting for seniors or individuals with disabilities who need help with daily activities — like bathing, dressing, and medication management — but not 24-hour skilled nursing. Offers housing, meals, and around-the-clock support while aiming to maximize resident independence.
Memory Care Secured, specialized care for people living with Alzheimer's or dementia. Staff trained in cognitive impairment, with higher staff-to-resident ratios and an environment designed to reduce confusion and wandering risk.
Respite Care Short-term temporary care — days to weeks — to give family caregivers a break. Full care provided during the stay. Often used after hospitalization or to trial a facility before a permanent placement decision.
Nursing Home Licensed facility providing 24/7 skilled nursing care for residents with complex, ongoing medical needs. Staffed by RNs, LPNs, and CNAs. Inspected and star-rated annually by CMS. Accepts Medicare (short-term rehab) and Medicaid (long-term care).
Assisted Living A licensed, long-term care setting for seniors or individuals with disabilities who need help with daily activities — like bathing, dressing, and medication management — but not 24-hour skilled nursing. Offers housing, meals, and around-the-clock support while aiming to maximize resident independence.
Assisted Living A licensed, long-term care setting for seniors or individuals with disabilities who need help with daily activities — like bathing, dressing, and medication management — but not 24-hour skilled nursing. Offers housing, meals, and around-the-clock support while aiming to maximize resident independence.
Memory Care Secured, specialized care for people living with Alzheimer's or dementia. Staff trained in cognitive impairment, with higher staff-to-resident ratios and an environment designed to reduce confusion and wandering risk.
Respite Care Short-term temporary care — days to weeks — to give family caregivers a break. Full care provided during the stay. Often used after hospitalization or to trial a facility before a permanent placement decision.
![]() 5.2 miles from city center — 2.77 miles to nearest hospital (Bookworms Cafe)
5.2 miles from city center — 2.77 miles to nearest hospital (Bookworms Cafe)
![]() 11 Burton Hills Blvd, Nashville, TN 37215
11 Burton Hills Blvd, Nashville, TN 37215
Add your location
This data corresponds to Q2 2025 and is based on CMS Payroll-Based Journal.
Tennessee average ratio: 1.79:1
Tennessee average: 8.3 hours
Manages medical care and health needs.
This role is partially covered by contractors.
Assists with medical care and medications.
This role is partially covered by contractors.
Helps with daily care and mobility.
This role is partially covered by contractors.
Total hours from contractors
15,683 contractor hours this quarter
| Certified Nursing Assistant | 37 | 65 | 102 | 16,849 | 91 | 100% | 10 |
| Licensed Practical Nurse | 8 | 50 | 58 | 7,382 | 91 | 100% | 9.8 |
| Registered Nurse | 9 | 12 | 21 | 3,132 | 91 | 100% | 10 |
| RN Director of Nursing | 3 | 0 | 3 | 1,804 | 76 | 84% | 9.3 |
| Speech Language Pathologist | 0 | 7 | 7 | 1,515 | 91 | 100% | 6.2 |
| Respiratory Therapy Technician | 0 | 6 | 6 | 1,308 | 78 | 86% | 6.9 |
| Clinical Nurse Specialist | 2 | 1 | 3 | 1,306 | 80 | 88% | 9.5 |
| Physical Therapy Assistant | 0 | 4 | 4 | 996 | 76 | 84% | 6.6 |
| Other Dietary Services Staff | 2 | 0 | 2 | 952 | 71 | 78% | 7.8 |
| Qualified Social Worker | 0 | 3 | 3 | 716 | 72 | 79% | 6.1 |
| Physical Therapy Aide | 0 | 4 | 4 | 645 | 74 | 81% | 5.8 |
| Occupational Therapy Aide | 0 | 1 | 1 | 504 | 63 | 69% | 8 |
| Mental Health Service Worker | 1 | 0 | 1 | 488 | 61 | 67% | 8 |
| Administrator | 1 | 0 | 1 | 476 | 60 | 66% | 7.9 |
| Nurse Practitioner | 1 | 0 | 1 | 440 | 55 | 60% | 8 |
| Therapeutic Recreation Specialist | 0 | 1 | 1 | 381 | 51 | 56% | 7.5 |
| Feeding Assistant | 0 | 1 | 1 | 289 | 36 | 40% | 8 |
| Occupational Therapy Assistant | 0 | 1 | 1 | 27 | 7 | 8% | 3.9 |
| Medical Director | 0 | 1 | 1 | 4 | 2 | 2% | 2 |
Source: CMS Long-Term Care Facility Characteristics (Data as of Jan 2026)
Residents meet regularly to discuss policies, care quality, and activities
Part of a Continuing Care Retirement Community offering multiple care levels
Organized group of residents that meets regularly to discuss facility policies, quality of life, and activities.
Data sourced from CMS Long-Term Care Facility Characteristics quarterly report. Payer mix reflects the current resident census by primary payment source.
These measures show how residents usually do over time at this home, based on health outcomes and preventive care.
Tennessee average: 10.5
Tennessee average: 19.5
Tennessee average: 16.0%
Tennessee average: 21.7%
Tennessee average: 20.7%
Tennessee average: 3.7%
Tennessee average: 5.4%
Tennessee average: 2.1%
Tennessee average: 6.3%
Tennessee average: 11.0%
Tennessee average: 16.5%
Tennessee average: 89.9%
Tennessee average: 94.5%
Tennessee average: 79.7%
Tennessee average: 1.7%
Tennessee average: 79.8%
Quality measures are calculated from Minimum Data Set (MDS) assessments. For most measures, lower percentages indicate better care quality.
Historical financial and operational data for Blakeford at Green Hills based on CMS SNF Cost Reports.
Loading trend charts...
Care Cost Calculator: See Prices in Your Area
Nursing Home Data Explorer
Don’t Wait Too Long: 7 Red Flag Signs Your Parent Needs Assisted Living Now
The True Cost of Assisted Living in 2025 – And How Families Are Paying For It
Understanding Senior Living Costs: Pricing Models, Discounts & Financial Assistance

Touring a community? Use this expert-backed checklist to stay organized, ask the right questions, and find the perfect fit.
We'll send you a PDF version of the touring checklist.