Explore Open Rooms

1 Contact details
2 What type of senior care service are you looking for?
3 What budget do you have in mind for senior care?
4 How soon do you need to find care?
5 Additional details

Thank you for your interest!

Our team will be in touch shortly to help with next steps.

Senior Living in Meriden

CMS overall rating Info The Overall CMS Rating combines results from health inspections, staffing levels and quality measures. Health inspections carry the most weight. Staffing and quality scores can increase or decrease the final rating based on performance compared to state and national standards.

Bradley Home & Pavilion

320 Colony St, Meriden, CT 06451 View map
Overview of Bradley Home & Pavilion

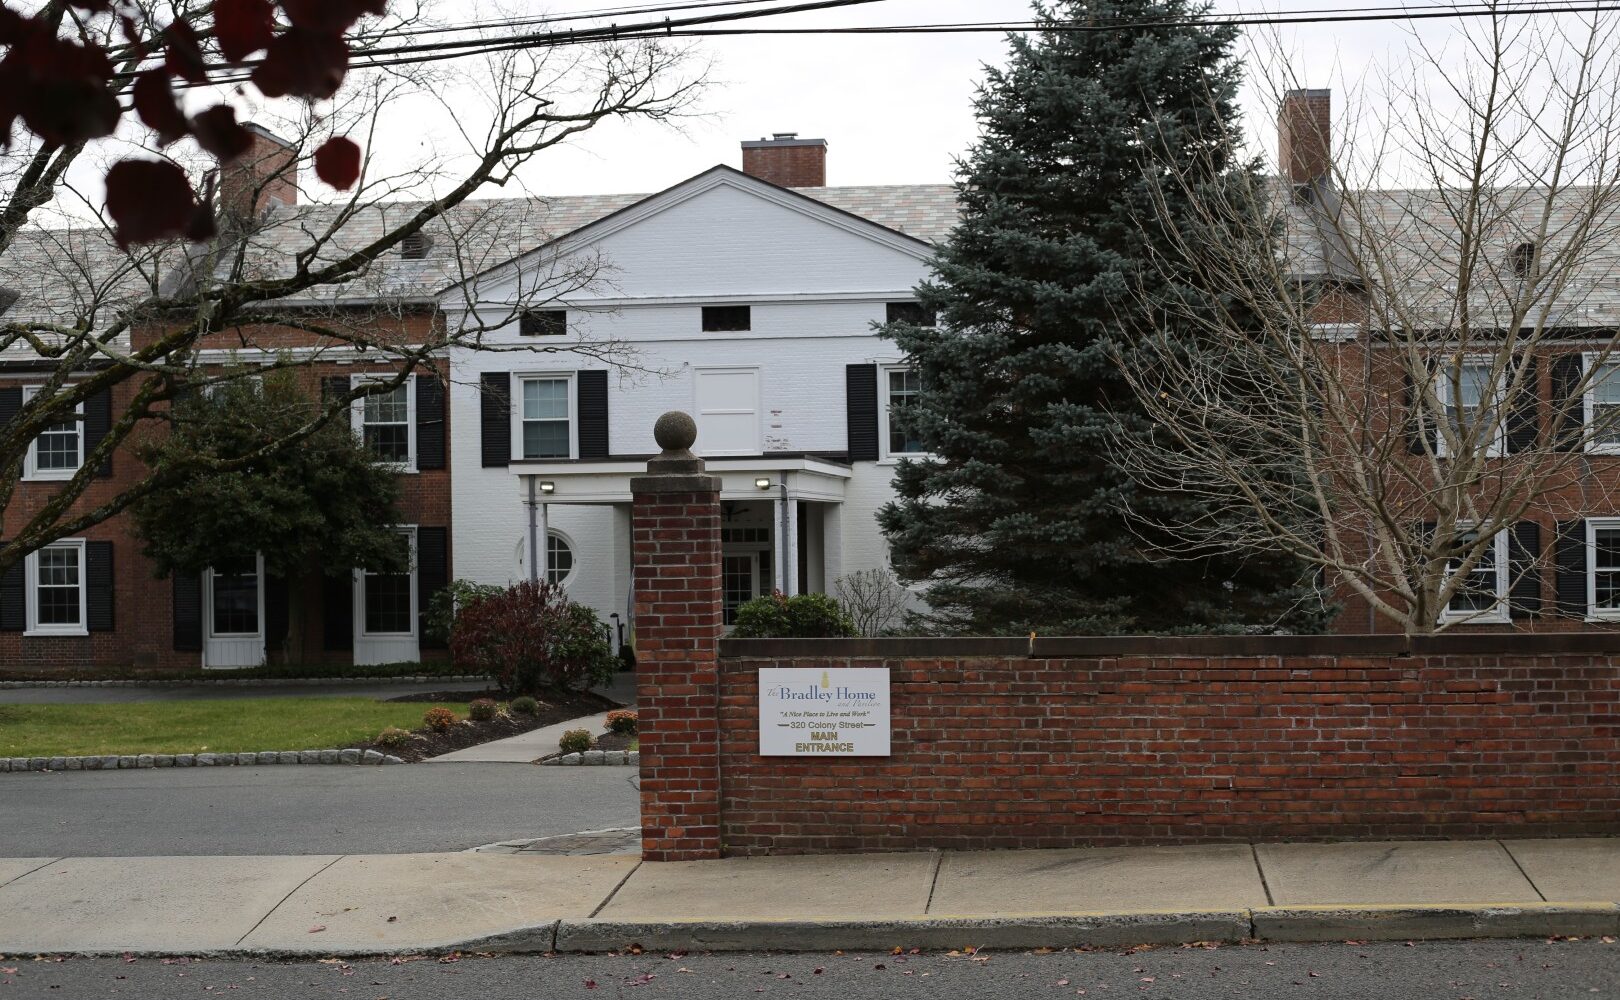
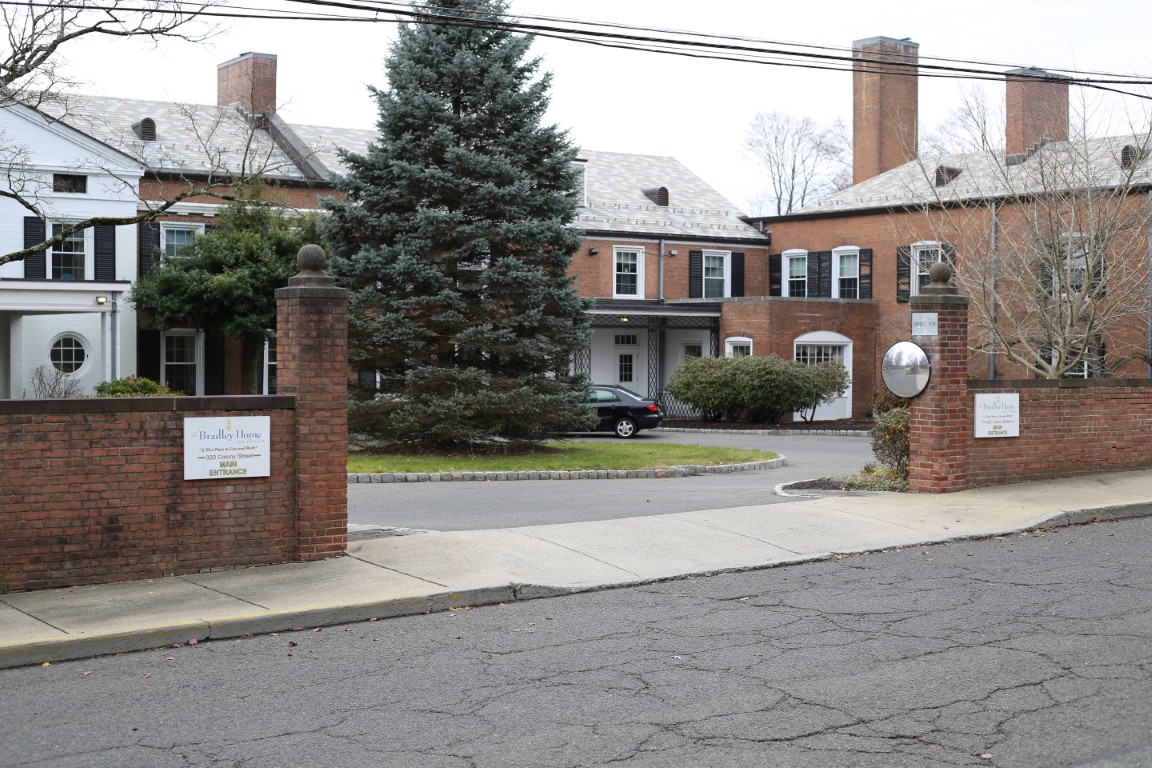
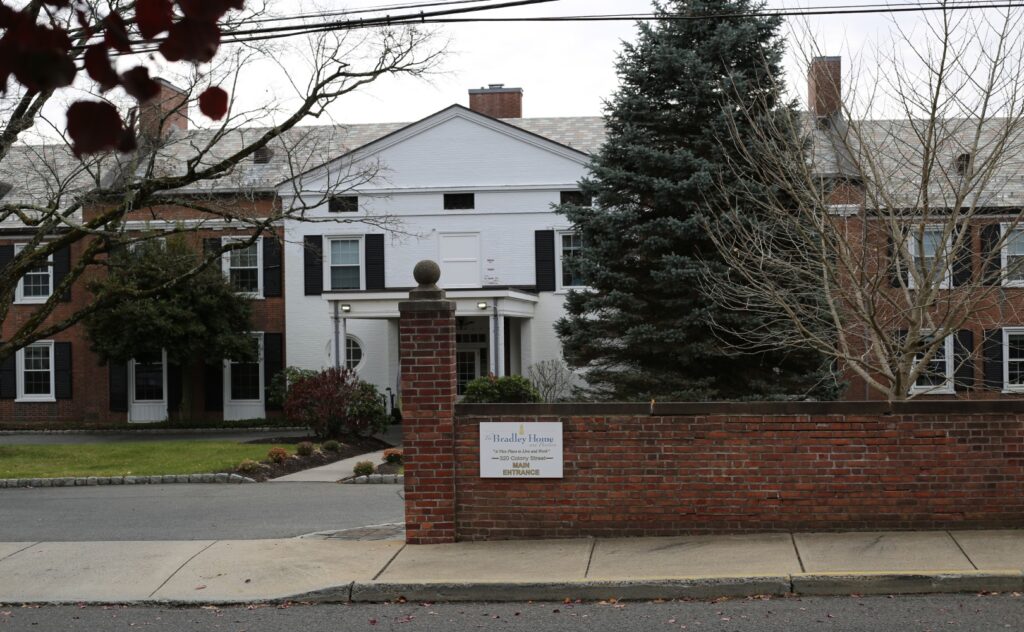
Bradley Home & Pavilion is a highly recognized nursing home in Meriden, CT, that offers long-term care and rehabilitation for those 65+. The community continuously promotes a home-like environment, ensuring older adults’ comfort and healing. Respite care, monthly activities, and dietitian-approved meals are also provided to enrich residents’ living experiences. Here, residents’ needs and preferences are prioritized with personalized care plans crafted.

Cooking classes, exciting trips, and exercises provide residents with more opportunities to learn and maintain social connections. Transportation to medical appointments is also provided, so residents can travel with ease. The Connecticut State Police Museum and Midstate Medical Center Emergency Room are also set nearby, ensuring accessibility and convenience. As one of the trusted choices for senior living in Connecticut, this nursing home has high-quality services dedicated to helping older adults live comfortably in their later years.

(203) 235-5716

Quality ratings

Measured by Centers for Medicare & Medicaid Services (CMS)

Overall rating Info The Overall CMS Rating combines results from health inspections, staffing levels and quality measures. Health inspections carry the most weight. Staffing and quality scores can increase or decrease the final rating based on performance compared to state and national standards.
5/5
Connecticut average: 3.4/5
Health Inspection Info Based on the results of the facility's three most recent standard inspections and any complaint investigations. CMS reviews the number, scope, and severity of deficiencies, with more recent findings weighted more heavily.
4/5
Connecticut average: 3.1/5
Staffing Info Measures average nursing staff hours per resident per day, including Registered Nurses (RNs) and total nursing staff. Ratings are adjusted based on the level of care residents require and are compared to state and national benchmarks.
5/5
Connecticut average: 3.4/5
Quality Measures Info Based on clinical and physical health indicators reported to CMS, such as hospital readmissions, falls, pressure ulcers, and improvements in mobility. These measures reflect how well residents' health needs are being managed.
4/5
Connecticut average: 3.6/5

Nursing care per resident

Info This shows how many total hours of nursing staff time are available per resident each day. Higher numbers usually mean more staff support.
4h 40m per day

This home provides 15% more nursing time per resident than the Connecticut average.

Connecticut average: 4h 4m per day

Capacity and availability

Smaller home

May offer a more intimate, personalized care environment.

Total beds 30

This home is often near full

That suggests steady demand, but availability may be limited.

Higher demand than most homes in Connecticut
Occupancy rate 96.7%
Residents per day (avg) 28
Occupancy rate
96.7%
Residents per day (avg)
28

Who this home usually serves

TYPE OF STAY

Mostly short-term rehab stays

Most residents typically stay for a few weeks or months before returning home or moving on.

Might be optimal for
Short stays Recovery Medicare-covered care

Breakdown by payment type

Medicare

61% of new residents, usually for short-term rehab.

Typical stay 2 - 3 months

Private pay

6% of new residents, often for short stays.

Typical stay 29 - 30 years

Medicaid

33% of new residents, often for long-term daily care.

Typical stay 4 years

Finances and operations

Voluntary non-profit community
Home revenue
$10.7M
Operating deficit
-$912.0K
Voluntary non-profit community
Home revenue
$10,697,164.00
Operating deficit
$-912,021.00
Payroll costs Info The portion of the home's budget spent on staff, including nurses, caregivers, and other employees who support care and operations.
$4.2M
39.1% of revenue
Other operating costs Info All remaining costs needed to run the home, such as food, utilities, building maintenance, supplies and administrative expenses.
$7.2M
Total costs $11.4M
Years in operation
18 years in operation
A longer operating history, which may indicate experience navigating regulations and delivering ongoing care.
Walk Score
Walk Score: 56 / 100
Moderately walkable. Some errands can be accomplished on foot, with a mix of nearby amenities.

Services

Dementia Care
Intergenerational Recreation
Iv Therapy
Pastoral Care
Recreation
Rehabilitation Therapy
Short-term Rehabilitation

About this community

Occupancy

Occupancy rate
39%
In line with Connecticut average
Occupied beds
29 / 74
Average residents 102 per day

License details

Facility type
Residential Care Facility
Status Active
Issuance January 10, 2008
Expiration September 30, 2026

Additional licensing details

License number: 1377RC

Room costs

Private Room $220 per day
Semi-Private Room $500 per day

Staffing

Key information about the people who lead and staff this community.

Languages Spoken

Spanish

Staff Composition (State Data)

Admin
3 FTE
Registered Nurse
7 FTE
Licensed Practical Nurse
5 FTE
Nursing Assistant
11 FTE
Recreation
3 FTE
Food Service Supervisor
1 FTE
Dietary
12 FTE
Other Staff
10 FTE

Care Services

Respite Care
Skilled Nursing
Licensed Nurses/CNAs

Additional Policies & Features

Religious Services: Catholic, Protestant

Amenities & Lifestyle

Upscale Dining
Landscaped Courtyards
Outdoor Seating
On-Site Beauty Salon
Convenience Store

Programs & Activities

Activities
Monthly Activity Calendar available.
Specific Programs
Residential Care Home, Skilled Nursing Facility, Respite Care, Activities and Programs, Dining, Monthly Activity Calendar
Volunteer Programs
Yes

Dining & Nutrition

Food Description
Upscale dining experience tailored to the tastes and dietary needs of residents.

What does this home offer?

Building type icon
Building type icon

Building Type: 2-story

Dining services icon

Dining Services

Transportation services icon

Transportation Services

Housekeeping icon
Housekeeping icon

Housekeeping Services

Social and recreational activities icon

Social and Recreational Activities

Exercise program icon

Exercise Programs

Types of Care at Bradley Home & Pavilion

Skilled Nursing
Contact Bradley Home & Pavilion

Inspection History

In Connecticut, the Department of Public Health, Facility Licensing and Investigations Section conducts mandatory inspections and unannounced surveys to monitor the quality of care in long-term facilities.

7 visits/inspections

4 routine inspections

Breakdown by inspection type
  • 2 renewal/recertification inspections
  • 1 licensing inspection
  • 3 plans of correction
  • 1 statement of deficiencies

Results

3 with issues

1 without issues

Connecticut average: 13 visits/inspections

Latest inspection

Date March 10, 2025

Inspection history

01-24-2022 Plan of Correction
01-27-2023 Inspection Report
03-10-2025 Inspection Report
06-15-2023 Inspection Report
06-22-2020 Statement of Deficiencies
08-01-2023 Inspection Report
08-12-2019 Plan of Correction
12-21-2023 Inspection Report

2 deficiencies

Deficiencies indicate regulatory issues. A higher number implies the facility had several areas requiring improvement.

Connecticut average: 19 deficiencies

Inspection Report Summary for Bradley Home & Pavilion

The most recent inspection on November 18, 2022, identified deficiencies related to medication storage and the management of residents who self-administer medications. Earlier inspections were not detailed in the available reports, so broader patterns are unclear. Inspectors cited issues with unsecured medications and lack of proper physician orders and assessments for self-administration. There were no complaint investigations or enforcement actions listed in the available reports. The facility responded with a plan of correction including locked medication dispensers and updated policies, indicating steps toward addressing these concerns.

Health Inspection History

Inspections
Total health inspections 3

Connecticut average 5.7


Last Health inspection on Mar 2025

Total health citations 15

Connecticut average 32

Citations per inspection
5

Connecticut average 5.82


Health citations are formal notices following inspections when they fail to comply with safety and care standards.

All 15 citations resulted from standard inspections.

Breakdown of citation severity (last 3 years)
Critical Health citations More info 0
100% better than Connecticut average

Connecticut average: 0.3


Serious Health citations More info 0
100% better than Connecticut average

Connecticut average: 0.7

0 critical citations More info Connecticut average: 0.3

0 serious citations More info Connecticut average: 0.7

14 moderate citations More info Connecticut average: 28.8

1 minor citation More info Connecticut average: 2.3
Citations history (last 3 years)
Nutrition moderate citation Info Issues related to food quality, meal service, and resident's nutritional needs. Mar 10, 2025
Corrected

Quality of Care moderate citation Info Issues related to how well residents receive appropriate treatment and support for their medical and daily care needs. Mar 10, 2025
Corrected

Care Planning moderate citation Info Issues related to creating and updating personalized care plans for residents based on their needs and conditions. Mar 10, 2025
Corrected

Care Planning moderate citation Info Issues related to creating and updating personalized care plans for residents based on their needs and conditions. Mar 10, 2025
Corrected

Compare Senior Living around Meriden The information below is reported by the Connecticut Department of Public Health, Facility Licensing and Investigations Section.

Filter by care type
Bradley Home & Pavilion
NH

Nursing Home Licensed facility providing 24/7 skilled nursing care for residents with complex, ongoing medical needs. Staffed by RNs, LPNs, and CNAs. Inspected and star-rated annually by CMS. Accepts Medicare (short-term rehab) and Medicaid (long-term care).

Meriden
104
No
56
Private / Semi-Private Rooms
18
96.7%
11
2

Places of interest near Bradley Home & Pavilion

Address 1.3 miles from city center
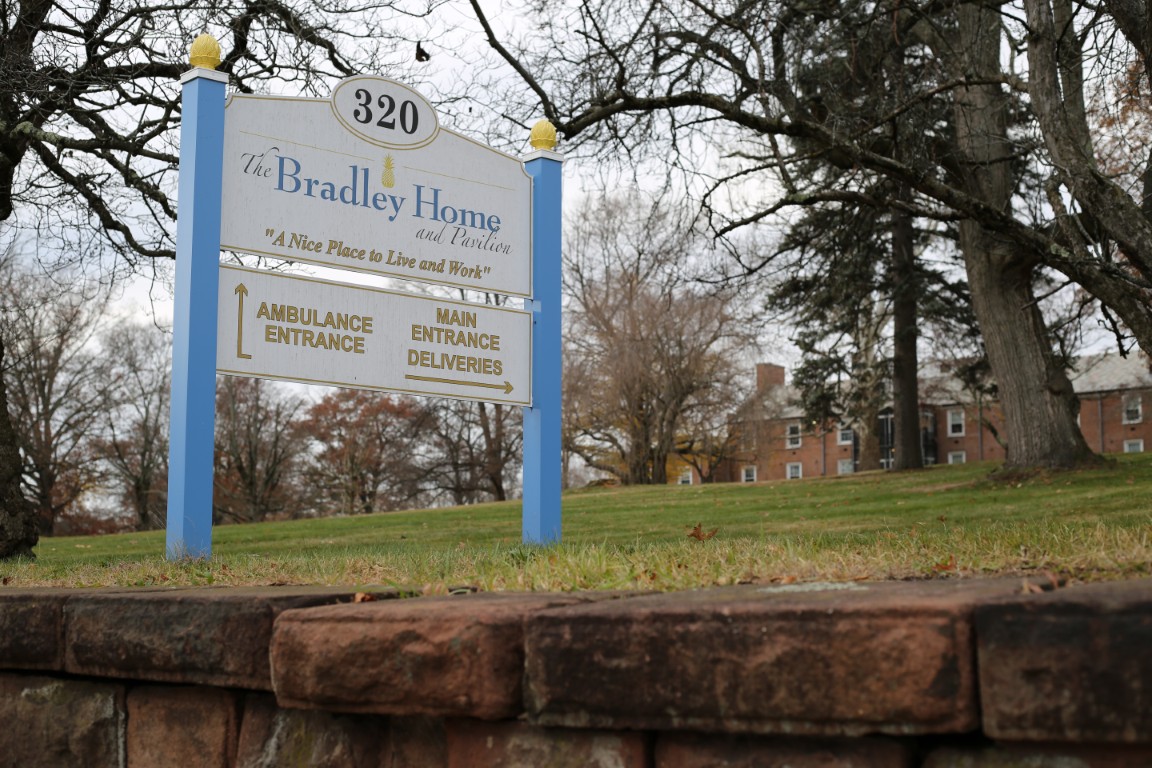
Address 320 Colony St, Meriden, CT 06451

Calculate Travel Distance to Bradley Home & Pavilion

Add your location

Address

Staffing Data (Q2 2025)

This data corresponds to Q2 2025 and is based on CMS Payroll-Based Journal.

Total staff 93
Employees 46
Contractors 47
Staff to resident ratio 3.32:1
77% better than Connecticut average

Connecticut average ratio: 1.88:1

Avg staff/day 23
Average shift 6.6 hours
12% worse than Connecticut average

Connecticut average: 7.5 hours

Total staff hours (quarter) 13,765
Nursing staff breakdown
Registered Nurse

Manages medical care and health needs.

Total count 15
Average shift length Info Average shift length. Calculated as total hours divided by days worked and average staff per day. 7.1 hours

This role is partially covered by contractors.

Licensed Practical Nurse

Assists with medical care and medications.

Total count 6
Average shift length Info Average shift length. Calculated as total hours divided by days worked and average staff per day. 8.2 hours

This role is partially covered by contractors.

Certified Nursing Assistant

Helps with daily care and mobility.

Total count 35
Average shift length Info Average shift length. Calculated as total hours divided by days worked and average staff per day. 7.4 hours

This role is partially covered by contractors.

Contractor staffing

Total hours from contractors

14.1%

1,941 contractor hours this quarter

Certified Nursing Assistant: 16 Physical Therapy Assistant: 7 Registered Nurse: 6 Qualified Social Worker: 5 Respiratory Therapy Technician: 4 Physical Therapy Aide: 2 Speech Language Pathologist: 2 Feeding Assistant: 1 Licensed Practical Nurse: 1 Occupational Therapy Aide: 1 Medical Director: 1 Occupational Therapy Assistant: 1
Staff by category
Certified Nursing Assistant1916356,06991100%7.4
Registered Nurse96152,28691100%7.1
Dietitian2028766470%7.3
Licensed Practical Nurse51684891100%8.2
Other Dietary Services Staff6068306976%6.1
Nurse Practitioner1014586167%7.5
Physical Therapy Aide0224558088%5.6
Administrator1014355864%7.5
RN Director of Nursing1013225156%6.3
Clinical Nurse Specialist1012403235%7.5
Mental Health Service Worker1011732123%8.2
Physical Therapy Assistant0771685864%2.7
Feeding Assistant0111524347%3.5
Occupational Therapy Aide0111515055%3
Qualified Social Worker0551356571%1.9
Speech Language Pathologist0221013235%2.9
Respiratory Therapy Technician04426910%2.6
Medical Director011231112%2.1
Occupational Therapy Assistant0112133%6.8
35 Certified Nursing Assistant
% of Days 100%
15 Registered Nurse
% of Days 100%
2 Dietitian
% of Days 70%
6 Licensed Practical Nurse
% of Days 100%
6 Other Dietary Services Staff
% of Days 76%
1 Nurse Practitioner
% of Days 67%
2 Physical Therapy Aide
% of Days 88%
1 Administrator
% of Days 64%
1 RN Director of Nursing
% of Days 56%
1 Clinical Nurse Specialist
% of Days 35%
1 Mental Health Service Worker
% of Days 23%
7 Physical Therapy Assistant
% of Days 64%
1 Feeding Assistant
% of Days 47%
1 Occupational Therapy Aide
% of Days 55%
5 Qualified Social Worker
% of Days 71%
2 Speech Language Pathologist
% of Days 35%
4 Respiratory Therapy Technician
% of Days 10%
1 Medical Director
% of Days 12%
1 Occupational Therapy Assistant
% of Days 3%

Facility Characteristics

Source: CMS Long-Term Care Facility Characteristics (Data as of Jan 2026)

Total census
28 residents
Residents by payment source
Medicaid
23 residents (82.1%)
Private pay or other
5 residents (17.9%)
Programs & Services
Residents' Group

Residents meet regularly to discuss policies, care quality, and activities

Family Member Group

Family members meet regularly to discuss policies, care quality, and activities

Active Family Council

Organized group of family members that meets regularly to discuss facility policies, resident care, and activities.

Active Resident Council

Organized group of residents that meets regularly to discuss facility policies, quality of life, and activities.

Quality of care over time

These measures show how residents usually do over time at this home, based on health outcomes and preventive care.

High-risk clinical events score Info A composite score based on pressure ulcers, falls with injury, weight loss, walking ability decline, and activities of daily living decline. 11.1
7% worse than Connecticut average

Connecticut average: 10.4

Functional decline score Info A composite score based on activities of daily living decline, walking ability decline, and incontinence. 21.2
In line with Connecticut average

Connecticut average: 21.1

Long-stay resident measures
Need for Help with Daily Activities Increased Info Percent of long-stay residents whose need for help with daily activities has increased 23.9%
26% worse than Connecticut average

Connecticut average: 18.9%

Walking Ability Worsened Info Percent of long-stay residents whose ability to move independently worsened 15.6%
19% better than Connecticut average

Connecticut average: 19.2%

Low Risk Residents with Bowel/Bladder Incontinence Info Percent of low risk long-stay residents who lose control of their bowels or bladder 24.1%
In line with Connecticut average

Connecticut average: 24.9%

Falls with Major Injury Info Percent of long-stay residents experiencing one or more falls with major injury 8.7%
153% worse than Connecticut average

Connecticut average: 3.5%

High Risk Residents with Pressure Ulcers Info Percent of long-stay high risk residents with pressure ulcers 4.0%
13% better than Connecticut average

Connecticut average: 4.6%

Urinary Tract Infection Info Percent of long-stay residents with a urinary tract infection 0.0%
100% better than Connecticut average

Connecticut average: 1.7%

Lost Too Much Weight Info Percent of long-stay residents who lose too much weight 3.2%
49% better than Connecticut average

Connecticut average: 6.3%

Depressive Symptoms Info Percent of long-stay residents who have depressive symptoms 1.2%
92% better than Connecticut average

Connecticut average: 15.2%

Antipsychotic Use Info Percent of long-stay residents who received an antipsychotic medication 6.1%
65% better than Connecticut average

Connecticut average: 17.2%

Pneumococcal Vaccine Info Percent of long-stay residents assessed and appropriately given the pneumococcal vaccine 86.4%
In line with Connecticut average

Connecticut average: 87.5%

Influenza Vaccine Info Percent of long-stay residents assessed and appropriately given the seasonal influenza vaccine 100.0%
7% better than Connecticut average

Connecticut average: 93.5%

Short-stay resident measures
Pneumococcal Vaccine Info Percent of short-stay residents assessed and appropriately given the pneumococcal vaccine 58.8%
16% worse than Connecticut average

Connecticut average: 70.1%

Antipsychotic medication increase Info Percent of short-stay residents who newly received an antipsychotic medication 0.0%
100% better than Connecticut average

Connecticut average: 1.5%

Guides for Better Senior Living

Care Cost Calculator: See Prices in Your Area

Nursing Home Data Explorer

Don’t Wait Too Long: 7 Red Flag Signs Your Parent Needs Assisted Living Now

The True Cost of Assisted Living in 2025 – And How Families Are Paying For It

Understanding Senior Living Costs: Pricing Models, Discounts & Financial Assistance

Financial Aid for Connecticut Seniors

Get financial aid guidance

Connecticut Home Care Program for Elders

CHCPE

Age 65+, Connecticut resident, at risk of nursing home placement.

State-funded: ~$1,600/month; Medicaid: ~$2,829/month (300% FBR).

$1,600 (state), $2,000 (Medicaid, individual).

Two tiers (state and Medicaid); waitlists possible.

Statewide Respite Care Program

CT Respite Care

Caregiver of senior with dementia, Connecticut resident.

~$2,500/month (individual, varies).

$40,000 (individual).

Limited to dementia caregivers; capped funding.

Congregate Housing Services Program (CHSP)

Connecticut Congregate Housing Services Program

Age 62+, Connecticut resident, frail but not needing 24/7 care, resides in CHSP-eligible housing.

~$41,000/year (individual, adjusted annually).

Not specified; focus is income-based.

Limited to 14 state-subsidized sites; participants pay 10% of service costs.

Medicare Savings Program (MSP)

Connecticut Medicare Savings Program

Age 65+ or disabled, Connecticut resident, enrolled in Medicare Part A/B.

~$2,510/month (individual, QMB); ~$3,380/month (SLMB); ~$3,598/month (ALMB)—adjusted annually.

None since 2023 policy change.

Three tiers (Qualified Medicare Beneficiary, Specified Low-Income, Additional Low-Income); no asset test.

Senior Community Service Employment Program (SCSEP)

Connecticut SCSEP (federally funded, state-administered)

Age 55+, unemployed, low-income, Connecticut resident.

~$1,983/month (125% FPL, individual).

Not specified; income-focused.

Priority for veterans, rural residents; limited slots (~500/year).

Tour Icon
Planning a tour? Check our touring checklist.
Chat Icon
Thinking of living here? We can help you speak to a current resident