Occupancy rate
75%

We arrange tours, appointments, and even moving support so you don’t have to


 Official CMS rating based on health inspections, staffing and quality measures.
Official CMS rating based on deficiencies found during state health inspections.
Official CMS rating based on nurse staffing hours per resident per day.
Official CMS rating based on clinical outcomes for residents.
Average daily nursing hours per resident (adjusted for acuity). Higher values indicate more nursing time per resident.
Official CMS rating based on health inspections, staffing and quality measures.
Official CMS rating based on deficiencies found during state health inspections.
Official CMS rating based on nurse staffing hours per resident per day.
Official CMS rating based on clinical outcomes for residents.
Average daily nursing hours per resident (adjusted for acuity). Higher values indicate more nursing time per resident.
May offer a more intimate, personalized care environment.
Lower occupancy suggests more openings may be available.
This home supports both short-term rehab and long-term care, with residents staying for a wide range of durations.
31% of new residents, usually for short-term rehab.
42% of new residents, often for short stays.
27% of new residents, often for long-term daily care.
The portion of the home's budget spent on staff, including nurses, caregivers, and other employees who support care and operations.
All remaining costs needed to run the home, such as food, utilities, building maintenance, supplies and administrative expenses.
In Ohio, the Department of Health, Bureau of Survey and Certification conducts unannounced onsite inspections to evaluate the quality of care and environment in all licensed facilities.
Citations indicate regulatory violations. A higher number implies the facility had several areas requiring improvement.
Ohio average: 2 citations
Every two years, the Ohio Department of Aging and the Office of the State Long-Term Care Ombudsman organizations conduct a satisfaction survey among residents in long-term care facilities to assess their quality of care and life.
Ohio average: 86 / 100
Ohio average: 89 / 100
Ohio average: 95 / 100
Ohio average: 82 / 100
Ohio average: 86 / 100
Ohio average: 89 / 100
Ohio average: 80 / 100
Ohio average: 81 / 100
Based on the RCF Resident Satisfaction Survey 2022-23, Final Results
Have you gotten or are you getting physical therapy, occupational therapy or speech therapy, while living at this care facility?
This facility75/100
Ohio average46/100
Did (Do) you know who to speak to about your therapy progress?
This facility69/100
Ohio average85/100
Can you decide how to spend your day?
This facility100/100
Ohio average94/100
Did (Does) the therapy help you meet your goals?
This facility100/100
Ohio average88/100
Did (Do) the therapists help you set goals?
This facility100/100
Ohio average89/100
Scores represent percent of positive resident responses for each item, excluding "don't know" and "not applicable" responses and instances where the question was skipped.
Based on the RCF Resident Satisfaction Survey 2022-23, Final Results
Are your personal items safe here?
This facility87/100
Ohio average92/100
Is it very clean here?
This facility88/100
Ohio average96/100
Is it easy for you to get around in your room (or apartment)?
This facility92/100
Ohio average96/100
Can you find a place to be alone if you want to be alone?
This facility96/100
Ohio average96/100
Do you feel safe here?
This facility96/100
Ohio average98/100
Can you enjoy the outdoors if you want to?
This facility100/100
Ohio average91/100
Are you able to get around the building if you want to?
This facility100/100
Ohio average95/100
Do you feel you have enough privacy?
This facility100/100
Ohio average95/100
Scores represent percent of positive resident responses for each item, excluding "don't know" and "not applicable" responses and instances where the question was skipped.
Based on the RCF Resident Satisfaction Survey 2022-23, Final Results
Did you receive a thorough orientation to BRIARWOOD VILLAGE?
This facility79/100
Ohio average70/100
Were you given enough information to learn how things work here?
This facility92/100
Ohio average82/100
Did you feel warmly welcomed as a new resident?
This facility100/100
Ohio average93/100
Scores represent percent of positive resident responses for each item, excluding "don't know" and "not applicable" responses and instances where the question was skipped.
Based on the RCF Resident Satisfaction Survey 2022-23, Final Results
Do the people who work here tell you when rules, policies, and procedures change?
This facility79/100
Ohio average78/100
Are you encouraged to speak up about things you don’t like here?
This facility86/100
Ohio average81/100
Do the people who work here seem happy to work here?
This facility91/100
Ohio average92/100
Are you friends with anyone who lives here?
This facility92/100
Ohio average81/100
Would you highly recommend BRIARWOOD VILLAGE to someone who needs this type of care?
This facility92/100
Ohio average89/100
Are your concerns taken care of in a timely way?
This facility94/100
Ohio average86/100
Do the people who work here go above and beyond to give you a good life?
This facility96/100
Ohio average87/100
Are you as involved in decisions about your care as you want to be?
This facility96/100
Ohio average85/100
Overall, are you satisfied with the care you receive here?
This facility100/100
Ohio average94/100
Do the people who work here help you with technology, if needed?
This facility100/100
Ohio average89/100
Scores represent percent of positive resident responses for each item, excluding "don't know" and "not applicable" responses and instances where the question was skipped.
Based on the RCF Resident Satisfaction Survey 2022-23, Final Results
Do the same people take care of you most of the time?
This facility83/100
Ohio average84/100
Do the people who work here check on you often enough to see if you need anything?
This facility87/100
Ohio average81/100
Do the people who care for you explain your care and services to you?
This facility91/100
Ohio average85/100
Do the people who work here do things the way you want them done?
This facility92/100
Ohio average88/100
Do the people who work here ever get angry at you?
This facility92/100
Ohio average88/100
Are the people who work here knowledgeable about your medical conditions and treatments?
This facility92/100
Ohio average90/100
Do you have opportunities to maintain your health and wellness, if you want?
This facility96/100
Ohio average92/100
Do you feel confident the people who work here would come quickly anytime you needed help?
This facility96/100
Ohio average85/100
Do the people who work here support you to do as much for yourself as you are able to do?
This facility100/100
Ohio average96/100
Do the people who work here do everything they can to protect you from getting sick?
This facility100/100
Ohio average94/100
Do the people who work here make sure you are comfortable when they provide care or services?
This facility100/100
Ohio average95/100
Scores represent percent of positive resident responses for each item, excluding "don't know" and "not applicable" responses and instances where the question was skipped.
Based on the RCF Resident Satisfaction Survey 2022-23, Final Results
Are there enjoyable things to do on the weekends, if you want?
This facility50/100
Ohio average63/100
Are you as connected to the community as you want to be?
This facility78/100
Ohio average71/100
Do you have something to look forward to most days?
This facility90/100
Ohio average77/100
Do you usually enjoy how you spend your time?
This facility91/100
Ohio average87/100
Do you have enough opportunities to go on outings and special events?
This facility91/100
Ohio average73/100
Do you like the activities here?
This facility95/100
Ohio average83/100
Do you feel included in life here?
This facility96/100
Ohio average89/100
Are you able to do the activities offered here, if you want?
This facility96/100
Ohio average93/100
Do you have plenty of opportunities to do things that are meaningful to you?
This facility100/100
Ohio average83/100
Scores represent percent of positive resident responses for each item, excluding "don't know" and "not applicable" responses and instances where the question was skipped.
Based on the RCF Resident Satisfaction Survey 2022-23, Final Results
Do you like the food here?
This facility53/100
Ohio average81/100
Do you look forward to mealtimes?
This facility68/100
Ohio average80/100
Do you have input on the food that is served?
This facility72/100
Ohio average68/100
Does the menu change often enough?
This facility82/100
Ohio average77/100
Do you get enough fresh food options here?
This facility88/100
Ohio average81/100
Do you get enough to eat here?
This facility100/100
Ohio average95/100
Scores represent percent of positive resident responses for each item, excluding "don't know" and "not applicable" responses and instances where the question was skipped.
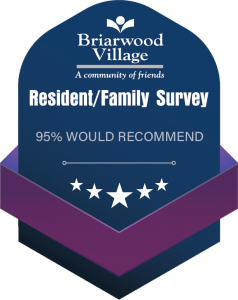
The Scripps Gerontology Center at Miami University conducts a satisfaction survey among residents' family members, friends and guardians to assess quality of care and life.
Ohio average: 77 / 100
Ohio average: 80 / 100
Ohio average: 78 / 100
Ohio average: 85 / 100
Ohio average: 78 / 100
Ohio average: 78 / 100
Ohio average: 68 / 100
Ohio average: 67 / 100
Profile of respondents of this survey
100=Definitely Yes, 67=Probably Yes, 33=Probably No, 0=Definitely No
Does this living arrangement help the resident maintain their independence?:
This facility71/100
Ohio average84/100
Do you have enough opportunities for input into decisions about your resident’s care?:
This facility76/100
Ohio average78/100
Do you get enough information to make decisions with or about your resident?:
This facility74/100
Ohio average77/100
Scores represent percent of positive responses for each item based on the latest Family Satisfaction Survey results
100=Definitely Yes, 67=Probably Yes, 33=Probably No, 0=Definitely No
Is the residential care facility thoroughly clean?:
This facility76/100
Ohio average83/100
Can the resident get outside often enough?:
This facility62/100
Ohio average74/100
Are the resident’s belongings safe?:
This facility72/100
Ohio average79/100
Scores represent percent of positive responses for each item based on the latest Family Satisfaction Survey results
100=Definitely Yes, 67=Probably Yes, 33=Probably No, 0=Definitely No
When the resident moved in, were you given thorough information to help you know
This facility—/100
Ohio average—/100
what to expect?:
This facility84/100
Ohio average85/100
Was the resident given a thorough orientation to residential care?:
This facility80/100
Ohio average80/100
Did you feel warmly welcomed as a new family member?:
This facility88/100
Ohio average90/100
Scores represent percent of positive responses for each item based on the latest Family Satisfaction Survey results
100=Definitely Yes, 67=Probably Yes, 33=Probably No, 0=Definitely No
Are you encouraged to speak up when you have a problem?:
This facility81/100
Ohio average83/100
Are your concerns addressed in a timely way?:
This facility73/100
Ohio average78/100
Are you kept well informed about how things are going with your resident?:
This facility76/100
Ohio average76/100
Do the staff seem happy to work at the residential care facility?:
This facility67/100
Ohio average77/100
Do the staff go above and beyond to give your resident a good life?:
This facility72/100
Ohio average76/100
Do you feel confident that staff would help your resident beyond their personal care
This facility—/100
Ohio average—/100
needs if you could not (eg, paperwork, purchasing clothing)?:
This facility65/100
Ohio average69/100
Do you have peace of mind about the care your resident is getting when you aren’t at
This facility—/100
Ohio average—/100
the residential care facility?:
This facility79/100
Ohio average82/100
Would you highly recommend this residential care facility to a family member or friend?:
This facility78/100
Ohio average79/100
Scores represent percent of positive responses for each item based on the latest Family Satisfaction Survey results
100=Definitely Yes, 67=Probably Yes, 33=Probably No, 0=Definitely No
Do you feel confident the staff is knowledgeable about the resident’s medical
This facility—/100
Ohio average—/100
condition(s) and treatment(s)?:
This facility74/100
Ohio average79/100
Do the staff know what the resident likes and doesn’t like?:
This facility76/100
Ohio average79/100
Do the staff regularly check to see if the resident needs anything?:
This facility68/100
Ohio average77/100
Have you gotten to know the staff who care for your resident?:
This facility76/100
Ohio average78/100
Do the staff encourage your resident to be as independent as they are able to be?:
This facility71/100
Ohio average82/100
Do you feel confident staff would come quickly anytime your resident needed help?:
This facility65/100
Ohio average77/100
Scores represent percent of positive responses for each item based on the latest Family Satisfaction Survey results
100=Definitely Yes, 67=Probably Yes, 33=Probably No, 0=Definitely No
Does the resident have something enjoyable to look forward to most days?:
This facility64/100
Ohio average71/100
Do the staff do a good job keeping the resident connected to the community?:
This facility65/100
Ohio average72/100
Does the resident have plenty of opportunities to do things that are meaningful to them?:
This facility65/100
Ohio average71/100
Does the residential care facility have enough opportunities for your resident to go on
This facility—/100
Ohio average—/100
special outings and events?:
This facility61/100
Ohio average63/100
Does the resident like the provided activities?:
This facility66/100
Ohio average69/100
Does the residential care facility provide things the resident enjoys doing on the
This facility—/100
Ohio average—/100
weekend?:
This facility56/100
Ohio average56/100
Do you have plenty of opportunities to be involved in the residential care facility?:
This facility78/100
Ohio average72/100
Scores represent percent of positive responses for each item based on the latest Family Satisfaction Survey results
100=Definitely Yes, 67=Probably Yes, 33=Probably No, 0=Definitely No
Is there a lot of variety in the meals?:
This facility62/100
Ohio average70/100
Are you included in mealtimes if you want to be?:
This facility66/100
Ohio average65/100
Is the food good?:
This facility59/100
Ohio average68/100
Scores represent percent of positive responses for each item based on the latest Family Satisfaction Survey results
Ohio average 6.7
Last Health inspection on Sep 2025
Health citations are formal notices following inspections when they fail to comply with safety and care standards.
21 of 29 citations resulted from standard inspections; and 8 of 29 resulted from complaint investigations.
Ohio average: 0.3
Ohio average: 0.9
Data sourced from CMS Health Deficiencies reports. Citation severity codes range from A (least serious) to L (most serious). Immediate Jeopardy (J-L) citations indicate situations where the facility's noncompliance has placed residents at risk of death or serious harm.
Nursing Home 24/7 care needed
Assisted Living For seniors needing help with daily tasks but not full-time nursing.
Nursing Home 24/7 care needed
Assisted Living For seniors needing help with daily tasks but not full-time nursing.
Nursing Home 24/7 care needed
Assisted Living For seniors needing help with daily tasks but not full-time nursing.
Nursing Home 24/7 care needed
Assisted Living For seniors needing help with daily tasks but not full-time nursing.
Nursing Home 24/7 care needed
Assisted Living For seniors needing help with daily tasks but not full-time nursing.
![]() 0.0 miles from city center
0.0 miles from city center
![]() COLDWATER, OH 45828
COLDWATER, OH 45828
Add your location
Source: CMS Payroll-Based Journal (Q2 2025)
| Role ⓘ | Count ⓘ | Avg Shift (hrs) ⓘ | Uses Contractors? ⓘ |
|---|---|---|---|
| Registered Nurse | 11 | 9.4 | No |
| Licensed Practical Nurse | 19 | 9.3 | Yes |
| Certified Nursing Assistant | 83 | 7.4 | No |
| Role ⓘ | Employees ⓘ | Contractors ⓘ | Total Staff ⓘ | Total Hours ⓘ | Days Worked ⓘ | % of Days ⓘ | Avg Shift (hrs) ⓘ |
|---|---|---|---|---|---|---|---|
| Certified Nursing Assistant | 83 | 0 | 83 | 18,210 | 91 | 100% | 7.4 |
| Licensed Practical Nurse | 16 | 3 | 19 | 5,320 | 91 | 100% | 9.3 |
| Registered Nurse | 11 | 0 | 11 | 3,300 | 91 | 100% | 9.4 |
| Clinical Nurse Specialist | 5 | 4 | 9 | 1,924 | 70 | 77% | 8 |
| Other Dietary Services Staff | 3 | 0 | 3 | 897 | 90 | 99% | 7.1 |
| Speech Language Pathologist | 0 | 5 | 5 | 843 | 66 | 73% | 6.5 |
| Physical Therapy Aide | 0 | 4 | 4 | 838 | 69 | 76% | 6.1 |
| Administrator | 1 | 0 | 1 | 512 | 64 | 70% | 8 |
| Qualified Social Worker | 0 | 4 | 4 | 468 | 74 | 81% | 5.5 |
| Dietitian | 1 | 0 | 1 | 448 | 56 | 62% | 8 |
| Nurse Practitioner | 1 | 0 | 1 | 408 | 51 | 56% | 8 |
| Respiratory Therapy Technician | 0 | 2 | 2 | 386 | 62 | 68% | 5.9 |
| Therapeutic Recreation Specialist | 0 | 1 | 1 | 359 | 60 | 66% | 6 |
| RN Director of Nursing | 2 | 0 | 2 | 320 | 41 | 45% | 7.8 |
| Physical Therapy Assistant | 0 | 4 | 4 | 243 | 44 | 48% | 5.2 |
| Mental Health Service Worker | 1 | 0 | 1 | 128 | 16 | 18% | 8 |
| Occupational Therapy Aide | 1 | 0 | 1 | 65 | 6 | 7% | 10.9 |
| Occupational Therapy Assistant | 0 | 1 | 1 | 57 | 54 | 59% | 1.1 |
Source: CMS Long-Term Care Facility Characteristics (Data as of Jan 2026)
Residents meet regularly to discuss policies, care quality, and activities
State-approved Nurse Aide Training and Competency Evaluation Program on-site
Part of a Continuing Care Retirement Community offering multiple care levels
Organized group of residents that meets regularly to discuss facility policies, quality of life, and activities.
Data sourced from CMS Long-Term Care Facility Characteristics quarterly report. Payer mix reflects the current resident census by primary payment source.
These measures show how residents usually do over time at this home, based on health outcomes and preventive care.
Ohio average: 5.8
Ohio average: 12.7
Ohio average: 6.8%
Ohio average: 8.9%
Ohio average: 22.0%
Ohio average: 3.4%
Ohio average: 3.9%
Ohio average: 0.5%
Ohio average: 6.2%
Ohio average: 24.0%
Ohio average: 8.4%
Ohio average: 92.4%
Ohio average: 94.5%
Ohio average: 78.0%
Ohio average: 1.3%
Ohio average: 75.6%
Quality measures are calculated from Minimum Data Set (MDS) assessments. For most measures, lower percentages indicate better care quality.
Historical financial and operational data for Briarwood Village based on CMS SNF Cost Reports.
Loading trend charts...
Care Cost Calculator: See Prices in Your Area
Nursing Home Data Explorer
Don’t Wait Too Long: 7 Red Flag Signs Your Parent Needs Assisted Living Now
The True Cost of Assisted Living in 2025 – And How Families Are Paying For It
Understanding Senior Living Costs: Pricing Models, Discounts & Financial Assistance
Touring a community? Use this expert-backed checklist to stay organized, ask the right questions, and find the perfect fit.
We'll send you a PDF version of the touring checklist.