

Occupancy rate
85%
Indiana average: 69%

We arrange tours, appointments, and even moving support so you don’t have to
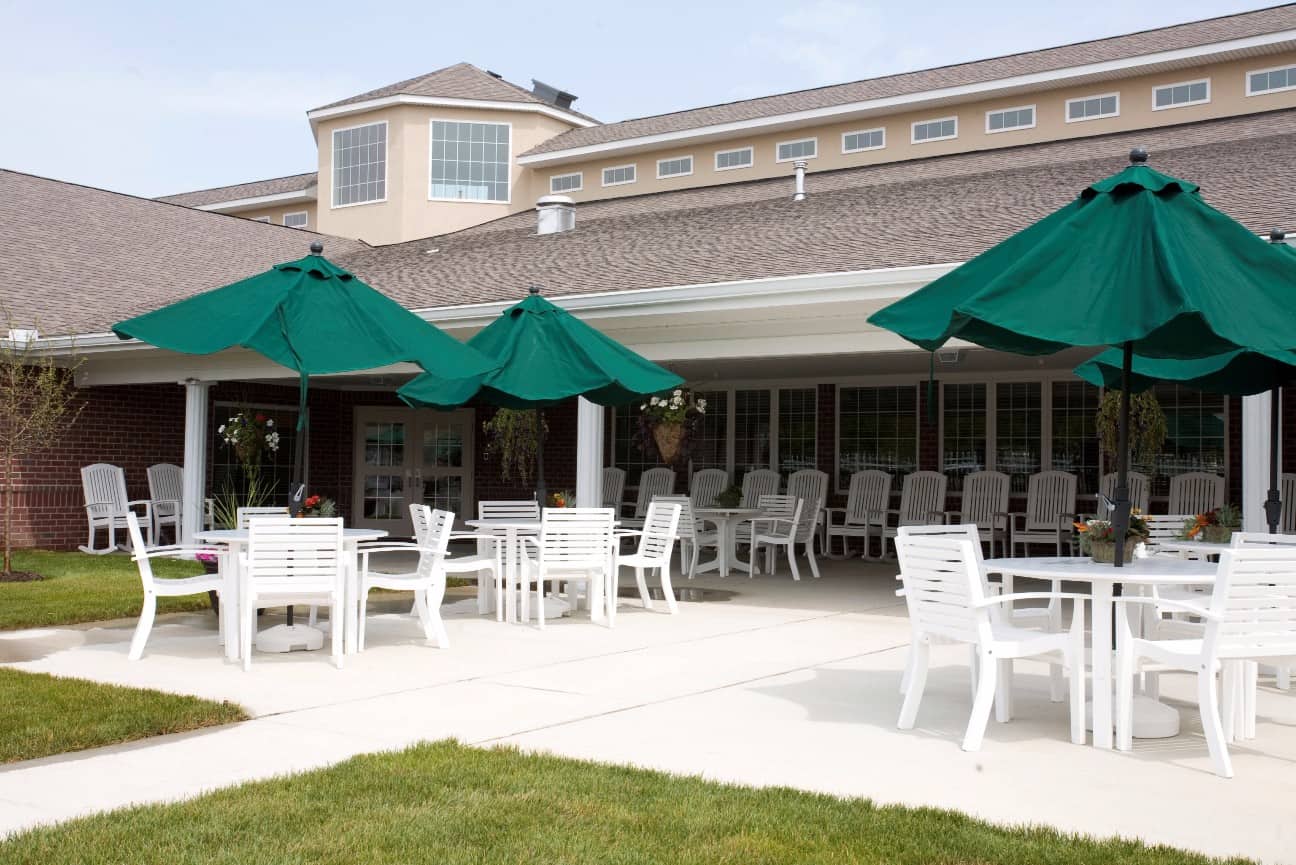
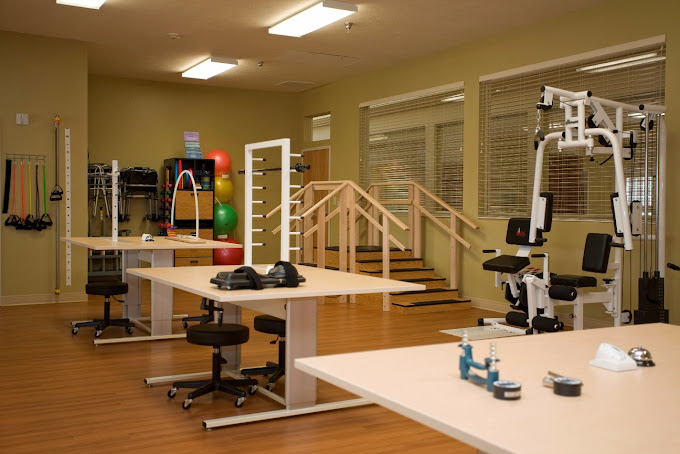
Located in Carmel, Indiana, Bridgewater Healthcare Center shines as a beacon of exceptional senior care, providing not only 24-hour skilled nursing services but also catering to short-term recovery and rehabilitation needs through their advanced rehabilitation unit. This haven of well-being places paramount importance on both emotional and physical wellness, understanding the significance of every detail during one’s golden years.
Committed to holistic well-being, the center offers a diverse range of therapies, including physical, speech, and occupational therapy, addressing a spectrum of needs. Beyond this, Bridgewater Healthcare Center goes the extra mile by providing respite, hospice, and palliative care services, showcasing their unwavering dedication to fulfilling a variety of nursing home requirements. Their expertise even extends to cardiac management, contributing to rehabilitation and post-surgical care. With a steadfast focus on seniors’ well-being and an adherence to nursing home care standards, Bridgewater Healthcare Center offers a sanctuary where every aspect of residents’ health is met with compassionate attention and unwavering commitment.
 Official CMS rating based on health inspections, staffing and quality measures.
Official CMS rating based on deficiencies found during state health inspections.
Official CMS rating based on nurse staffing hours per resident per day.
Official CMS rating based on clinical outcomes for residents.
Average daily nursing hours per resident (adjusted for acuity). Higher values indicate more nursing time per resident.
Hours of care per resident per day, broken down by staff type. Data from CMS Medicare.
Registered nurse hours per resident per day.
Official CMS rating based on health inspections, staffing and quality measures.
Official CMS rating based on deficiencies found during state health inspections.
Official CMS rating based on nurse staffing hours per resident per day.
Official CMS rating based on clinical outcomes for residents.
Average daily nursing hours per resident (adjusted for acuity). Higher values indicate more nursing time per resident.
Hours of care per resident per day, broken down by staff type. Data from CMS Medicare.
Registered nurse hours per resident per day.
Offers a balance of services and community atmosphere.
Occupancy is moderate, suggesting balanced demand.
This home supports both short-term rehab and long-term care, with residents staying for a wide range of durations.
25% of new residents, usually for short-term rehab.
44% of new residents, often for short stays.
30% of new residents, often for long-term daily care.
The portion of the home's budget spent on staff, including nurses, caregivers, and other employees who support care and operations.
All remaining costs needed to run the home, such as food, utilities, building maintenance, supplies and administrative expenses.
Indiana average: 69%
Bridgewater Healthcare Center is legally operated by HANCOCK REGIONAL HOSPITAL, and administrated by PATRICK BURDSALL.
Key information about the people who lead and staff this community.
In Indiana, the Department of Health, Division of Long Term Care is the primary regulatory body that performs onsite inspections and quality of care reviews for all licensed facilities.
11 visits/inspections triggered by complaints
1 with citations
9 without citations
Indiana average: 8 complaint visits
Indiana average: 3 inspections with citations
Formal expressions of dissatisfaction or concern made by residents, or their families regarding various aspects of the care, services, and environment provided.
Indiana average: 4 complaints
Citations indicate regulatory violations. A higher number implies the facility had several areas requiring improvement.
Indiana average: 26 citations
Deficiencies indicate regulatory issues. A higher number implies the facility had several areas requiring improvement.
The most recent inspection on June 16, 2025, found Bridgewater Healthcare Center in compliance with applicable federal and state regulations and identified no deficiencies. Earlier inspections showed a mixed pattern, with some citations related to resident care, medication administration, and life safety code issues, including staff training on fire suppression systems and corridor obstructions. Complaint investigations were mostly unsubstantiated, except for one in March 2025 where staff were cited for not properly using the kitchen fire suppression system, and another in December 2023 involving deficiencies in call light response, colostomy care, and medication documentation. No fines, immediate jeopardy findings, or license actions were listed in the available reports. The facility appears to have addressed prior life safety deficiencies and shows improvement in recent inspections.
Indiana average 6
Last Health inspection on Jun 2025
Health citations are formal notices following inspections when they fail to comply with safety and care standards.
18 of 23 citations resulted from standard inspections; 3 of 23 resulted from complaint investigations; and 2 of 23 came from combined inspections (standard and complaint).
Indiana average: 0.2
Indiana average: 0.6
Data sourced from CMS Health Deficiencies reports. Citation severity codes range from A (least serious) to L (most serious). Immediate Jeopardy (J-L) citations indicate situations where the facility's noncompliance has placed residents at risk of death or serious harm.
Assisted Living For seniors needing help with daily tasks but not full-time nursing.
Independent Living For self-sufficient seniors seeking community and minimal assistance.
Memory Care Specialized care for those with Memory Loss, Alzheimer's, or dementia, ensuring safety and support.
Nursing Homes 24/7 care needed
 Bridgewater Healthcare Center
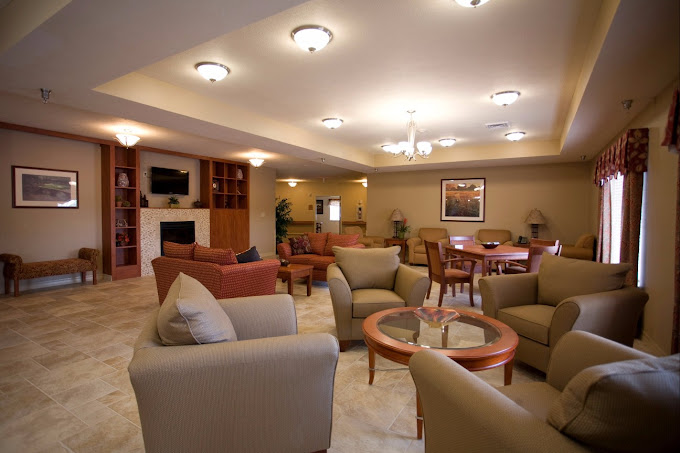
 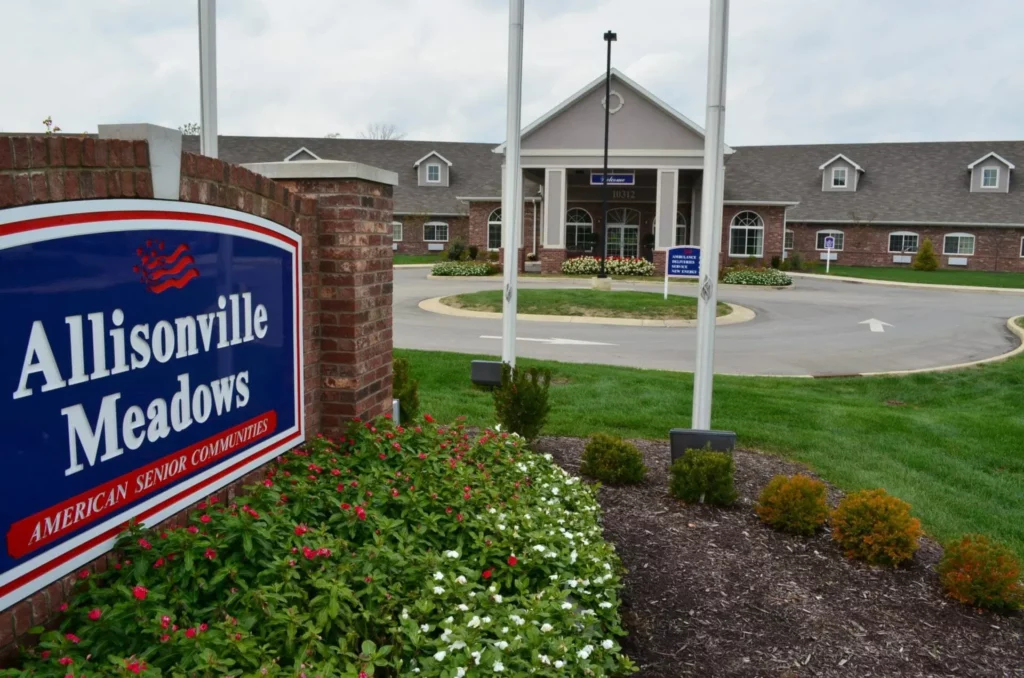 Allisonville Meadows Assisted Living
![]() 8.4 miles from city center — 5.26 miles to nearest hospital (Riverview Health Cancer Center)
8.4 miles from city center — 5.26 miles to nearest hospital (Riverview Health Cancer Center)
![]() 14751 Carey Rd, Carmel, IN 46033
14751 Carey Rd, Carmel, IN 46033
Add your location
Source: CMS Payroll-Based Journal (Q2 2025)
| Role ⓘ | Count ⓘ | Avg Shift (hrs) ⓘ | Uses Contractors? ⓘ |
|---|---|---|---|
| Registered Nurse | 14 | 8.6 | No |
| Licensed Practical Nurse | 28 | 9.3 | No |
| Certified Nursing Assistant | 53 | 8 | No |
| Role ⓘ | Employees ⓘ | Contractors ⓘ | Total Staff ⓘ | Total Hours ⓘ | Days Worked ⓘ | % of Days ⓘ | Avg Shift (hrs) ⓘ |
|---|---|---|---|---|---|---|---|
| Certified Nursing Assistant | 53 | 0 | 53 | 15,523 | 91 | 100% | 8 |
| Licensed Practical Nurse | 28 | 0 | 28 | 8,965 | 91 | 100% | 9.3 |
| Registered Nurse | 14 | 0 | 14 | 4,152 | 91 | 100% | 8.6 |
| Medication Aide/Technician | 7 | 0 | 7 | 2,022 | 88 | 97% | 8.4 |
| Clinical Nurse Specialist | 11 | 0 | 11 | 1,138 | 67 | 74% | 5.8 |
| Qualified Social Worker | 0 | 5 | 5 | 879 | 66 | 73% | 6.8 |
| Physical Therapy Aide | 0 | 5 | 5 | 864 | 67 | 74% | 6.9 |
| Respiratory Therapy Technician | 0 | 4 | 4 | 830 | 74 | 81% | 6.3 |
| Dietitian | 1 | 0 | 1 | 568 | 65 | 71% | 8.7 |
| Dental Services Staff | 1 | 0 | 1 | 519 | 67 | 74% | 7.8 |
| Nurse Practitioner | 1 | 0 | 1 | 512 | 64 | 70% | 8 |
| Mental Health Service Worker | 1 | 0 | 1 | 512 | 64 | 70% | 8 |
| Administrator | 1 | 0 | 1 | 504 | 63 | 69% | 8 |
| Other Dietary Services Staff | 1 | 0 | 1 | 487 | 66 | 73% | 7.4 |
| Physical Therapy Assistant | 0 | 7 | 7 | 415 | 65 | 71% | 5.9 |
| Speech Language Pathologist | 0 | 5 | 5 | 388 | 63 | 69% | 5 |
| RN Director of Nursing | 3 | 0 | 3 | 319 | 29 | 32% | 9.1 |
| Occupational Therapy Aide | 1 | 0 | 1 | 274 | 38 | 42% | 7.2 |
| Occupational Therapy Assistant | 1 | 0 | 1 | 72 | 9 | 10% | 8 |
| Medical Director | 0 | 1 | 1 | 59 | 15 | 16% | 3.9 |
| Qualified Activities Professional | 0 | 1 | 1 | 6 | 5 | 5% | 1.2 |
Source: CMS Long-Term Care Facility Characteristics (Data as of Jan 2026)
Residents meet regularly to discuss policies, care quality, and activities
Organized group of residents that meets regularly to discuss facility policies, quality of life, and activities.
Data sourced from CMS Long-Term Care Facility Characteristics quarterly report. Payer mix reflects the current resident census by primary payment source.
These measures show how residents usually do over time at this home, based on health outcomes and preventive care.
Indiana average: 8.0
Indiana average: 17.1
Indiana average: 12.0%
Indiana average: 14.4%
Indiana average: 24.6%
Indiana average: 3.9%
Indiana average: 4.4%
Indiana average: 1.2%
Indiana average: 5.7%
Indiana average: 24.1%
Indiana average: 12.4%
Indiana average: 93.7%
Indiana average: 95.4%
Indiana average: 1.60
Indiana average: 1.48
Indiana average: 81.7%
Indiana average: 1.4%
Indiana average: 79.0%
Indiana average: 22.4%
Indiana average: 10.5%
Indiana average: 0.8%
Indiana average: 53.7%
Indiana average: 50.6%
Quality measures are calculated from Minimum Data Set (MDS) assessments. For most measures, lower percentages indicate better care quality.
Historical financial and operational data for Bridgewater Healthcare Center based on CMS SNF Cost Reports.
Loading trend charts...
Care Cost Calculator: See Prices in Your Area
Nursing Home Data Explorer
Don’t Wait Too Long: 7 Red Flag Signs Your Parent Needs Assisted Living Now
The True Cost of Assisted Living in 2025 – And How Families Are Paying For It
Understanding Senior Living Costs: Pricing Models, Discounts & Financial Assistance

Touring a community? Use this expert-backed checklist to stay organized, ask the right questions, and find the perfect fit.
We'll send you a PDF version of the touring checklist.


