Brittany Manor

Nursing Home
Overview of Brittany Manor

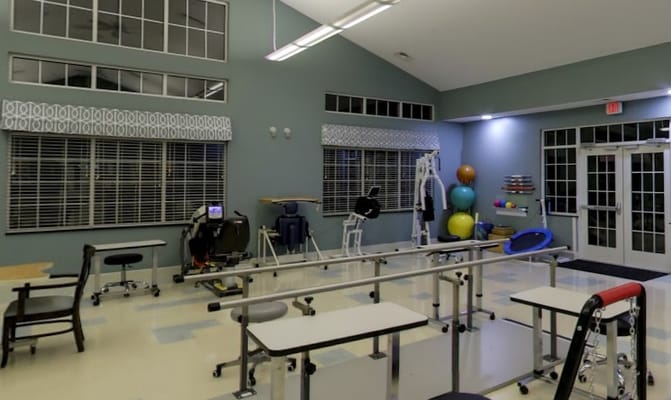
Have a wondrous retirement with the enticing senior living community of Brittany Manor at Midland, MI, that provides long-term and short-term sub-acute rehabilitative services. The community is committed to making its residents feel at home through a dedicated team, working 24/7 to curate personalized care and utmost support. The community endeavors to provide all residents a smile with satisfaction by ensuring to meet all their needs and preferences.

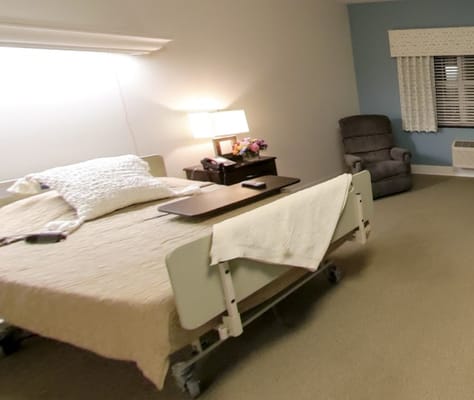
Brittany Manor, with a professional and compassionate team, works closely with the residents to meticulously craft professional care that feels personal. With exceptional amenities, including healthy and delicious meals that taste great, residents can enjoy the pristine, homelike living environment. The community strives to offer high-quality care to make the retirement journey fulfilling and worth remembering.

(989) 631-0460

Quality ratings

Measured by Centers for Medicare & Medicaid Services (CMS)

Overall rating Info Official CMS rating based on health inspections, staffing and quality measures.
3/5
Michigan average: 3.1/5
Health Inspection Info Official CMS rating based on deficiencies found during state health inspections.
3/5
Michigan average: 2.8/5
Staffing Info Official CMS rating based on nurse staffing hours per resident per day.
4/5
Michigan average: 3.5/5
Quality Measures Info Official CMS rating based on clinical outcomes for residents.
3/5
Michigan average: 3.8/5

Nursing care per resident

Info Average daily nursing hours per resident (adjusted for acuity). Higher values indicate more nursing time per resident.
4h 16m per day

This home provides 1% less nursing time per resident than the state average.

Michigan average: 4h 18m per day

Capacity and availability

Medium-capacity home

Offers a balance of services and community atmosphere.

Total beds 150

This home usually has availability

Lower occupancy suggests more openings may be available.

Lower demand than the Michigan average
Occupancy rate 54.8%
Residents per day (avg) 89
Occupancy rate
54.8%
Residents per day (avg)
89

Who this home usually serves

TYPE OF STAY

Primarily short stays

Residents typically stay for brief periods, with frequent admissions and discharges throughout the year.

Might be optimal for
Post-acute recovery Temporary care Transitional stays

Breakdown by payment type

Medicare

22% of new residents, usually for short-term rehab.

Typical stay 28 days

Private pay

78% of new residents, often for short stays.

Typical stay 2 - 3 months

Finances and operations

Proprietary home
Corporation
Home revenue
$21.9M
Operating loss
-$409.9K
Proprietary home Corporation
Home revenue
$21,896,793.00
Operating loss
$-409,941.00
Payroll costs Info The portion of the home's budget spent on staff, including nurses, caregivers, and other employees who support care and operations.
$5.5M
25.1% of revenue
Other operating costs Info All remaining costs needed to run the home, such as food, utilities, building maintenance, supplies and administrative expenses.
$16.8M
Total costs $22.3M
Years in operation
27 years in operation
A longer operating history, which may indicate experience navigating regulations and delivering ongoing care.
Walk Score
Walk Score: 13 / 100
Car-dependent. Most errands require a car, with limited nearby walkable options.
BBB Rating
BBB Rating: A+ (Not Accredited)
An independent rating from the Better Business Bureau based on factors such as complaint history, transparency, and business practices.
How BBB ratings work

Additional licensing details

CMS Certification Number: 235245

Staffing

Key information about the people who lead and staff this community.

Leadership

Contact: Tami Hunt, Owner

Care Services

Alzheimer's Certification

What does this home offer?

Accepts Medicaid icon

Accept Medicaid: Yes, Accept

Total residents icon

Total Residents: 140 Residents

Housing options icon

Housing Options: Private / Semi-Private Rooms

Building type icon
Building type icon

Building Type: Single-story

Fitness and recreation icon

Fitness and Recreation

Transportation services icon

Transportation Services

Dining services icon

Three Meals Per Day

Types of Care at Brittany Manor

Nursing Care Memory Care Hospice Care
Contact Brittany Manor

Compare Nursing Homes around Midland

The information below is reported by the Michigan Department of Licensing and Regulatory Affairs (LARA).
Brittany Manor
AL

Assisted Living For seniors needing help with daily tasks but not full-time nursing.

IL

Independent Living For self-sufficient seniors seeking community and minimal assistance.

MC

Memory Care Specialized care for those with Memory Loss, Alzheimer's, or dementia, ensuring safety and support.

SNF

Nursing Homes 24/7 care needed

Midland
150
No
A+
13
ROBINSON, SHANNON
54.8%
$20,316,461.00
$5,494,989.00
27%
88.80
3/5
4.2725
3/5
4/5
3/5
20
4
-9%
-1%
-28%
Private / Semi-Private Rooms
Midland King’s Daughters Home
SNF

Nursing Home 24/7 care needed

AL

Assisted Living For seniors needing help with daily tasks but not full-time nursing.

MI 48640
30
No
-
-
-
-
-
-
-
-
-
-
-
-
-
-
-
-
-
-
Private / Semi-Private Rooms

Places of interest near Brittany Manor

Address 3.9 miles from city center

Address 3615 E Ashman St, Midland, MI 48642

Calculate Travel Distance to Brittany Manor

Add your location

Address

Staffing Data

Source: CMS Payroll-Based Journal (Q2 2025)

143
Total Staff
122
Employees
21
Contractors
41,476
Total Hours (Quarter)
54
Avg Staff/Day
8.4
Avg Shift (hrs)
Nursing Staff Breakdown
Role Count Avg Shift (hrs) Uses Contractors?
Registered Nurse139.6 No
Licensed Practical Nurse209.5 No
Certified Nursing Assistant718.6 No
Staff by Category
Administration
2 staff
5.8hs shift avg
Nursing Staff
104 staff
8.9hs shift avg
Physicians & Practitioners
9 staff
8.1hs shift avg
Therapy Services
16 staff
6.3hs shift avg
Activities & Recreation
0 staff
0hs shift avg
Social Services
1 staff
8.2hs shift avg
Dietary Services
9 staff
7.9hs shift avg
Other Services
2 staff
8.2hs shift avg
Contractor Analysis
10.9%
of total hours from contractors
4,505 contractor hours this quarter
Speech Language Pathologist: 5 Physical Therapy Assistant: 7 Clinical Nurse Specialist: 3 Qualified Social Worker: 1 Respiratory Therapy Technician: 1 Medical Director: 1 Occupational Therapy Assistant: 2 Occupational Therapy Aide: 1
Role Employees Contractors Total Staff Total Hours Days Worked % of Days Avg Shift (hrs)
Certified Nursing Assistant7107119,13591100%8.6
Licensed Practical Nurse200207,72391100%9.5
Registered Nurse130134,27691100%9.6
Other Dietary Services Staff8082,09791100%7.9
Physical Therapy Assistant0771,8127886%7.1
Clinical Nurse Specialist5381,7726774%8.1
Speech Language Pathologist0551,6757987%6.7
Dental Services Staff2025706470%8.2
Administrator1015206571%8
Dietitian1015126470%8
Respiratory Therapy Technician0114687380%6.4
Nurse Practitioner1014565763%8
Qualified Social Worker0112142629%8.2
Occupational Therapy Aide0111222224%5.5
Occupational Therapy Assistant022715358%1.3
Medical Director011543437%1.6

Health Inspection History

Inspections
Total health inspections 7

Michigan average 6.5


Last Health inspection on Nov 2025

Total health citations 20
Citations per inspection
2.86

Health citations are formal notices following inspections when they fail to comply with safety and care standards.

14 of 20 citations resulted from standard inspections; 5 of 20 resulted from complaint investigations; and 1 of 20 came from combined inspections (standard and complaint).

Breakdown of citation severity (last 3 years)
Critical Health citations More info 0
100% better than Michigan average

Michigan average: 0.3


Serious Health citations More info 4
111% worse than Michigan average

Michigan average: 1.9

0 critical citations More info Michigan average: 0.3

4 serious citations More info Michigan average: 1.9

16 moderate citations More info Michigan average: 30.8

0 minor citations More info Michigan average: 0.5
Citations history (last 3 years)
Abuse/Neglect serious citation Nov 06, 2025
Corrected

Abuse/Neglect moderate citation Oct 08, 2025
Corrected

Nutrition moderate citation Mar 27, 2025
Corrected

Care Planning moderate citation Mar 27, 2025
Corrected

Facility Characteristics

Source: CMS Long-Term Care Facility Characteristics (Data as of Jan 2026)

Ownership: For-Profit LLC
Part of: Ciena Healthcare
Resident Census by Payment Source
91 Total Residents
Medicare 37 (40.7%)
Medicaid 38 (41.8%)
Private Pay/Other 16 (17.6%)
Programs & Services
Residents' Group
Family Engagement

Active councils help families stay involved in care decisions and facility operations.

Quality of care over time

These measures show how residents usually do over time at this home, based on health outcomes and preventive care.

High-risk clinical events score Info A composite score based on pressure ulcers, falls with injury, weight loss, walking ability decline, and activities of daily living decline. 13.0
55% worse than Michigan average

Michigan average: 8.4

Functional decline score Info A composite score based on activities of daily living decline, walking ability decline, and incontinence. 22.4
37% worse than Michigan average

Michigan average: 16.3

Long-stay resident measures
Need for Help with Daily Activities Increased Info Percent of long-stay residents whose need for help with daily activities has increased 19.9%
60% worse than Michigan average

Michigan average: 12.5%

Walking Ability Worsened Info Percent of long-stay residents whose ability to move independently worsened 24.8%
62% worse than Michigan average

Michigan average: 15.3%

Low Risk Residents with Bowel/Bladder Incontinence Info Percent of low risk long-stay residents who lose control of their bowels or bladder 22.4%
7% worse than Michigan average

Michigan average: 21.0%

Falls with Major Injury Info Percent of long-stay residents experiencing one or more falls with major injury 3.6%
14% worse than Michigan average

Michigan average: 3.2%

High Risk Residents with Pressure Ulcers Info Percent of long-stay high risk residents with pressure ulcers 11.6%
102% worse than Michigan average

Michigan average: 5.7%

Urinary Tract Infection Info Percent of long-stay residents with a urinary tract infection 4.5%
165% worse than Michigan average

Michigan average: 1.7%

Lost Too Much Weight Info Percent of long-stay residents who lose too much weight 5.2%
8% better than Michigan average

Michigan average: 5.7%

Depressive Symptoms Info Percent of long-stay residents who have depressive symptoms 0.5%
88% better than Michigan average

Michigan average: 3.9%

Antipsychotic Use Info Percent of long-stay residents who received an antipsychotic medication 11.5%
23% better than Michigan average

Michigan average: 15.0%

Pneumococcal Vaccine Info Percent of long-stay residents assessed and appropriately given the pneumococcal vaccine 98.0%
In line with Michigan average

Michigan average: 94.9%

Influenza Vaccine Info Percent of long-stay residents assessed and appropriately given the seasonal influenza vaccine 94.7%
In line with Michigan average

Michigan average: 95.0%

Short-stay resident measures
Pneumococcal Vaccine Info Percent of short-stay residents assessed and appropriately given the pneumococcal vaccine 95.7%
16% better than Michigan average

Michigan average: 82.5%

Antipsychotic medication increase Info Percent of short-stay residents who newly received an antipsychotic medication 0.8%
45% better than Michigan average

Michigan average: 1.4%

Influenza Vaccine Info Percent of short-stay residents assessed and appropriately given the seasonal influenza vaccine 81.6%
In line with Michigan average

Michigan average: 79.5%

Guides for Better Senior Living

Care Cost Calculator: See Prices in Your Area

Nursing Home Data Explorer

Don’t Wait Too Long: 7 Red Flag Signs Your Parent Needs Assisted Living Now

The True Cost of Assisted Living in 2025 – And How Families Are Paying For It

Understanding Senior Living Costs: Pricing Models, Discounts & Financial Assistance

Financial Aid for Michigan Seniors

Get financial aid guidance

MI Choice Waiver

Michigan Medicaid MI Choice Waiver

Age 65+ or disabled, Michigan resident, Medicaid- eligible, nursing home-level care need.

~$2,829/month (300% FBR, individual).

$2,000 (individual), $3,000 (couple).

Delivered through regional waiver agents; waitlists possible.

Home Help Program

Michigan Home Help

Age 65+ or disabled, Michigan resident, Medicaid- eligible or low-income.

~$1,732/month (individual, Medicaid threshold).

$2,000 (individual).

Can hire family caregivers; less intensive than waiver.

Program of All-Inclusive Care for the Elderly (PACE)

Michigan PACE

Age 55+, Michigan resident, nursing home-level care need, safe with PACE support.

~$2,829/month (Medicaid-eligible); private pay option available.

$2,000 (individual), $3,000 (couple).

16 PACE centers (e.g., Ingham, Wayne counties); expanding slowly.

Medicare Savings Program (MSP)

Michigan Medicare Savings Program

Age 65+ or disabled, Michigan resident, Medicare Part A/B.

~$2,510/month (QMB), ~$3,380/month (SLMB), ~$3,598/month (QI)—individual.

$9,430 (individual), $14,130 (couple).

Three tiers; no waitlist; includes Extra Help for Part D.

National Family Caregiver Support Program (NFCSP) Respite

Michigan NFCSP Respite Care

Caregivers of 60+ needing care or 55+ caregivers of others; Michigan resident; functional needs (2+ ADLs).

Prioritizes ~$24,980/year (individual); no strict cap.

Not assessed; need-based.

16 AAAs; prioritizes low-income, rural caregivers.

Senior Community Service Employment Program (SCSEP)

Michigan SCSEP

Age 55+, unemployed, low-income, Michigan resident.

~$1,983/month (125% FPL).

Not specified; income-focused.

Priority for veterans, rural residents; Operation ABLE partnership.

VA Aid and Attendance (A&A) and Housebound Benefits

Michigan VA Aid and Attendance/Housebound

Age 65+ or disabled veteran/spouse, Michigan resident, wartime service, need for ADL help (A&A) or homebound.

Net income < ~$1,984/month (veteran with dependent, A&A); pension offsets income.

~$155,356 (net worth limit).

High veteran demand in urban/rural areas.

Who we are

Your Senior Care Partner, Every Step of the Way

We help families find affordable senior communities and unlock same day discounts, Medicaid, and Medicare options tailored to your needs.

Contact us Today
Tour Icon
Planning a tour? Check our touring checklist.
Chat Icon
Thinking of living here? We can help you speak to a current resident