Brittany Manor

Nursing Home, Nursing Care, Memory Care & Hospice Care · Midland, MI
CMS overall rating Info The Overall CMS Rating is scored from 1 to 5 stars and combines results from health inspections, staffing levels, and quality measures. Health inspections carry the most weight. Staffing and quality scores can increase or decrease the final rating based on performance compared to state and national standards.
Brittany Manor

Nursing Home in Midland

CMS overall rating Info The Overall CMS Rating is scored from 1 to 5 stars and combines results from health inspections, staffing levels, and quality measures. Health inspections carry the most weight. Staffing and quality scores can increase or decrease the final rating based on performance compared to state and national standards.
Calculator: See prices in your area
Brittany Manor accepts Medicare and private pay.

Overview of Brittany Manor

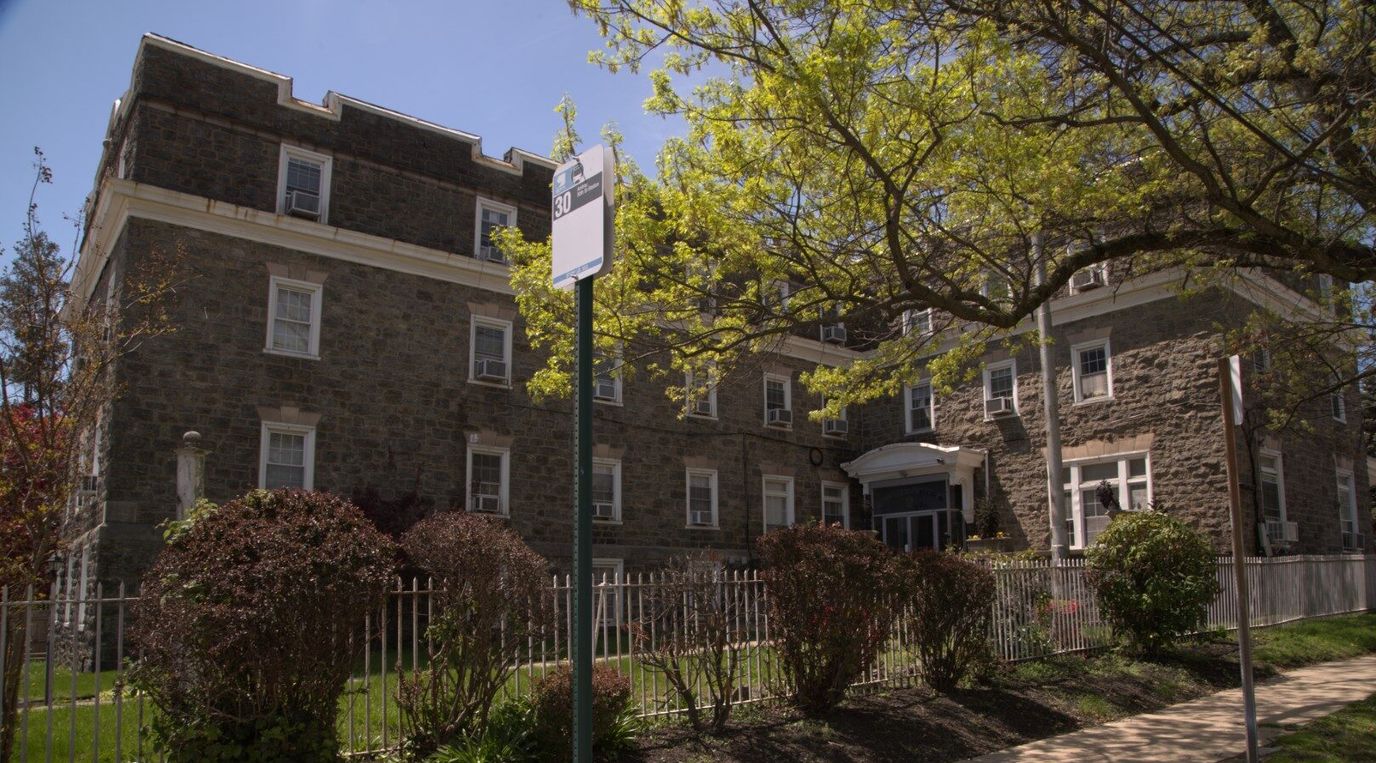
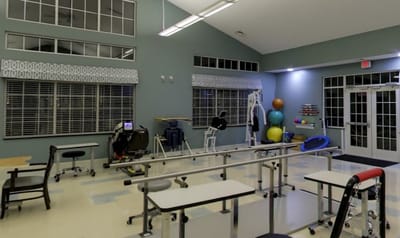
Have a wondrous retirement with the enticing senior living community of Brittany Manor at Midland, MI, that provides long-term and short-term sub-acute rehabilitative services. The community is committed to making its residents feel at home through a dedicated team, working 24/7 to curate personalized care and utmost support. The community endeavors to provide all residents a smile with satisfaction by ensuring to meet all their needs and preferences.

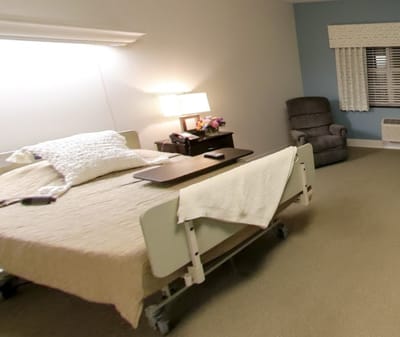
Brittany Manor, with a professional and compassionate team, works closely with the residents to meticulously craft professional care that feels personal. With exceptional amenities, including healthy and delicious meals that taste great, residents can enjoy the pristine, homelike living environment. The community strives to offer high-quality care to make the retirement journey fulfilling and worth remembering.

(989) 631-0460

Quality ratings

Measured by Centers for Medicare & Medicaid Services (CMS)

Overall rating Info The Overall CMS Rating combines results from health inspections, staffing levels and quality measures. Health inspections carry the most weight. Staffing and quality scores can increase or decrease the final rating based on performance compared to state and national standards.
▼ 15.5% Below MI avg.
Health Inspection Info Based on the results of the facility's three most recent standard inspections and any complaint investigations. CMS reviews the number, scope, and severity of deficiencies, with more recent findings weighted more heavily.
▼ 9.9% Below MI avg.
Staffing Info Measures average nursing staff hours per resident per day, including Registered Nurses (RNs) and total nursing staff. Ratings are adjusted based on the level of care residents require and are compared to state and national benchmarks.
▲ 19.0% Above MI avg.
Quality Measures Info Based on clinical and physical health indicators reported to CMS, such as hospital readmissions, falls, pressure ulcers, and improvements in mobility. These measures reflect how well residents' health needs are being managed.
▼ 21.3% Below MI avg.

Staffing hours breakdown

Info Daily nursing hours per resident by staff type, reported to CMS. Higher is generally better — compare this facility to state and national averages to see where staffing stands.

Hours per resident per day — compared to Michigan state averages

Total nursing care / resident Info This home is ranked 27th out of 94 homes in Michigan.

Total adjusted nursing hours per resident per day, combining RN, LPN, and aide time. CMS adjusts this for case-mix so facilities can be fairly compared.
4h 16m per day
Rank #27 / 94Nurse hours — state benchmarkedThis home is ranked 27th out of 94 homes in Michigan.Shows adjusted nurse hours per resident per day benchmarked to the Michigan average, with a ranking across 94 Michigan SNFs. More hours mean more direct care. The national average is about 3.5 hrs; below 3.0 is a red flag.
This facility Michigan avg (4h 15m per day)
vs Michigan avg
+1%
Staff typeHours / dayvs state avg
Total Nursing (Weekend) Info Combined nursing hours (RN + LPN + Nurse Aide) per resident per day on weekends. Staffing often drops on weekends — this figure reveals whether the facility maintains adequate coverage outside of weekday hours. 3h 38m per day

Capacity and availability

This home usually has availability

Occupancy lower than 85% suggests more openings may be available.

Lower occupancy than the Michigan average: 75.8%
Occupancy rate 54.8% Rank #67 / 96Occupancy rate — state benchmarkedThis home is ranked 67th out of 96 homes in Michigan.Shows this facility's occupancy rate versus the Michigan average, with its statewide rank out of 96. Higher occupancy signals strong local demand and financial stability.
Avg. Length of Stay 63 days
Occupancy rate
54.8% Rank #67 / 96Occupancy rate — state benchmarkedThis home is ranked 67th out of 96 homes in Michigan.Shows this facility's occupancy rate versus the Michigan average, with its statewide rank out of 96. Higher occupancy signals strong local demand and financial stability.
Avg. Length of Stay
63 days

Who this home usually serves

TYPE OF STAY

Primarily short stays

Residents typically stay for brief periods, with frequent admissions and discharges throughout the year.

Breakdown by payment type

Medicare

22% of new residents, usually for short-term rehab.

Typical stay 28 days

Private pay

78% of new residents, often for short stays.

Typical stay 2 - 3 months

Finances and operations

Privately-owned community
Operated by a business corporation.
Home revenue
$21.9M
Operating loss
-$409.9K
Privately-owned community Operated by a business corporation.
Home revenue
$21.9M Rank #28 / 95Revenue — state benchmarkedThis home is ranked 28th out of 95 homes in Michigan.Shows this facility's annual revenue compared to the Michigan SNF average. Higher revenue generally means more resources for staffing and capital — read alongside Payroll %.
Operating loss
-$409.9K
Payroll costs Info The portion of the home's budget spent on staff, including nurses, caregivers, and other employees who support care and operations. Rank #50 / 95Payroll — state benchmarkedThis home is ranked 50th out of 95 homes in Michigan.Shows total annual staff payroll benchmarked to the Michigan average. Higher payroll investment relative to peers often signals better staffing and less reliance on cheaper contract labor.
$7.3M
33.2% of revenue Rank #83 / 95Payroll % — state benchmarkedThis home is ranked 83rd out of 95 homes in Michigan.Shows payroll as a percentage of revenue versus the Michigan average. Well-run SNFs often land around 55–65%. Below 25% may signal understaffing or heavy agency use — read with Staffing ratings.
Other operating costs Info All remaining costs needed to run the home, such as food, utilities, building maintenance, supplies and administrative expenses.
$15.0M
Total costs $22.3M
Years in operation
27 years in operation
A longer operating history, which may indicate experience navigating regulations and delivering ongoing care.
Walk Score
Walk Score: 13 / 100 Rank #57 / 70Walk Score — state benchmarkedThis home is ranked 57th out of 70 homes in Michigan.Shows how walkable this facility's neighborhood is compared to the average Walk Score across Michigan SNFs. Higher scores benefit residents, families, and staff.
Car-dependent. Most errands require a car, with limited nearby walkable options.
BBB Rating
BBB Rating: A+ (Not Accredited)
An independent rating from the Better Business Bureau based on factors such as complaint history, transparency, and business practices.
How BBB ratings work

About this community

License Details

CMS Certification Number235245

Staffing

Key information about the people who lead and staff this community.

Leadership

ContactTami Hunt, Owner

Payment & Insurance

1 service
Accept Medicare

Therapy & Rehabilitation

3 services
Rehabilitation Services
Respite Care
Short-Term Rehab

Staffing & Medical

2 services
Doctor on Staff
24-Hour Staffing

Memory & Specialized Care

1 service
No Alzheimer's certification

Additional Services

1 service
Short-Term Rehabilitation

Additional Policies & Features

Pets Allowed

Amenities & Lifestyle

Private And Semi Private Rooms
Nutritionally Balanced Meals With Selective Menus And Salad Bar
Social Dining Areas
Fine Dining Program With 24 Hour Kitchen Service
Unlimited Visiting Hours
Private Lounge For Family Gatherings
Beautician/Barber Shop
Religious/Non-Denominational Services
Transportation To Nearby Appointments
Outside Activities Including Nature Tours
Shopping And Movies
Visiting Pets Are Welcome
Resident And Family Councils
Beautiful Outdoor Courtyard
Specific ProgramsNursing & Rehabilitation, Tube Feeding Care, 24-Hour Nursing Care, Bariatric Care, Case Management, Discharge Planning, and Social Work, Congestive Heart Failure Program, Comprehensive Dental Care, Dialysis Treatment, Dietary and Nutritional Services, Infectious Disease Management, IV Therapy, Occupational Therapy, Ophthalmology, Vision Care, & Audiology Services, Outpatient Therapy, Pain Management, Palliative Care, Pharmacy, Laboratory, and Radiology Services, Physical Therapy Services, Podiatry Services, Psychiatry and Psychology Services, Recreational Therapy, Respiratory Management Services, Restorative Nursing and Assistance With ADL, Sepsis Program, Short-Term Nursing and Rehabilitation, Speech Therapy / Speech Language Pathology, Substance Abuse Management Services, Total Parenteral Nutrition (TPN), Tracheostomy Care
Religious ServicesYes

Dining & Nutrition

Food DescriptionNutritionally balanced meals with selective menus and salad bar; fine dining program with 24 hour kitchen service.

What does this home offer?

Total residents icon

Total Residents: 140 Residents

Housing options icon

Housing Options: Private / Semi-Private Rooms

Building type icon
Building type icon

Building Type: Single-story

Fitness and recreation icon

Fitness and Recreation

Transportation services icon

Transportation Services

Dining services icon

Three Meals Per Day

Types of Care at Brittany Manor

Nursing Care Memory Care Hospice Care

Contact Brittany Manor

Access & Eligibility

Ways to qualify for care at this community, including accepted programs.

Medicare Accepted

This facility is certified for eligible Medicare services.

Health Inspection History

Inspections
Total health inspections 7

Michigan average 6.5


Last Health inspection on Nov 2025

Total health citations
20 Rank #36 / 96Health citations — state benchmarkedThis home is ranked 36th out of 96 homes in Michigan.Shows this facility's total health deficiency citations benchmarked to the Michigan state average, with a ranking across all 96 MI SNFs. Lower citation counts earn a better rank.

Michigan average 33.5

Citations per inspection
2.86 Rank #12 / 96Citations per inspection — state benchmarkedThis home is ranked 12th out of 96 homes in Michigan.Shows average deficiency citations per CMS inspection for this facility versus the Michigan mean across 96 SNFs with citation data. Lower is better.

Michigan average 5.18


Health citations are formal notices following inspections when they fail to comply with safety and care standards.

14 of 20 citations resulted from standard inspections; 5 of 20 resulted from complaint investigations; and 1 of 20 came from combined inspections (standard and complaint).

Breakdown of citation severity (last 3 years)
Critical Health citations More info
0
100% better than Michigan average

Michigan average: 0.3


Serious Health citations More info 4
111% worse than Michigan average

Michigan average: 1.9

0 critical citations More info Michigan average: 0.3

4 serious citations More info Michigan average: 1.9

16 moderate citations More info Michigan average: 30.8

0 minor citations More info Michigan average: 0.5
Citations history (last 3 years)
Abuse/Neglect serious citation Info Issues related to protecting resident's from harm, including abuse, neglect, or mistreatment. Nov 06, 2025
Corrected

Abuse/Neglect moderate citation Info Issues related to protecting resident's from harm, including abuse, neglect, or mistreatment. Oct 08, 2025
Corrected

Nutrition moderate citation Info Issues related to food quality, meal service, and resident's nutritional needs. Mar 27, 2025
Corrected

Care Planning moderate citation Info Issues related to creating and updating personalized care plans for residents based on their needs and conditions. Mar 27, 2025
Corrected

Financial Assistance for
Nursing Home in Michigan

Brittany Manor is located in Midland, Michigan.
Here are the financial assistance programs available to residents in Michigan.

Get Financial aid guidance

MI Choice Waiver

Michigan Medicaid MI Choice Waiver

Age 65+ or disabled
General Michigan resident, Medicaid- eligible, nursing home-level care need.
Income Limits (2025) ~$2,829/month 300% FBR, individual
Asset Limits $2,000 (individual), $3,000 (couple).
MI

Delivered through regional waiver agents; waitlists possible.

Benefits
Personal care (5-7 hours/day) Respite care (240 hours/year) Home modifications ($1,500 avg.) Adult day care ($65/day)

Home Help Program

Michigan Home Help

Age 65+ or disabled
General Michigan resident, Medicaid- eligible or low-income.
Income Limits ~$1,732/month individual, Medicaid threshold
Asset Limits $2,000 individual
MI

Can hire family caregivers; less intensive than waiver.

Benefits
Personal care (up to 60 hours/month) Homemaker services Respite (varies)

Program of All-Inclusive Care for the Elderly (PACE)

Michigan PACE

Age 55+
General Michigan resident, nursing home-level care need, safe with PACE support.
Income Limits (2025) ~$2,829/month (Medicaid-eligible); private pay option available.
Asset Limits $2,000 (individual), $3,000 (couple).
MI

16 PACE centers (e.g., Ingham, Wayne counties); expanding slowly.

Benefits
Personal care (5-7 hours/day) Medical care Meals Transportation Therapy Respite

Medicare Savings Program (MSP)

Michigan Medicare Savings Program

Age 65+ or disabled
General Michigan resident, Medicare Part A/B.
Income Limits (2025) ~$2,510/month (QMB), ~$3,380/month (SLMB), ~$3,598/month (QI)—individual.
Asset Limits $9,430 (individual), $14,130 (couple).
MI

Three tiers; no waitlist; includes Extra Help for Part D.

Benefits
Covers Part B premiums ($174.70/month) Deductibles ($240/year) Copays (~20%)

National Family Caregiver Support Program (NFCSP) Respite

Michigan NFCSP Respite Care

Age
General Caregivers of 60+ needing care or 55+ caregivers of others; Michigan resident; functional needs (2+ ADLs).
Income Limits (2025) Prioritizes ~$24,980/year (individual); no strict cap.
Asset Limits Not assessed; need-based.
MI

16 AAAs; prioritizes low-income, rural caregivers.

Benefits
Respite (4-6 hours/week or 5 days/year) Adult day care ($60/day) Caregiver training

Senior Community Service Employment Program (SCSEP)

Michigan SCSEP

Age 55+
General unemployed, low-income, Michigan resident.
Income Limits (2025) ~$1,983/month 125% FPL
Asset Limits Not specified; income-focused.
MI

Priority for veterans, rural residents; Operation ABLE partnership.

Benefits
Paid training (~20 hours/week at ~$7.25/hour) Job placement

VA Aid and Attendance (A&A) and Housebound Benefits

Michigan VA Aid and Attendance/Housebound

Age 65+ or disabled veteran/spouse
General Michigan resident, wartime service, need for ADL help (A&A) or homebound.
Income Limits (2025) Net income < ~$1,984/month (veteran with dependent, A&A); pension offsets income.
Asset Limits ~$155,356 net worth limit
MI

High veteran demand in urban/rural areas.

Benefits
Cash (~$1,433-$2,642/month veteran, ~$951-$1,318 spouse) for care costs

Places of interest near Brittany Manor

Address 3.9 miles from city center Info Estimated distance in miles from Midland's city center to Brittany Manor's address, calculated via Google Maps.

Calculate Travel Distance to Brittany Manor

Add your location

Address

Staffing Data (Q2 2025)

This data corresponds to Q2 2025 and is based on CMS Payroll-Based Journal.

Total staff 143
Employees 122
Contractors 21
Staff to resident ratio 1.57:1
10% worse than Michigan average

Michigan average ratio: 1.75:1

Avg staff/day 54
Average shift 8.4 hours
6% better than Michigan average

Michigan average: 7.9 hours

Total staff hours (quarter) 41,476
Nursing staff breakdown
Registered Nurse

Manages medical care and health needs.

Total count 13
Average shift length Info Average shift length. Calculated as total hours divided by days worked and average staff per day. 9.6 hours

No contractors work on this role.

Licensed Practical Nurse

Assists with medical care and medications.

Total count 20
Average shift length Info Average shift length. Calculated as total hours divided by days worked and average staff per day. 9.5 hours

No contractors work on this role.

Certified Nursing Assistant

Helps with daily care and mobility.

Total count 71
Average shift length Info Average shift length. Calculated as total hours divided by days worked and average staff per day. 8.6 hours

No contractors work on this role.

Contractor staffing

Total hours from contractors

10.9%

4,505 contractor hours this quarter

Physical Therapy Assistant: 7 Speech Language Pathologist: 5 Clinical Nurse Specialist: 3 Occupational Therapy Assistant: 2 Qualified Social Worker: 1 Respiratory Therapy Technician: 1 Medical Director: 1 Occupational Therapy Aide: 1
Staff by category
Certified Nursing Assistant7107119,13591100%8.6
Licensed Practical Nurse200207,72391100%9.5
Registered Nurse130134,27691100%9.6
Other Dietary Services Staff8082,09791100%7.9
Physical Therapy Assistant0771,8127886%7.1
Clinical Nurse Specialist5381,7726774%8.1
Speech Language Pathologist0551,6757987%6.7
Dental Services Staff2025706470%8.2
Administrator1015206571%8
Dietitian1015126470%8
Respiratory Therapy Technician0114687380%6.4
Nurse Practitioner1014565763%8
Qualified Social Worker0112142629%8.2
Occupational Therapy Aide0111222224%5.5
Occupational Therapy Assistant022715358%1.3
Medical Director011543437%1.6
71 Certified Nursing Assistant
% of Days 100%
20 Licensed Practical Nurse
% of Days 100%
13 Registered Nurse
% of Days 100%
8 Other Dietary Services Staff
% of Days 100%
7 Physical Therapy Assistant
% of Days 86%
8 Clinical Nurse Specialist
% of Days 74%
5 Speech Language Pathologist
% of Days 87%
2 Dental Services Staff
% of Days 70%
1 Administrator
% of Days 71%
1 Dietitian
% of Days 70%
1 Respiratory Therapy Technician
% of Days 80%
1 Nurse Practitioner
% of Days 63%
1 Qualified Social Worker
% of Days 29%
1 Occupational Therapy Aide
% of Days 24%
2 Occupational Therapy Assistant
% of Days 58%
1 Medical Director
% of Days 37%

Facility Characteristics

Source: CMS Long-Term Care Facility Characteristics (Data as of Jan 2026)

Total residents 91
Medicare
37
40.7% of residents
Medicaid
38
41.8% of residents
Private pay or other
16
17.6% of residents
Programs & Services
Residents Group

Residents meet regularly to discuss policies, care quality, and activities

Active Resident Council

Organized group of residents that meets regularly to discuss facility policies, quality of life, and activities.

Quality of care over time

These measures show how residents usually do over time at this home, based on health outcomes and preventive care.

High-risk clinical events score Info A composite score based on pressure ulcers, falls with injury, weight loss, walking ability decline, and activities of daily living decline. 13.0
55% worse than Michigan average

Michigan average: 8.4

Functional decline score Info A composite score based on activities of daily living decline, walking ability decline, and incontinence. 22.4
37% worse than Michigan average

Michigan average: 16.3

Long-stay resident measures
Need for Help with Daily Activities Increased Info Percent of long-stay residents whose need for help with daily activities has increased 19.9%
60% worse than Michigan average

Michigan average: 12.5%

Walking Ability Worsened Info Percent of long-stay residents whose ability to move independently worsened 24.8%
62% worse than Michigan average

Michigan average: 15.3%

Low Risk Residents with Bowel/Bladder Incontinence Info Percent of low risk long-stay residents who lose control of their bowels or bladder 22.4%
7% worse than Michigan average

Michigan average: 21.0%

Falls with Major Injury Info Percent of long-stay residents experiencing one or more falls with major injury 3.6%
14% worse than Michigan average

Michigan average: 3.2%

High Risk Residents with Pressure Ulcers Info Percent of long-stay high risk residents with pressure ulcers 11.6%
102% worse than Michigan average

Michigan average: 5.7%

Urinary Tract Infection Info Percent of long-stay residents with a urinary tract infection 4.5%
165% worse than Michigan average

Michigan average: 1.7%

Lost Too Much Weight Info Percent of long-stay residents who lose too much weight 5.2%
8% better than Michigan average

Michigan average: 5.7%

Depressive Symptoms Info Percent of long-stay residents who have depressive symptoms 0.5%
88% better than Michigan average

Michigan average: 3.9%

Antipsychotic Use Info Percent of long-stay residents who received an antipsychotic medication 11.5%
23% better than Michigan average

Michigan average: 15.0%

Pneumococcal Vaccine Info Percent of long-stay residents assessed and appropriately given the pneumococcal vaccine 98.0%
In line with Michigan average

Michigan average: 94.9%

Influenza Vaccine Info Percent of long-stay residents assessed and appropriately given the seasonal influenza vaccine 94.7%
In line with Michigan average

Michigan average: 95.0%

Short-stay resident measures
Pneumococcal Vaccine Info Percent of short-stay residents assessed and appropriately given the pneumococcal vaccine 95.7%
16% better than Michigan average

Michigan average: 82.5%

Antipsychotic medication increase Info Percent of short-stay residents who newly received an antipsychotic medication 0.8%
45% better than Michigan average

Michigan average: 1.4%

Influenza Vaccine Info Percent of short-stay residents assessed and appropriately given the seasonal influenza vaccine 81.6%
In line with Michigan average

Michigan average: 79.5%

Penalties and fines

Federal penalties imposed by CMS for regulatory violations, including civil money penalties (fines) and denials of payment for new Medicare/Medicaid admissions.

Source: CMS Penalties Database

No penalties in the past 3 years

No civil money penalties or payment denials were reported in the last 3 years.

Compare Nursing Home around Midland The information below is reported by the Michigan Department of Licensing and Regulatory Affairs (LARA).

2 facilities compared · CMS & MI Dept. of Health data · Updated May 2026

Filter by care type
Brittany Manor
NH

Nursing Home Licensed facility providing 24/7 skilled nursing care for residents with complex, ongoing medical needs. Staffed by RNs, LPNs, and CNAs. Inspected and star-rated annually by CMS. Accepts Medicare (short-term rehab) and Medicaid (long-term care).

AL

Assisted Living A licensed, long-term care setting for seniors or individuals with disabilities who need help with daily activities — like bathing, dressing, and medication management — but not 24-hour skilled nursing. Offers housing, meals, and around-the-clock support while aiming to maximize resident independence.

IL

Independent Living Lifestyle-focused communities for older adults offering dining, activities, and transportation with minimal personal care. Best for active, independent seniors who want community without medical support.

MC

Memory Care Secured, specialized care for people living with Alzheimer's or dementia. Staff trained in cognitive impairment, with higher staff-to-resident ratios and an environment designed to reduce confusion and wandering risk.

Midland (East Ashman Street)150 54.8% -28%4.27 -9%-1%0202.9489A+ 13 Robinson, Shannon$21.9M$5.5M25.1%235245
Midland King’s Daughters Home -
NH

Nursing Home Licensed facility providing 24/7 skilled nursing care for residents with complex, ongoing medical needs. Staffed by RNs, LPNs, and CNAs. Inspected and star-rated annually by CMS. Accepts Medicare (short-term rehab) and Medicaid (long-term care).

AL

Assisted Living A licensed, long-term care setting for seniors or individuals with disabilities who need help with daily activities — like bathing, dressing, and medication management — but not 24-hour skilled nursing. Offers housing, meals, and around-the-clock support while aiming to maximize resident independence.

Midland30--------0----- 2 -----

Guides for Better Senior Living

Care Cost Calculator: See Prices in Your Area

Nursing Home Data Explorer

Don’t Wait Too Long: 7 Red Flag Signs Your Parent Needs Assisted Living Now

The True Cost of Assisted Living in 2025 – And How Families Are Paying For It

Understanding Senior Living Costs: Pricing Models, Discounts & Financial Assistance

Frequently Asked Questions about Brittany Manor

What neighborhood is Brittany Manor in?

Brittany Manor is in the East Ashman Street neighborhood of Midland.

Is Brittany Manor in a walkable area?

Brittany Manor has a walk score of 13. Car-dependent. Most errands require a car, with limited nearby walkable options.

Who is the administrator of Brittany Manor?

field_administrator is the administrator of Brittany Manor.

What is the address of Brittany Manor?

Brittany Manor is located at 3615 E Ashman St, Midland, MI 48642, United States.

What is the phone number of Brittany Manor?

(989) 631-0460 will put you in contact with the team at Brittany Manor.

Is Brittany Manor Medicare or Medicaid certified?

Yes — Brittany Manor is a CMS-certified provider of Medicare and Medicaid.

Explore Open Rooms
1 Contact details
2 What type of senior care service are you looking for?
3 What budget do you have in mind for senior care?
4 How soon do you need to find care?
5 Additional details

Thank you for your interest!

Our team will be in touch shortly to help with next steps.