Explore Open Rooms

1 Contact details
2 What type of senior care service are you looking for?
3 What budget do you have in mind for senior care?
4 How soon do you need to find care?
5 Additional details

Thank you for your interest!

Our team will be in touch shortly to help with next steps.

Assisted Living Home

Burcham Hills

Assisted Living Home

Burcham Hills

2700 Burcham Dr, East Lansing, MI 48823 View map
Overview of Burcham Hills

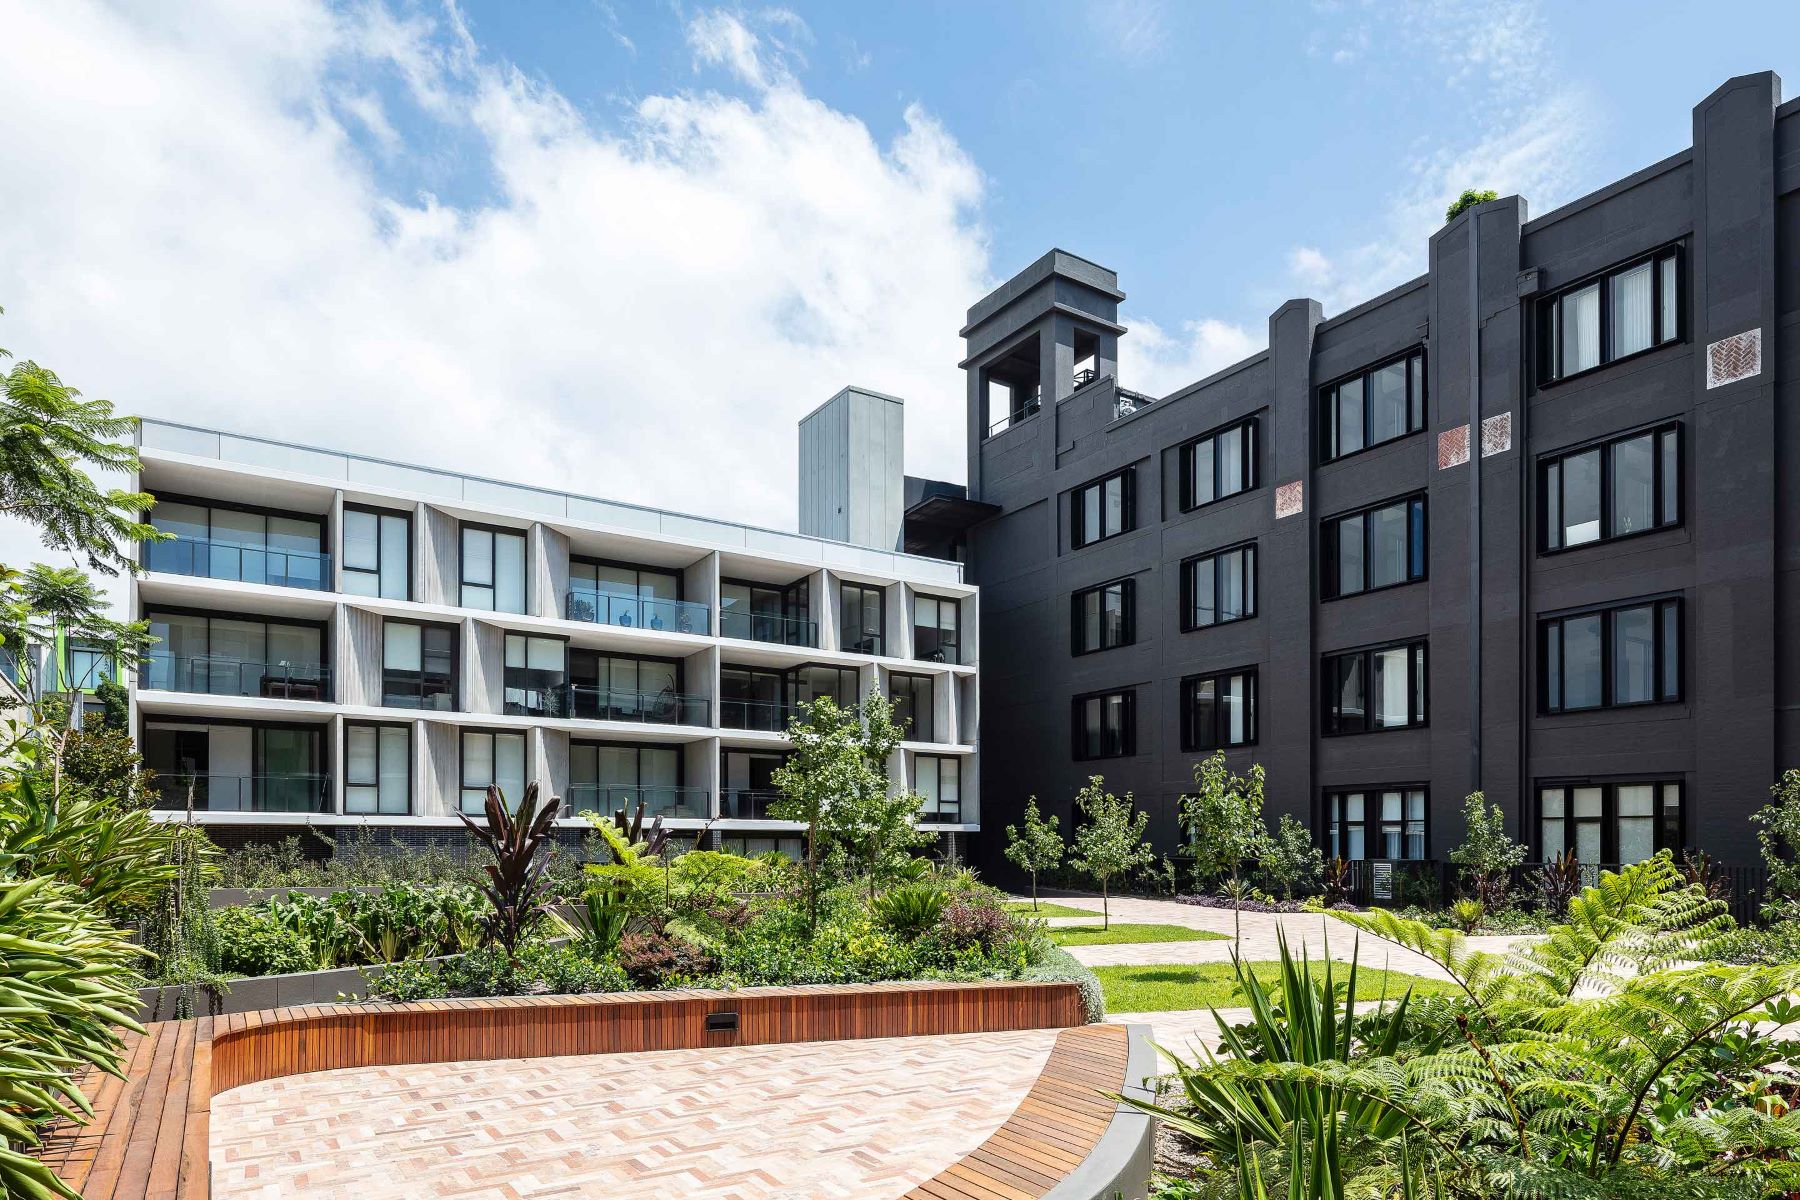
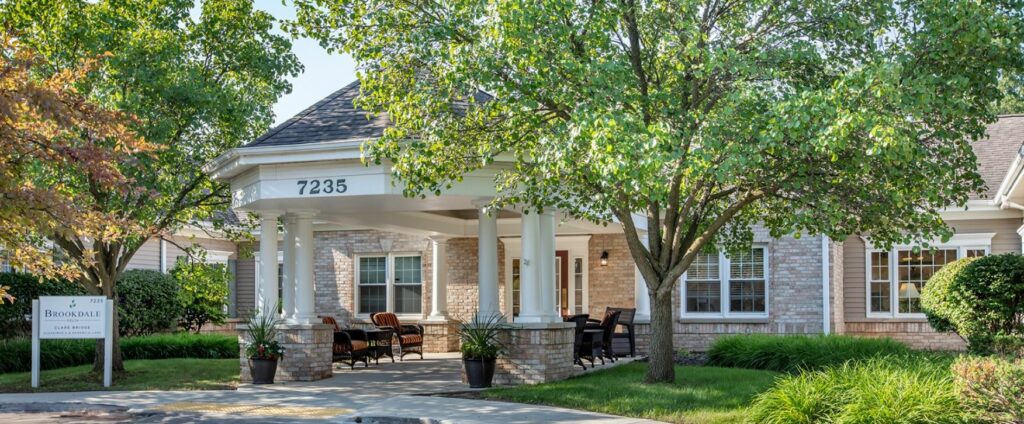
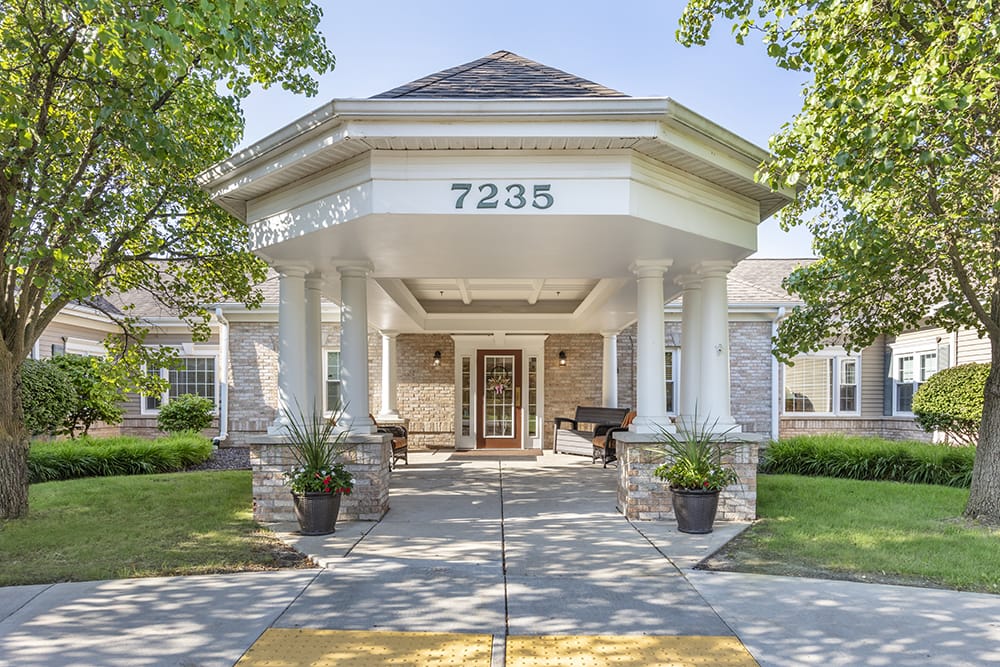
Burcham Hills seamlessly weaves together independent living, assisted living levels of care, memory care options, and nursing home care services. This remarkable community is designed to cater to a diverse range of needs, offering not only a nurturing environment but also health support, including long-term care and outpatient therapy. Situated amidst the vibrant heart of East Lansing, Michigan, Burcham Hills stands as a testament to the art of compassionate living.

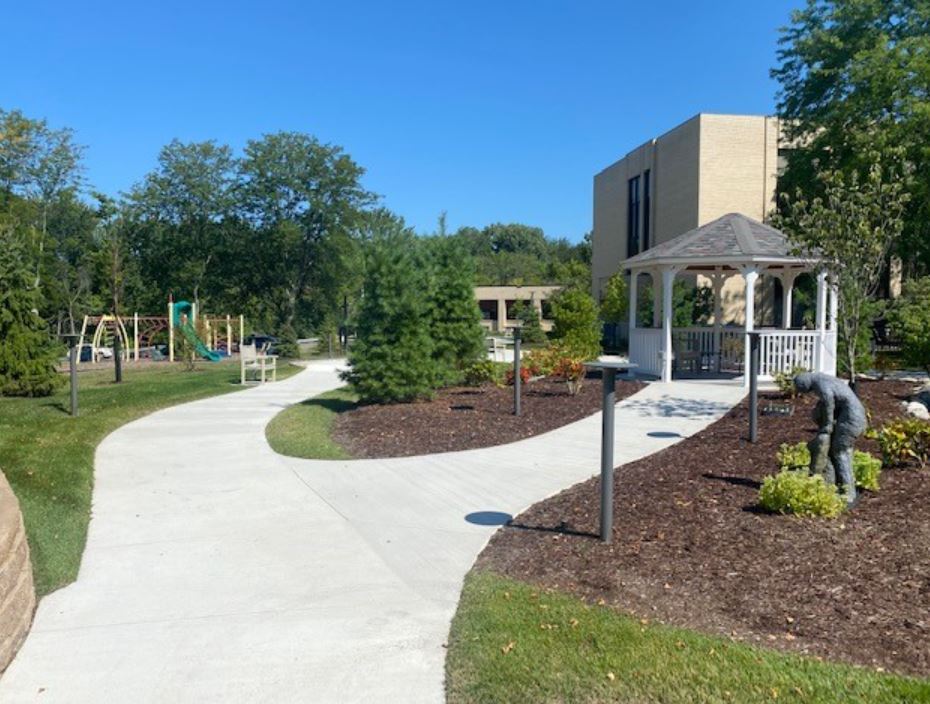
The facility houses a team of dedicated professionals, skilled in providing the highest quality of care. Beyond the expert assistance, residents are invited to immerse themselves in an array of enriching experiences. Stroll along peaceful walking paths, practice your swing on the putting green, or embrace the camaraderie during special outings. With wellness being a priority, residents have access to a wellness gym and inviting outdoor patios, encouraging an active and fulfilling lifestyle.

(517) 351-8377

Quality ratings

Measured by Centers for Medicare & Medicaid Services (CMS)

Overall rating Info The Overall CMS Rating combines results from health inspections, staffing levels and quality measures. Health inspections carry the most weight. Staffing and quality scores can increase or decrease the final rating based on performance compared to state and national standards.
1/5
Michigan average: 3.6/5
Health Inspection Info Based on the results of the facility's three most recent standard inspections and any complaint investigations. CMS reviews the number, scope, and severity of deficiencies, with more recent findings weighted more heavily.
1/5
Michigan average: 3.3/5
Staffing Info Measures average nursing staff hours per resident per day, including Registered Nurses (RNs) and total nursing staff. Ratings are adjusted based on the level of care residents require and are compared to state and national benchmarks.
4/5
Michigan average: 3.4/5
Quality Measures Info Based on clinical and physical health indicators reported to CMS, such as hospital readmissions, falls, pressure ulcers, and improvements in mobility. These measures reflect how well residents' health needs are being managed.
4/5
Michigan average: 3.8/5

Nursing care per resident

Info This shows how many total hours of nursing staff time are available per resident each day. Higher numbers usually mean more staff support.
4h 49m per day

This home provides 13% more nursing time per resident than the Michigan average.

Michigan average: 4h 15m per day

Capacity and availability

High-capacity home

May provide extensive amenities, services and programs.

Total beds 266

This home usually has availability

Lower occupancy suggests more openings may be available.

Lower demand than the Michigan average
Occupancy rate 51.9%
Residents per day (avg) 106
Occupancy rate
51.9%
Residents per day (avg)
106

Who this home usually serves

TYPE OF STAY

Primarily short stays

Residents typically stay for brief periods, with frequent admissions and discharges throughout the year.

Might be optimal for
Post-acute recovery Temporary care Transitional stays

Breakdown by payment type

Medicare

24% of new residents, usually for short-term rehab.

Typical stay 28 days

Private pay

74% of new residents, often for short stays.

Typical stay 4 - 5 months

Medicaid

2% of new residents, often for long-term daily care.

Typical stay 4 - 5 years

Finances and operations

Voluntary non-profit community
Home revenue
$34.0M
Surplus of revenue
$26.5K
Voluntary non-profit community
Home revenue
$34,046,908.00
Surplus of revenue
$26,479.00
Payroll costs Info The portion of the home's budget spent on staff, including nurses, caregivers, and other employees who support care and operations.
$12.7M
37.3% of revenue
Other operating costs Info All remaining costs needed to run the home, such as food, utilities, building maintenance, supplies and administrative expenses.
$21.3M
Total costs $34.0M
Bed community size
266-bed community
A large-scale community that may provide a wide range of amenities, services, and structured programs.
Years in operation
1 year in operation
A newer community that may feature more recent facilities and programs.
Walk Score
Walk Score: 11 / 100
Car-dependent. Most errands require a car, with limited nearby walkable options.

Population served

Aged; Alzheimers

About this community

Occupancy

Occupancy rate
52%
In line with Michigan average
Occupied beds
138 / 266
Average residents 84 per day

License details

Facility type
Homes For The Aged
Status Regular
Issuance January 8, 2025
Expiration July 31, 2026
County: INGHAM

Additional licensing details

License number: AH330236746

Ownership & operating entity

Burcham Hills is legally operated by Burcham Hills Retirement Center II.

Care Services

Nursing Services
Rehabilitation Services
Respite Care
Memory Care
Independent Living
Skilled Nursing
Licensed Nurses/CNAs
24-Hour Staffing
Short-Term Rehab

All Levels of Care

Independent Living
Assisted Living
Memory Care
Long Term Care
Short Term Rehab

Programs & Activities

Specific Programs
Independent Living, Assisted Living, Memory Care, Respite Care, Long Term Care, Outpatient Therapy & Rehab
Operating Hours
Monday-Sunday: 00:00-24:00

What does this home offer?

Pets allowed icon
Pets allowed icon

Pets Allowed: Yes, Pets Allowed

Housing options icon

Housing Options: 1 Bed / 2 Bed

Building type icon
Building type icon

Building Type: High-rise

Transportation services icon

Transportation Services

Fitness and recreation icon

Fitness and Recreation

Types of Care at Burcham Hills

Independent Living Assisted Living

Inspection History

In Michigan, the Department of Licensing and Regulatory Affairs (LARA) conducts unannounced inspections and investigations to ensure long-term care facilities comply with state health codes.

7 visits/inspections

Michigan average: 5 visits/inspections

Health Inspection History

Inspections
Total health inspections 10

Michigan average 6.5


Last Health inspection on May 2025

Total health citations 49

Michigan average 33.5

Citations per inspection
4.9

Michigan average 5.18


Health citations are formal notices following inspections when they fail to comply with safety and care standards.

22 of 49 citations resulted from standard inspections; 15 of 49 resulted from complaint investigations; and 12 of 49 came from combined inspections (standard and complaint).

Breakdown of citation severity (last 3 years)
Critical Health citations More info 0
100% better than Michigan average

Michigan average: 0.3


Serious Health citations More info 6
216% worse than Michigan average

Michigan average: 1.9

0 critical citations More info Michigan average: 0.3

6 serious citations More info Michigan average: 1.9

43 moderate citations More info Michigan average: 30.8

0 minor citations More info Michigan average: 0.5
Citations history (last 3 years)
Abuse/Neglect moderate citation Info Issues related to protecting resident's from harm, including abuse, neglect, or mistreatment. May 15, 2025
Corrected

Infection Control moderate citation Info Issues related to preventing and controlling infections, including hygiene practices and safety protocols. May 15, 2025
Corrected

Nursing Services moderate citation Info Issues related to the availability and quality of nursing staff and the care they provide. May 15, 2025
Corrected

Nutrition moderate citation Info Issues related to food quality, meal service, and resident's nutritional needs. May 15, 2025
Corrected

Compare Assisted Living around Ingham County The information below is reported by the Michigan Department of Licensing and Regulatory Affairs (LARA).

Burcham Hills
AL

Assisted Living A licensed, long-term care setting for seniors or individuals with disabilities who need help with daily activities — like bathing, dressing, and medication management — but not 24-hour skilled nursing. Offers housing, meals, and around-the-clock support while aiming to maximize resident independence.

IL

Independent Living Lifestyle-focused communities for older adults offering dining, activities, and transportation with minimal personal care. Best for active, independent seniors who want community without medical support.

MC

Memory Care Secured, specialized care for people living with Alzheimer's or dementia. Staff trained in cognitive impairment, with higher staff-to-resident ratios and an environment designed to reduce confusion and wandering risk.

NH

Nursing Home Licensed facility providing 24/7 skilled nursing care for residents with complex, ongoing medical needs. Staffed by RNs, LPNs, and CNAs. Inspected and star-rated annually by CMS. Accepts Medicare (short-term rehab) and Medicaid (long-term care).

East Lansing
426
-
11
1 Bed / 2 Bed
1
7
-
Burcham Hills Retirement Center II
Brookdale Delta
AL

Assisted Living A licensed, long-term care setting for seniors or individuals with disabilities who need help with daily activities — like bathing, dressing, and medication management — but not 24-hour skilled nursing. Offers housing, meals, and around-the-clock support while aiming to maximize resident independence.

Lansing
20
A+
28
1 Bed / 2 Bed
48
5
22
Brookdale Senior Living Communities, Inc.
Gracious AFC
AL

Assisted Living A licensed, long-term care setting for seniors or individuals with disabilities who need help with daily activities — like bathing, dressing, and medication management — but not 24-hour skilled nursing. Offers housing, meals, and around-the-clock support while aiming to maximize resident independence.

Lansing (Downtown)
6
-
78
1 Bed / 2 Bed
-
3
1
Gracious Adult Foster Care Inc.
Brookdale Delta
MC

Memory Care Secured, specialized care for people living with Alzheimer's or dementia. Staff trained in cognitive impairment, with higher staff-to-resident ratios and an environment designed to reduce confusion and wandering risk.

Lansing
-
A+
30
1 Bed / 2 Bed
48
-
-
-
The Cortland Edgewood
AL

Assisted Living A licensed, long-term care setting for seniors or individuals with disabilities who need help with daily activities — like bathing, dressing, and medication management — but not 24-hour skilled nursing. Offers housing, meals, and around-the-clock support while aiming to maximize resident independence.

RC

Respite Care Short-term temporary care — days to weeks — to give family caregivers a break. Full care provided during the stay. Often used after hospitalization or to trial a facility before a permanent placement decision.

Lansing
-
-
19
1 Bed / 2 Bed
-
-
-
-

Places of interest near Burcham Hills

Address 6.4 miles from city center — 0.97 miles to nearest hospital (MSU Health Care Medicine Specialty Center | Internal Medicine)

Address 2700 Burcham Dr, East Lansing, MI 48823

Calculate Travel Distance to Burcham Hills

Add your location

Address

Staffing Data (Q2 2025)

This data corresponds to Q2 2025 and is based on CMS Payroll-Based Journal.

Total staff 377
Employees 132
Contractors 245
Staff to resident ratio 3.52:1
101% better than Michigan average

Michigan average ratio: 1.75:1

Avg staff/day 74
Average shift 8.1 hours
0% compared with Michigan average

Michigan average: 7.9 hours

Total staff hours (quarter) 54,703
Nursing staff breakdown
Registered Nurse

Manages medical care and health needs.

Total count 31
Average shift length Info Average shift length. Calculated as total hours divided by days worked and average staff per day. 11.4 hours

This role is partially covered by contractors.

Licensed Practical Nurse

Assists with medical care and medications.

Total count 99
Average shift length Info Average shift length. Calculated as total hours divided by days worked and average staff per day. 9.3 hours

This role is partially covered by contractors.

Certified Nursing Assistant

Helps with daily care and mobility.

Total count 189
Average shift length Info Average shift length. Calculated as total hours divided by days worked and average staff per day. 7.9 hours

This role is partially covered by contractors.

Contractor staffing

Total hours from contractors

27.9%

15,288 contractor hours this quarter

Certified Nursing Assistant: 122 Licensed Practical Nurse: 71 Registered Nurse: 16 Speech Language Pathologist: 9 Physical Therapy Aide: 7 Physical Therapy Assistant: 4 Qualified Social Worker: 4 Respiratory Therapy Technician: 4 Occupational Therapy Aide: 2 Therapeutic Recreation Specialist: 2 Medical Director: 1 Qualified Activities Professional: 1 Administrator: 1 Occupational Therapy Assistant: 1
Staff by category
Certified Nursing Assistant6712218922,52391100%7.9
Licensed Practical Nurse28719911,15391100%9.3
Registered Nurse1516315,98291100%11.4
Clinical Nurse Specialist110113,6838796%7.1
Speech Language Pathologist0991,7448998%6.4
Physical Therapy Aide0771,3437582%6.7
Mental Health Service Worker3031,3336470%7.3
Occupational Therapy Aide2241,1457077%7.1
Dietitian2029877886%8.1
Physical Therapy Assistant0447386976%6.5
Qualified Social Worker0446997178%6.7
Other Social Services Staff2025496369%7
Respiratory Therapy Technician0445448088%6
Therapeutic Recreation Specialist0225326369%5.1
Nurse Practitioner1015046369%8
Administrator0114245358%8
Qualified Activities Professional0113936167%6.4
RN Director of Nursing1013824752%8.1
Occupational Therapy Assistant0113433%11.3
Medical Director011152629%0.6
189 Certified Nursing Assistant
% of Days 100%
99 Licensed Practical Nurse
% of Days 100%
31 Registered Nurse
% of Days 100%
11 Clinical Nurse Specialist
% of Days 96%
9 Speech Language Pathologist
% of Days 98%
7 Physical Therapy Aide
% of Days 82%
3 Mental Health Service Worker
% of Days 70%
4 Occupational Therapy Aide
% of Days 77%
2 Dietitian
% of Days 86%
4 Physical Therapy Assistant
% of Days 76%
4 Qualified Social Worker
% of Days 78%
2 Other Social Services Staff
% of Days 69%
4 Respiratory Therapy Technician
% of Days 88%
2 Therapeutic Recreation Specialist
% of Days 69%
1 Nurse Practitioner
% of Days 69%
1 Administrator
% of Days 58%
1 Qualified Activities Professional
% of Days 67%
1 RN Director of Nursing
% of Days 52%
1 Occupational Therapy Assistant
% of Days 3%
1 Medical Director
% of Days 29%

Facility Characteristics

Source: CMS Long-Term Care Facility Characteristics (Data as of Jan 2026)

Total census
107 residents
Residents by payment source
Medicare
11 residents (10.3%)
Medicaid
54 residents (50.5%)
Private pay or other
42 residents (39.3%)
Programs & Services
Residents' Group

Residents meet regularly to discuss policies, care quality, and activities

CCRC

Part of a Continuing Care Retirement Community offering multiple care levels

Active Resident Council

Organized group of residents that meets regularly to discuss facility policies, quality of life, and activities.

Quality of care over time

These measures show how residents usually do over time at this home, based on health outcomes and preventive care.

High-risk clinical events score Info A composite score based on pressure ulcers, falls with injury, weight loss, walking ability decline, and activities of daily living decline. 9.8
17% worse than Michigan average

Michigan average: 8.4

Functional decline score Info A composite score based on activities of daily living decline, walking ability decline, and incontinence. 16.9
In line with Michigan average

Michigan average: 16.3

Long-stay resident measures
Need for Help with Daily Activities Increased Info Percent of long-stay residents whose need for help with daily activities has increased 13.2%
6% worse than Michigan average

Michigan average: 12.5%

Walking Ability Worsened Info Percent of long-stay residents whose ability to move independently worsened 12.5%
19% better than Michigan average

Michigan average: 15.3%

Low Risk Residents with Bowel/Bladder Incontinence Info Percent of low risk long-stay residents who lose control of their bowels or bladder 25.0%
19% worse than Michigan average

Michigan average: 21.0%

Falls with Major Injury Info Percent of long-stay residents experiencing one or more falls with major injury 1.1%
65% better than Michigan average

Michigan average: 3.2%

High Risk Residents with Pressure Ulcers Info Percent of long-stay high risk residents with pressure ulcers 13.6%
137% worse than Michigan average

Michigan average: 5.7%

Urinary Tract Infection Info Percent of long-stay residents with a urinary tract infection 1.9%
11% worse than Michigan average

Michigan average: 1.7%

Lost Too Much Weight Info Percent of long-stay residents who lose too much weight 8.7%
53% worse than Michigan average

Michigan average: 5.7%

Depressive Symptoms Info Percent of long-stay residents who have depressive symptoms 1.2%
68% better than Michigan average

Michigan average: 3.9%

Antipsychotic Use Info Percent of long-stay residents who received an antipsychotic medication 16.4%
9% worse than Michigan average

Michigan average: 15.0%

Pneumococcal Vaccine Info Percent of long-stay residents assessed and appropriately given the pneumococcal vaccine 97.8%
In line with Michigan average

Michigan average: 94.9%

Influenza Vaccine Info Percent of long-stay residents assessed and appropriately given the seasonal influenza vaccine 85.7%
10% worse than Michigan average

Michigan average: 95.0%

Short-stay resident measures
Pneumococcal Vaccine Info Percent of short-stay residents assessed and appropriately given the pneumococcal vaccine 91.1%
10% better than Michigan average

Michigan average: 82.5%

Antipsychotic medication increase Info Percent of short-stay residents who newly received an antipsychotic medication 0.7%
52% better than Michigan average

Michigan average: 1.4%

Influenza Vaccine Info Percent of short-stay residents assessed and appropriately given the seasonal influenza vaccine 84.6%
6% better than Michigan average

Michigan average: 79.5%

Penalties and fines

Federal penalties imposed by CMS for regulatory violations, including civil money penalties (fines) and denials of payment for new Medicare/Medicaid admissions.

Source: CMS Penalties Database (Data as of Jan 2026)

Total fines amount $56K
26% lower than Michigan average

Michigan average: $76K

Number of fines 2
In line with Michigan average

Michigan average: 2.0

Payment Denials Info Serious action where Medicare and/or Medicaid temporarily stops payments for new residents until issues are fixed. 1
19% more payment denials than Michigan average

Michigan average: 0.8

Fines amount comparison
This facility $56K
Michigan average $76K
Penalty History

Penalties are imposed by CMS for violations of federal nursing home regulations.

Civil Money Penalty Info Fines imposed for noncompliance, which can be assessed per day or per instance of violation. Aug 8, 2024
$38K
Payment Denial Info Serious action where Medicare and/or Medicaid temporarily stops payments for new residents until issues are fixed. May 24, 2024
25 days
Civil Money Penalty Info Fines imposed for noncompliance, which can be assessed per day or per instance of violation. Mar 8, 2023
$19K

Last updated: Jan 2026

Guides for Better Senior Living

Care Cost Calculator: See Prices in Your Area

Nursing Home Data Explorer

Don’t Wait Too Long: 7 Red Flag Signs Your Parent Needs Assisted Living Now

The True Cost of Assisted Living in 2025 – And How Families Are Paying For It

Understanding Senior Living Costs: Pricing Models, Discounts & Financial Assistance

Financial Aid for Michigan Seniors

Get financial aid guidance

MI Choice Waiver

Michigan Medicaid MI Choice Waiver

Age 65+ or disabled, Michigan resident, Medicaid- eligible, nursing home-level care need.

~$2,829/month (300% FBR, individual).

$2,000 (individual), $3,000 (couple).

Delivered through regional waiver agents; waitlists possible.

Home Help Program

Michigan Home Help

Age 65+ or disabled, Michigan resident, Medicaid- eligible or low-income.

~$1,732/month (individual, Medicaid threshold).

$2,000 (individual).

Can hire family caregivers; less intensive than waiver.

Program of All-Inclusive Care for the Elderly (PACE)

Michigan PACE

Age 55+, Michigan resident, nursing home-level care need, safe with PACE support.

~$2,829/month (Medicaid-eligible); private pay option available.

$2,000 (individual), $3,000 (couple).

16 PACE centers (e.g., Ingham, Wayne counties); expanding slowly.

Medicare Savings Program (MSP)

Michigan Medicare Savings Program

Age 65+ or disabled, Michigan resident, Medicare Part A/B.

~$2,510/month (QMB), ~$3,380/month (SLMB), ~$3,598/month (QI)—individual.

$9,430 (individual), $14,130 (couple).

Three tiers; no waitlist; includes Extra Help for Part D.

National Family Caregiver Support Program (NFCSP) Respite

Michigan NFCSP Respite Care

Caregivers of 60+ needing care or 55+ caregivers of others; Michigan resident; functional needs (2+ ADLs).

Prioritizes ~$24,980/year (individual); no strict cap.

Not assessed; need-based.

16 AAAs; prioritizes low-income, rural caregivers.

Senior Community Service Employment Program (SCSEP)

Michigan SCSEP

Age 55+, unemployed, low-income, Michigan resident.

~$1,983/month (125% FPL).

Not specified; income-focused.

Priority for veterans, rural residents; Operation ABLE partnership.

VA Aid and Attendance (A&A) and Housebound Benefits

Michigan VA Aid and Attendance/Housebound

Age 65+ or disabled veteran/spouse, Michigan resident, wartime service, need for ADL help (A&A) or homebound.

Net income < ~$1,984/month (veteran with dependent, A&A); pension offsets income.

~$155,356 (net worth limit).

High veteran demand in urban/rural areas.

Tour Icon
Planning a tour? Check our touring checklist.
Chat Icon
Thinking of living here? We can help you speak to a current resident