Burcham Hills
Nursing Home, Independent Living & Assisted Living · Lansing, MI
CMS overall rating Info The Overall CMS Rating is scored from 1 to 5 stars and combines results from health inspections, staffing levels, and quality measures. Health inspections carry the most weight. Staffing and quality scores can increase or decrease the final rating based on performance compared to state and national standards.

Burcham Hills

Nursing Home, Independent Living & Assisted Living · Lansing, MI
CMS overall rating Info The Overall CMS Rating is scored from 1 to 5 stars and combines results from health inspections, staffing levels, and quality measures. Health inspections carry the most weight. Staffing and quality scores can increase or decrease the final rating based on performance compared to state and national standards.
Calculator: See prices in your area
Burcham Hills accepts Medicare, Medicaid, and private pay.

Overview of Burcham Hills

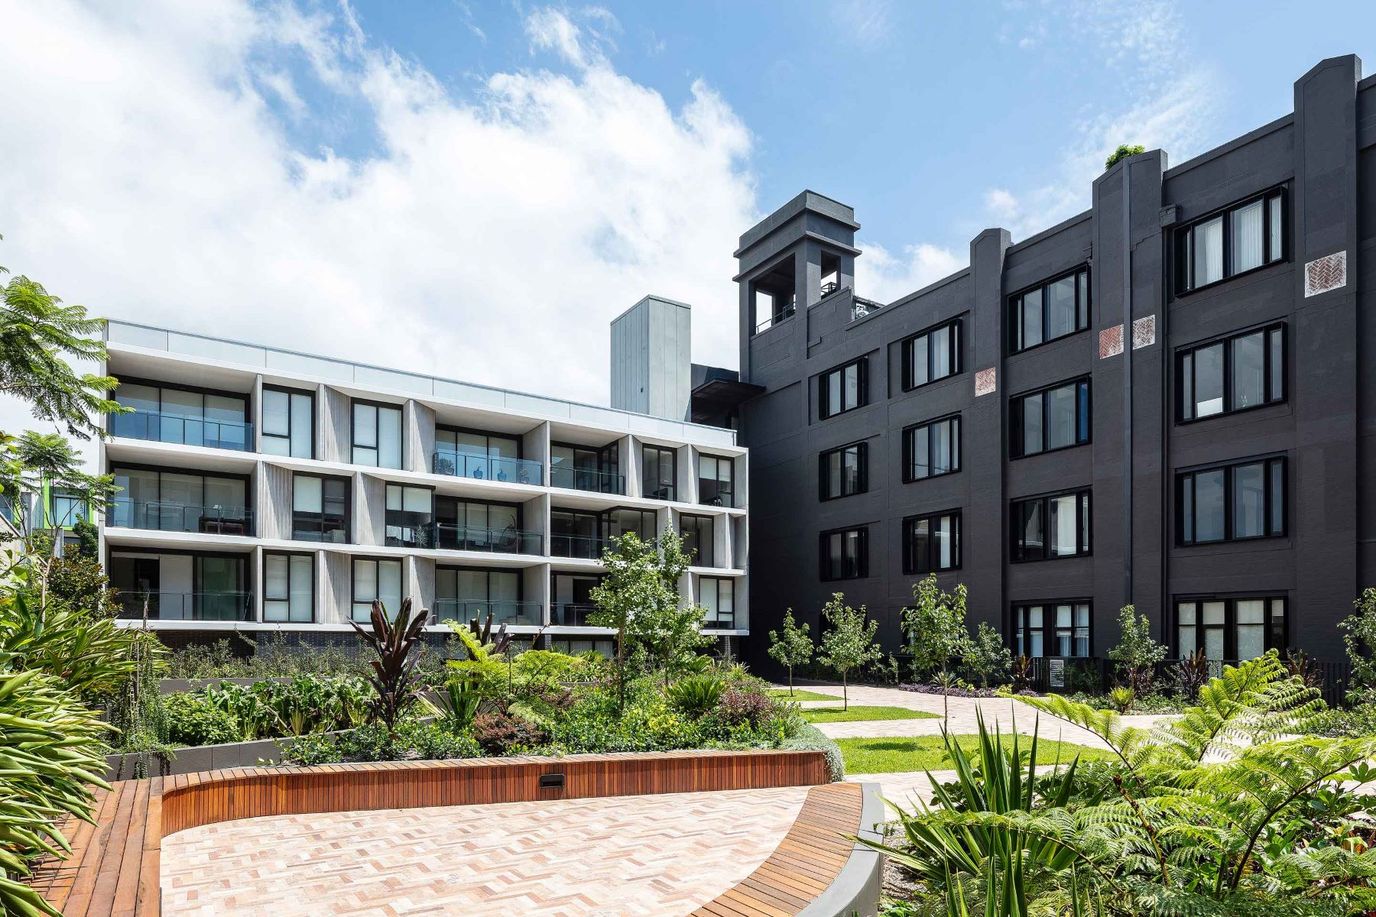
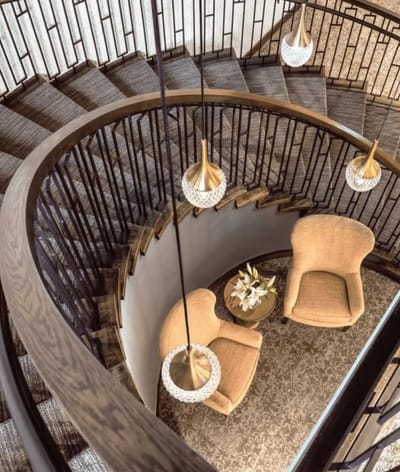
Burcham Hills seamlessly weaves together independent living, assisted living levels of care, memory care options, and nursing home care services. This remarkable community is designed to cater to a diverse range of needs, offering not only a nurturing environment but also health support, including long-term care and outpatient therapy. Situated amidst the vibrant heart of East Lansing, Michigan, Burcham Hills stands as a testament to the art of compassionate living.

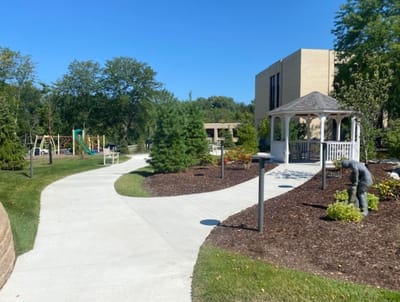
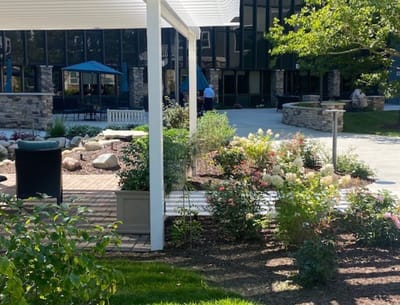
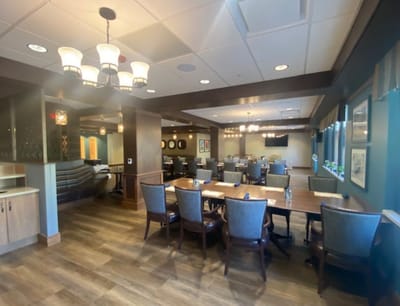
The facility houses a team of dedicated professionals, skilled in providing the highest quality of care. Beyond the expert assistance, residents are invited to immerse themselves in an array of enriching experiences. Stroll along peaceful walking paths, practice your swing on the putting green, or embrace the camaraderie during special outings. With wellness being a priority, residents have access to a wellness gym and inviting outdoor patios, encouraging an active and fulfilling lifestyle.

(517) 351-8377

Quality ratings

Measured by Centers for Medicare & Medicaid Services (CMS)

Overall rating Info The Overall CMS Rating combines results from health inspections, staffing levels and quality measures. Health inspections carry the most weight. Staffing and quality scores can increase or decrease the final rating based on performance compared to state and national standards.
▼ 71.8% Below MI avg. ▼ 71.8% Below MI avg.Click the badge to see the full State ranking.Click here to see the full State ranking.
Health Inspection Info Based on the results of the facility's three most recent standard inspections and any complaint investigations. CMS reviews the number, scope, and severity of deficiencies, with more recent findings weighted more heavily.
▼ 70.0% Below MI avg. ▼ 70.0% Below MI avg.Click the badge to see the full State ranking.Click here to see the full State ranking.
Staffing Info Measures average nursing staff hours per resident per day, including Registered Nurses (RNs) and total nursing staff. Ratings are adjusted based on the level of care residents require and are compared to state and national benchmarks.
▲ 19.0% Above MI avg. ▲ 19.0% Above MI avg.Click the badge to see the full State ranking.Click here to see the full State ranking.
Quality Measures Info Based on clinical and physical health indicators reported to CMS, such as hospital readmissions, falls, pressure ulcers, and improvements in mobility. These measures reflect how well residents' health needs are being managed.
▲ 5.0% Above MI avg. ▲ 5.0% Above MI avg.Click the badge to see the full State ranking.Click here to see the full State ranking.

Staffing hours breakdown

Info Daily nursing hours per resident by staff type, reported to CMS. Higher is generally better — compare this facility to state and national averages to see where staffing stands.

Hours per resident per day — compared to Michigan state averages

Total nursing care / resident Info This home is ranked 19th out of 103 homes in Michigan.

Total adjusted nursing hours per resident per day, combining RN, LPN, and aide time. CMS adjusts this for case-mix so facilities can be fairly compared.
4h 49m per day
Rank #19 / 103Nurse hours — State benchmarkedThis home is ranked 19th out of 103 homes in Michigan.Shows adjusted nurse hours per resident per day benchmarked to the Michigan average, with a ranking across 103 Michigan SNFs. More hours mean more direct care. The national average is about 3.5 hrs; below 3.0 is a red flag.Click the rank badge to see the full State ranking.Click here to see the full State ranking.
This facility Michigan avg (4h 15m per day)
vs Michigan avg
+13%
Staff typeHours / Day / Residentvs state avg
Total Nursing (Weekend) Info Combined nursing hours (RN + LPN + Nurse Aide) per resident per day on weekends. Staffing often drops on weekends — this figure reveals whether the facility maintains adequate coverage outside of weekday hours. 4h 7m per day

Capacity and availability

Avg. Length of Stay
53 days

Who this home usually serves

TYPE OF STAY

Primarily short stays

Residents typically stay for brief periods, with frequent admissions and discharges throughout the year.

Breakdown by payment type

Medicare

24% of new residents, usually for short-term rehab.

Typical stay 28 days

Private pay

74% of new residents, often for short stays.

Typical stay 4 - 5 months

Medicaid

2% of new residents, often for long-term daily care.

Typical stay 4 - 5 years

Finances and operations

Voluntary non-profit community
Home revenue
$34.0M
Surplus of revenue
$26.5K
Voluntary non-profit community
Home revenue
$34.0M Rank #10 / 104Revenue — State benchmarkedThis home is ranked 10th out of 104 homes in Michigan.Shows this facility's annual revenue compared to the Michigan SNF average. Higher revenue generally means more resources for staffing and capital — read alongside Payroll %.Click the rank badge to see the full State ranking.Click here to see the full State ranking.
Surplus of revenue
$26.5K
Payroll costs Info The portion of the home's budget spent on staff, including nurses, caregivers, and other employees who support care and operations. Rank #6 / 104Payroll — State benchmarkedThis home is ranked 6th out of 104 homes in Michigan.Shows total annual staff payroll benchmarked to the Michigan average. Higher payroll investment relative to peers often signals better staffing and less reliance on cheaper contract labor.Click the rank badge to see the full State ranking.Click here to see the full State ranking.
$17.2M
50.5% of revenue Rank #25 / 104Payroll % — State benchmarkedThis home is ranked 25th out of 104 homes in Michigan.Shows payroll as a percentage of revenue versus the Michigan average. Well-run Michigan SNFs typically land around 49–59% — the top third Statewide. Below 25% may signal understaffing or heavy agency use — read with Staffing ratings.Click the rank badge to see the full State ranking.Click here to see the full State ranking.
Other operating costs Info All remaining costs needed to run the home, such as food, utilities, building maintenance, supplies and administrative expenses.
$16.8M
Total costs $34.0M
Bed community size
266-bed community Rank #5 / 106Bed count — State benchmarkedThis home is ranked 5th out of 106 homes in Michigan.Shows this facility's certified or reported bed count compared to other Michigan SNFs. Larger communities may offer more amenities, programs, and on-site services for residents and families.Click the rank badge to see the full State ranking.Click here to see the full State ranking.
A large-scale community that may provide a wide range of amenities, services, and structured programs.
Years in operation
1 year in operation Rank #18 / 27Years in operation — State benchmarkedThis home is ranked 18th out of 27 homes in Michigan.Shows how long this facility has been in operation compared to other Michigan SNFs. Longer operating histories may benefit residents, families, and staff.Click the rank badge to see the full State ranking.Click here to see the full State ranking.
A newer community that may feature more recent facilities and programs.
Walk Score
Walk Score: 11 / 100 Rank #92 / 106Walk Score — State benchmarkedThis home is ranked 92nd out of 106 homes in Michigan.Shows how walkable this facility's neighborhood is compared to the average Walk Score across Michigan SNFs. Higher scores benefit residents, families, and staff.Click the rank badge to see the full State ranking.Click here to see the full State ranking.
Car-dependent. Most errands require a car, with limited nearby walkable options.

Population served

Aged; Alzheimers

About this community

Occupancy

Occupancy rate
52%
Rank #80 / 105Occupancy rate — State benchmarkedThis home is ranked 80th out of 105 homes in Michigan.Shows this facility's occupancy rate versus the Michigan average, with its Statewide rank out of 105. Higher occupancy signals strong local demand and financial stability.Click the rank badge to see the full State ranking.Click here to see the full State ranking.
Lower than the Michigan average: 75.8%
Occupied beds
138 / 266
Average residents per home in Michigan 84 per day

License Details

Facility TypeHomes For The Aged
StatusRegular
IssuanceJanuary 8, 2025
ExpirationJuly 31, 2026
CountyIngham
License NumberAH330236746

Ownership & Operating Entity

Burcham Hills is legally operated by Burcham Hills Retirement Center II.

Therapy & Rehabilitation

3 services
Rehabilitation Services
Respite Care
Short-Term Rehab

Staffing & Medical

1 service
24-Hour Staffing

Amenities & Lifestyle

Specific ProgramsOutpatient Therapy & Rehab
Operating HoursMonday-Sunday: 00:00-24:00

What does this home offer?

Pets allowed icon
Pets allowed icon

Pets Allowed

Housing options icon

Housing Options: 1 Bed / 2 Bed

Building type icon
Building type icon

Building Type: High-rise

Transportation services icon

Transportation Services

Fitness and recreation icon

Fitness and Recreation

Types of Care at Burcham Hills

Independent Living Assisted Living

Contact Burcham Hills

Inspection History

In Michigan, the Department of Licensing and Regulatory Affairs (LARA) conducts unannounced inspections and investigations to ensure long-term care facilities comply with state health codes.

Since 2013 · 13 years of data 7 inspections

Inspection Scorecard Info This scorecard compares key inspection, citation, and complaint metrics at this facility against the Michigan state average. Metrics rated ≥15% worse than average are highlighted in red; those ≥15% better are highlighted in green.

Since 2013 vs. Michigan state average

Inspections Info State inspections evaluate whether the facility meets health and safety standards.

MetricThis FacilityMI Averagevs. MI Avg
Total inspections Info Combined count of all routine and focused inspections. Excludes complaint investigations. 75 This facility has 40% more total inspections than a typical Michigan nursing home (7 vs. MI avg 5). Click this badge to view the full Michigan ranking.↑ 40% worse

Read the full inspection reports for this facility, including detailed findings and corrective actions.

Show Inspection Reports

Health Inspection History

Inspections Since 2023
Total health inspections 10

Michigan average 6.5


Last Health inspection on May 2025

Total health citations
49 Rank #86 / 105Health citations — State benchmarkedThis home is ranked 86th out of 105 homes in Michigan.Shows this facility's total health deficiency citations benchmarked to the Michigan State average, with a ranking across all 105 MI SNFs. Lower citation counts earn a better rank.Click the rank badge to see the full State ranking.Click here to see the full State ranking.

Michigan average 33.5

Citations per inspection
4.9 Rank #55 / 105Citations per inspection — State benchmarkedThis home is ranked 55th out of 105 homes in Michigan.Shows average deficiency citations per CMS inspection for this facility versus the Michigan mean across 105 SNFs with citation data. Lower is better.Click the rank badge to see the full State ranking.Click here to see the full State ranking.

Michigan average 5.18


Health citations are formal notices following inspections when they fail to comply with safety and care standards.

22 of 49 citations resulted from standard inspections; 15 of 49 resulted from complaint investigations; and 12 of 49 came from combined inspections (standard and complaint).

Breakdown of citation severity (last 3 years)
Critical Health citations
0
100% better than Michigan average

Michigan average: 0.3


Serious Health citations
6 Rank #61 / 65Serious citations (G–I) — State benchmarkedThis home is ranked 61st out of 65 homes in Michigan.Shows G–I scope serious health citations for this facility versus other Michigan SNFs. Lower counts rank better.Click the rank badge to see the full State ranking.Click here to see the full State ranking.
216% worse than Michigan average

Michigan average: 1.9

0 critical citations Michigan average: 0.3

6 serious citations Michigan average: 1.9

43 moderate citations Michigan average: 30.8

0 minor citations Michigan average: 0.5
Citations history (last 3 years)
Abuse/Neglect moderate citation May 15, 2025
Corrected

Infection Control moderate citation May 15, 2025
Corrected

Nursing Services moderate citation May 15, 2025
Corrected

Nutrition moderate citation May 15, 2025
Corrected

Financial Assistance for
Nursing Home in Michigan

Burcham Hills is located in East Lansing, Michigan.
Here are the financial assistance programs available to residents in Michigan.

Get Financial aid guidance

MI Choice Waiver

Michigan Medicaid MI Choice Waiver

Age 65+ or disabled
General Michigan resident, Medicaid- eligible, nursing home-level care need.
Income Limits (2025) ~$2,829/month 300% FBR, individual
Asset Limits $2,000 (individual), $3,000 (couple).
MI

Delivered through regional waiver agents; waitlists possible.

Benefits
Personal care (5-7 hours/day) Respite care (240 hours/year) Home modifications ($1,500 avg.) Adult day care ($65/day)

Home Help Program

Michigan Home Help

Age 65+ or disabled
General Michigan resident, Medicaid- eligible or low-income.
Income Limits ~$1,732/month individual, Medicaid threshold
Asset Limits $2,000 individual
MI

Can hire family caregivers; less intensive than waiver.

Benefits
Personal care (up to 60 hours/month) Homemaker services Respite (varies)

Program of All-Inclusive Care for the Elderly (PACE)

Michigan PACE

Age 55+
General Michigan resident, nursing home-level care need, safe with PACE support.
Income Limits (2025) ~$2,829/month (Medicaid-eligible); private pay option available.
Asset Limits $2,000 (individual), $3,000 (couple).
MI

16 PACE centers (e.g., Ingham, Wayne counties); expanding slowly.

Benefits
Personal care (5-7 hours/day) Medical care Meals Transportation Therapy Respite

Medicare Savings Program (MSP)

Michigan Medicare Savings Program

Age 65+ or disabled
General Michigan resident, Medicare Part A/B.
Income Limits (2025) ~$2,510/month (QMB), ~$3,380/month (SLMB), ~$3,598/month (QI)—individual.
Asset Limits $9,430 (individual), $14,130 (couple).
MI

Three tiers; no waitlist; includes Extra Help for Part D.

Benefits
Covers Part B premiums ($174.70/month) Deductibles ($240/year) Copays (~20%)

National Family Caregiver Support Program (NFCSP) Respite

Michigan NFCSP Respite Care

Age
General Caregivers of 60+ needing care or 55+ caregivers of others; Michigan resident; functional needs (2+ ADLs).
Income Limits (2025) Prioritizes ~$24,980/year (individual); no strict cap.
Asset Limits Not assessed; need-based.
MI

16 AAAs; prioritizes low-income, rural caregivers.

Benefits
Respite (4-6 hours/week or 5 days/year) Adult day care ($60/day) Caregiver training

VA Aid and Attendance (A&A) and Housebound Benefits

Michigan VA Aid and Attendance/Housebound

Age 65+ or disabled veteran/spouse
General Michigan resident, wartime service, need for ADL help (A&A) or homebound.
Income Limits (2025) Net income < ~$1,984/month (veteran with dependent, A&A); pension offsets income.
Asset Limits ~$155,356 net worth limit
MI

High veteran demand in urban/rural areas.

Benefits
Cash (~$1,433-$2,642/month veteran, ~$951-$1,318 spouse) for care costs

Places of interest near Burcham Hills

Address 6.4 miles from city center Info Estimated distance in miles from East Lansing's city center to Burcham Hills's address, calculated via Google Maps. — 0.97 miles to nearest hospital (MSU Health Care Medicine Specialty Center | Internal Medicine)

Calculate Travel Distance to Burcham Hills

Add your location

Address

Staffing Data

Reporting period: April 1 – June 30, 2025 (Q2 2025). Source: CMS Payroll-Based Journal report.

Total staff 377
Employees 132
Contractors 245
Staff to resident ratio 3.52:1
101% better than Michigan average
Michigan average ratio: 1.75:1 Michigan average ratio: 1.75:1See full Michigan ranking
Avg staff/day 74
Average shift 8.1 hours
0% compared with Michigan average
Michigan average: 7.9 hours Michigan average shift: 7.9 hoursSee full Michigan ranking
Total staff hours (quarter) 54,703

Nursing staff breakdown

Q2 2025 · Apr 1 – Jun 30 More info This data comes from the CMS Payroll-Based Journal report covering April 1 – June 30, 2025.
Registered Nurse

Manages medical care and health needs.

Total count 31
Average shift length Info Average shift length. Calculated as total hours divided by days worked and average staff per day. 11.4 hours

This role is partially covered by contractors.

Licensed Practical Nurse

Assists with medical care and medications.

Total count 99
Average shift length Info Average shift length. Calculated as total hours divided by days worked and average staff per day. 9.3 hours

This role is partially covered by contractors.

Certified Nursing Assistant

Helps with daily care and mobility.

Total count 189
Average shift length Info Average shift length. Calculated as total hours divided by days worked and average staff per day. 7.9 hours

This role is partially covered by contractors.

Contractor staffing

Q2 2025 · Apr 1 – Jun 30 More info This data comes from the CMS Payroll-Based Journal report covering April 1 – June 30, 2025.

Total hours from contractors

27.9%

15,288 contractor hours this quarter

Certified Nursing Assistant: 122 Licensed Practical Nurse: 71 Registered Nurse: 16 Speech Language Pathologist: 9 Physical Therapy Aide: 7 Physical Therapy Assistant: 4 Qualified Social Worker: 4 Respiratory Therapy Technician: 4 Occupational Therapy Aide: 2 Therapeutic Recreation Specialist: 2 Medical Director: 1 Qualified Activities Professional: 1 Administrator: 1 Occupational Therapy Assistant: 1

Staff by category

Q2 2025 · Apr 1 – Jun 30 More info This data comes from the CMS Payroll-Based Journal report covering April 1 – June 30, 2025.
Certified Nursing Assistant6712218922,52391100%7.9
Licensed Practical Nurse28719911,15391100%9.3
Registered Nurse1516315,98291100%11.4
Clinical Nurse Specialist110113,6838796%7.1
Speech Language Pathologist0991,7448998%6.4
Physical Therapy Aide0771,3437582%6.7
Mental Health Service Worker3031,3336470%7.3
Occupational Therapy Aide2241,1457077%7.1
Dietitian2029877886%8.1
Physical Therapy Assistant0447386976%6.5
Qualified Social Worker0446997178%6.7
Other Social Services Staff2025496369%7
Respiratory Therapy Technician0445448088%6
Therapeutic Recreation Specialist0225326369%5.1
Nurse Practitioner1015046369%8
Administrator0114245358%8
Qualified Activities Professional0113936167%6.4
RN Director of Nursing1013824752%8.1
Occupational Therapy Assistant0113433%11.3
Medical Director011152629%0.6
189 Certified Nursing Assistant
% of Days 100%
99 Licensed Practical Nurse
% of Days 100%
31 Registered Nurse
% of Days 100%
11 Clinical Nurse Specialist
% of Days 96%
9 Speech Language Pathologist
% of Days 98%
7 Physical Therapy Aide
% of Days 82%
3 Mental Health Service Worker
% of Days 70%
4 Occupational Therapy Aide
% of Days 77%
2 Dietitian
% of Days 86%
4 Physical Therapy Assistant
% of Days 76%
4 Qualified Social Worker
% of Days 78%
2 Other Social Services Staff
% of Days 69%
4 Respiratory Therapy Technician
% of Days 88%
2 Therapeutic Recreation Specialist
% of Days 69%
1 Nurse Practitioner
% of Days 69%
1 Administrator
% of Days 58%
1 Qualified Activities Professional
% of Days 67%
1 RN Director of Nursing
% of Days 52%
1 Occupational Therapy Assistant
% of Days 3%
1 Medical Director
% of Days 29%

Facility Characteristics

Source: CMS Long-Term Care Facility Characteristics (Data as of Jan 2026)

Total residents 107
Medicare
11
10.3% of residents
Medicaid
54
50.5% of residents
Private pay or other
42
39.3% of residents
Programs & Services
Residents Group

Residents meet regularly to discuss policies, care quality, and activities

CCRC

Part of a Continuing Care Retirement Community offering multiple care levels

Active Resident Council

Organized group of residents that meets regularly to discuss facility policies, quality of life, and activities.

Quality of care over time

These measures show how residents usually do over time at this home, based on health outcomes and preventive care.

High-risk clinical events score Info A composite score based on pressure ulcers, falls with injury, weight loss, walking ability decline, and activities of daily living decline. 9.8
17% worse than Michigan average

Michigan average: 8.4

Functional decline score Info A composite score based on activities of daily living decline, walking ability decline, and incontinence. 16.9
In line with Michigan average

Michigan average: 16.3

Long-stay resident measures
Need for Help with Daily Activities Increased Info Percent of long-stay residents whose need for help with daily activities has increased 13.2%
6% worse than Michigan average

Michigan average: 12.5%

Walking Ability Worsened Info Percent of long-stay residents whose ability to move independently worsened 12.5%
19% better than Michigan average

Michigan average: 15.3%

Low Risk Residents with Bowel/Bladder Incontinence Info Percent of low risk long-stay residents who lose control of their bowels or bladder 25.0%
19% worse than Michigan average

Michigan average: 21.0%

Falls with Major Injury Info Percent of long-stay residents experiencing one or more falls with major injury 1.1%
65% better than Michigan average

Michigan average: 3.2%

High Risk Residents with Pressure Ulcers Info Percent of long-stay high risk residents with pressure ulcers 13.6%
137% worse than Michigan average

Michigan average: 5.7%

Urinary Tract Infection Info Percent of long-stay residents with a urinary tract infection 1.9%
11% worse than Michigan average

Michigan average: 1.7%

Lost Too Much Weight Info Percent of long-stay residents who lose too much weight 8.7%
53% worse than Michigan average

Michigan average: 5.7%

Depressive Symptoms Info Percent of long-stay residents who have depressive symptoms 1.2%
68% better than Michigan average

Michigan average: 3.9%

Antipsychotic Use Info Percent of long-stay residents who received an antipsychotic medication 16.4%
9% worse than Michigan average

Michigan average: 15.0%

Pneumococcal Vaccine Info Percent of long-stay residents assessed and appropriately given the pneumococcal vaccine 97.8%
In line with Michigan average

Michigan average: 94.9%

Influenza Vaccine Info Percent of long-stay residents assessed and appropriately given the seasonal influenza vaccine 85.7%
10% worse than Michigan average

Michigan average: 95.0%

Short-stay resident measures
Pneumococcal Vaccine Info Percent of short-stay residents assessed and appropriately given the pneumococcal vaccine 91.1%
10% better than Michigan average

Michigan average: 82.5%

Antipsychotic medication increase Info Percent of short-stay residents who newly received an antipsychotic medication 0.7%
52% better than Michigan average

Michigan average: 1.4%

Influenza Vaccine Info Percent of short-stay residents assessed and appropriately given the seasonal influenza vaccine 84.6%
6% better than Michigan average

Michigan average: 79.5%

Penalties and fines

Federal penalties imposed by CMS for regulatory violations, including civil money penalties (fines) and denials of payment for new Medicare/Medicaid admissions.

Source: CMS Penalties Database (Data as of Jan 2026)

Total fines amount $56K Rank #82 / 106Federal fines — State benchmarkedThis home is ranked 82nd out of 106 homes in Michigan.Shows this facility's cumulative CMS federal fine dollars versus the Michigan average among facilities with fines, and where it ranks among 106 skilled nursing facilities in the pool. Lower total dollars mean a better rank.Click the rank badge to see the full State ranking.Click here to see the full State ranking.
26% lower than Michigan average

Michigan average: $76K

Number of fines 2
In line with Michigan average

Michigan average: 2.0

Payment Denials Info Serious action where Medicare and/or Medicaid temporarily stops payments for new residents until issues are fixed. 1
19% more payment denials than Michigan average

Michigan average: 0.8

Fines amount comparison
This facility $56K
Michigan average $76K
Penalty History

Penalties are imposed by CMS for violations of federal nursing home regulations.

2 penalties in the past 3 years

Multiple penalties were reported in the last 3 years.

Civil Money Penalty Info Fines imposed for noncompliance, which can be assessed per day or per instance of violation. Aug 8, 2024
$38K
Payment Denial Info Serious action where Medicare and/or Medicaid temporarily stops payments for new residents until issues are fixed. May 24, 2024
25 days

Last updated: Jan 2026

Guides for Better Senior Living

Care Cost Calculator: See Prices in Your Area

Nursing Home Data Explorer

Don’t Wait Too Long: 7 Red Flag Signs Your Parent Needs Assisted Living Now

The True Cost of Assisted Living in 2025 – And How Families Are Paying For It

Understanding Senior Living Costs: Pricing Models, Discounts & Financial Assistance

Frequently Asked Questions about Burcham Hills

What neighborhood is Burcham Hills in?

Burcham Hills is in the Burcham Drive neighborhood of East Lansing.

Who is the owner of Burcham Hills?

The legal owner and operator of Burcham Hills is Burcham Hills Retirement Center II.

Is Burcham Hills in a walkable area?

Burcham Hills has a walk score of 11. Car-dependent. Most errands require a car, with limited nearby walkable options.

What is the license number of Burcham Hills?

According to MI state health department records, Burcham Hills's license number is AH330236746.

When does Burcham Hills's license expire?

According to MI state health department records, Burcham Hills's license expires on July 31, 2026.

What is the occupancy rate at Burcham Hills?

Burcham Hills's occupancy is 52%.

How many beds does Burcham Hills have?

Burcham Hills has 266 beds.

Explore Open Rooms
1 Contact details
2 What type of senior care service are you looking for?
3 What budget do you have in mind for senior care?
4 How soon do you need to find care?
5 Additional details

Thank you for your interest!

Our team will be in touch shortly to help with next steps.