Total health inspections
3
Maryland average 3.9
Last Health inspection on Jan 2025

We arrange tours, appointments, and even moving support so you don’t have to
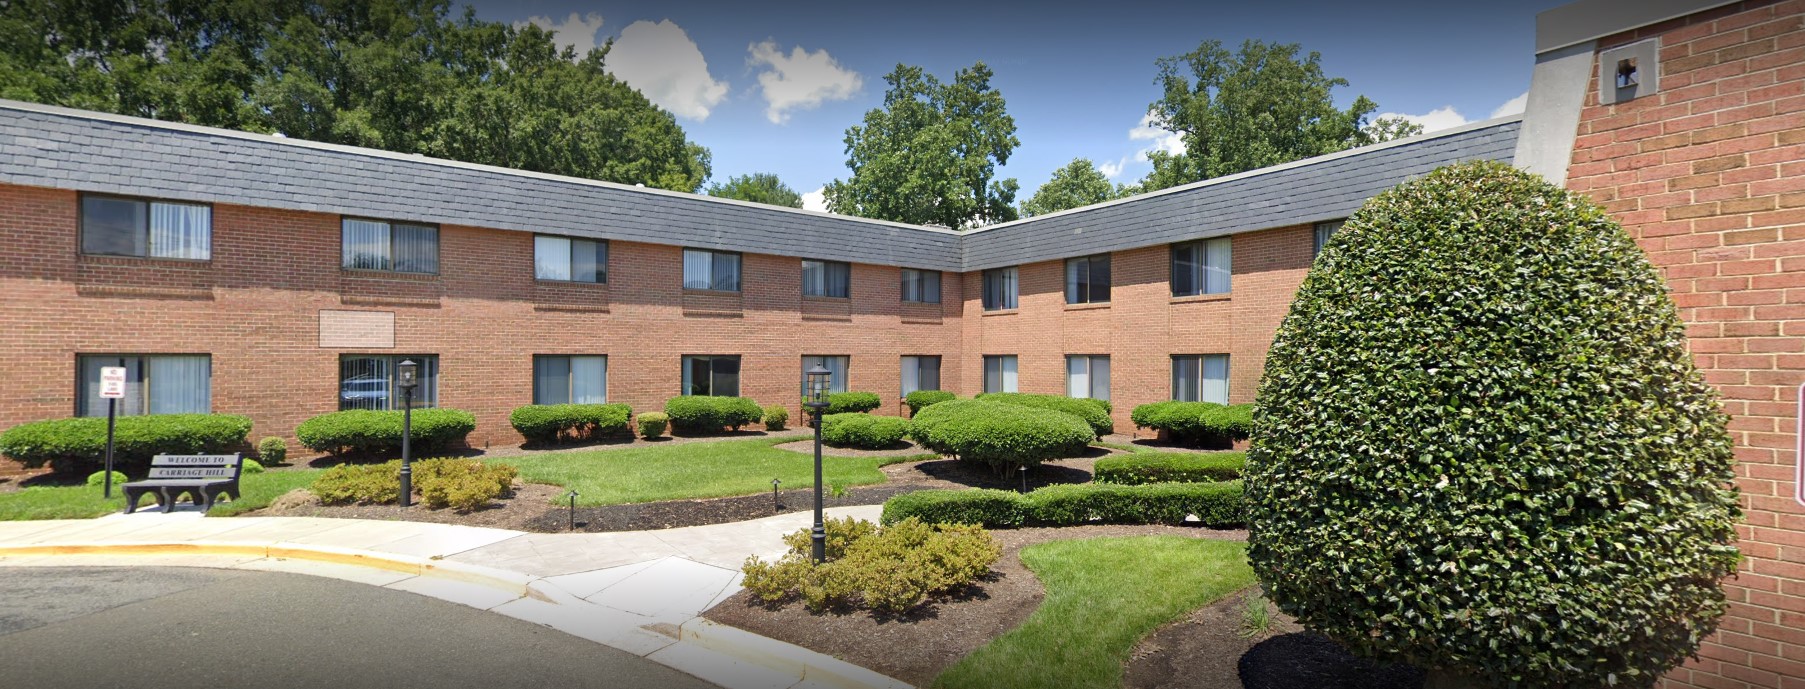
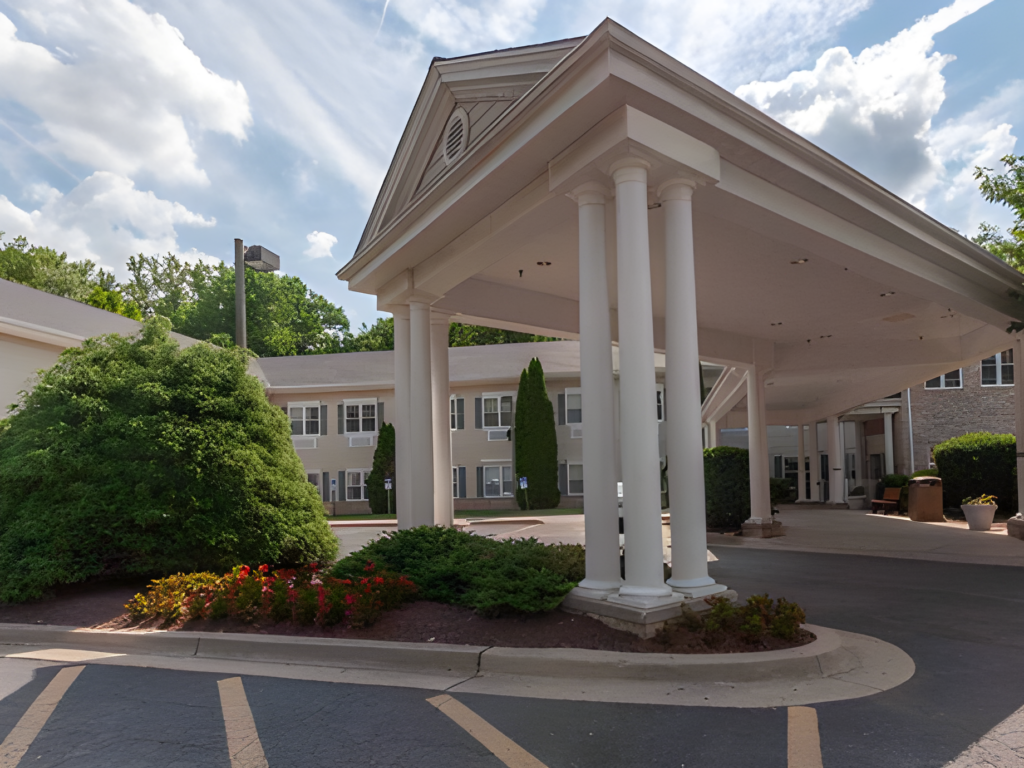
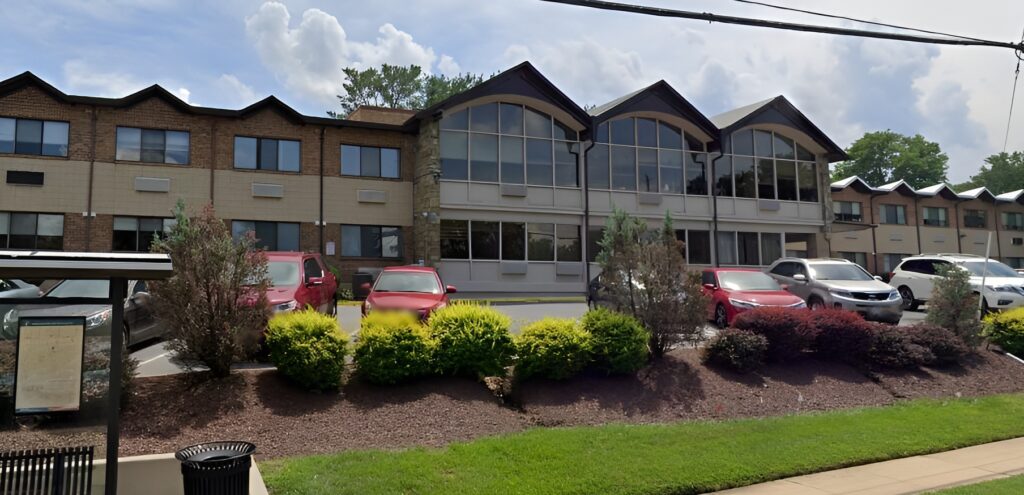
Carriage Hill of Bethesda is a distinguished senior living community in West Cedar Lane, Bethesda, MD, offering short-term rehabilitation, residential care, respite, and hospice care. With over 50 years of experience in delivering top-tier care and assistance, seniors can rest their worries and enjoy their life to the fullest. The community was also awarded the Best Nursing Home by the U.S. News for its top-notch quality in caring for seniors.
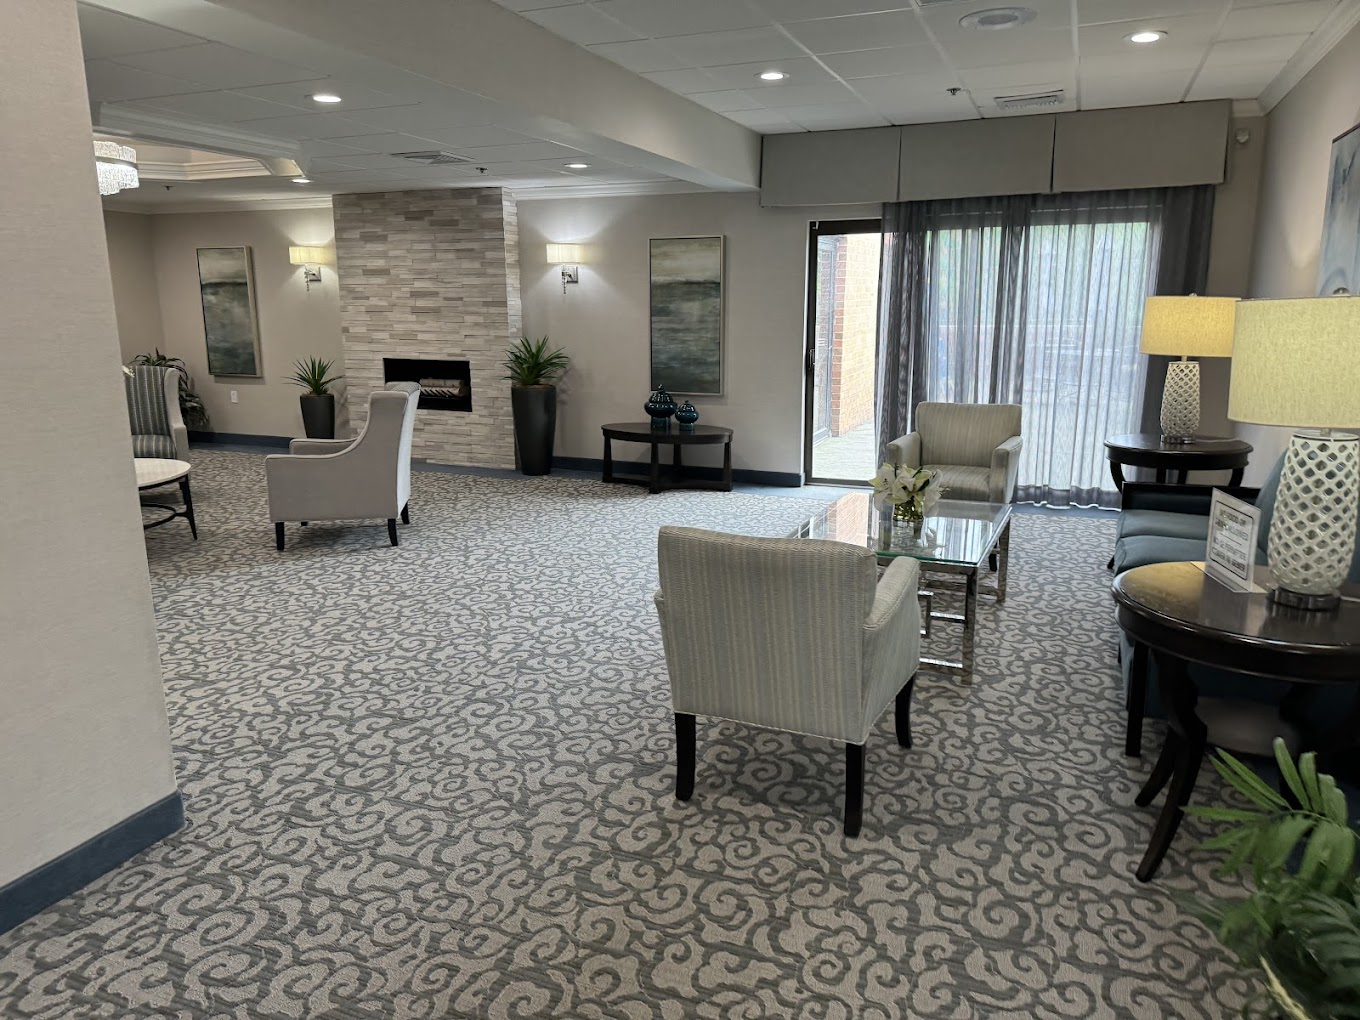
Featuring specially designed amenities and a team of compassionate and well-trained professionals, residents are encouraged to live an active and blissful retirement. While the end-of-life journey can be intimidating, the community works hard to provide proper support for seniors and their families to get through this difficult time. Carriage Hill of Bethesda is ideal for seniors looking for a place where they can find all their needs.
 Official CMS rating based on health inspections, staffing and quality measures.
Official CMS rating based on deficiencies found during state health inspections.
Official CMS rating based on nurse staffing hours per resident per day.
Official CMS rating based on clinical outcomes for residents.
Average daily nursing hours per resident (adjusted for acuity). Higher values indicate more nursing time per resident.
Hours of care per resident per day, broken down by staff type. Data from CMS Medicare.
Registered nurse hours per resident per day.
Nurse aide hours per resident per day.
Total number of nurse staff hours per resident per day on weekends.
Physical therapist staff hours per resident per day.
Registered nurse hours per resident per day on weekends.
Official CMS rating based on health inspections, staffing and quality measures.
Official CMS rating based on deficiencies found during state health inspections.
Official CMS rating based on nurse staffing hours per resident per day.
Official CMS rating based on clinical outcomes for residents.
Average daily nursing hours per resident (adjusted for acuity). Higher values indicate more nursing time per resident.
Hours of care per resident per day, broken down by staff type. Data from CMS Medicare.
Registered nurse hours per resident per day.
Nurse aide hours per resident per day.
Total number of nurse staff hours per resident per day on weekends.
Physical therapist staff hours per resident per day.
Registered nurse hours per resident per day on weekends.
Offers a balance of services and community atmosphere.
Lower occupancy suggests more openings may be available.
Most residents typically stay for a few weeks or months before returning home or moving on.
72% of new residents, usually for short-term rehab.
24% of new residents, often for short stays.
4% of new residents, often for long-term daily care.
The portion of the home's budget spent on staff, including nurses, caregivers, and other employees who support care and operations.
All remaining costs needed to run the home, such as food, utilities, building maintenance, supplies and administrative expenses.
Accept Medicaid: Yes
Total Residents: 108
Housing Options: Studio
Building Type: Two-story
Maryland average 3.9
Last Health inspection on Jan 2025
Health citations are formal notices following inspections when they fail to comply with safety and care standards.
28 of 33 citations resulted from standard inspections; 2 of 33 resulted from complaint investigations; and 3 of 33 came from combined inspections (standard and complaint).
Maryland average: 0.5
Maryland average: 0.6
Data sourced from CMS Health Deficiencies reports. Citation severity codes range from A (least serious) to L (most serious). Immediate Jeopardy (J-L) citations indicate situations where the facility's noncompliance has placed residents at risk of death or serious harm.
Hospice Care
Memory Care Specialized care for those with Memory Loss, Alzheimer's, or dementia, ensuring safety and support.
Nursing Homes 24/7 care needed
Assisted Living For seniors needing help with daily tasks but not full-time nursing.
Independent Living For self-sufficient seniors seeking community and minimal assistance.
Memory Care Specialized care for those with Memory Loss, Alzheimer's, or dementia, ensuring safety and support.
Nursing Homes 24/7 care needed
Nursing Home 24/7 care needed
Assisted Living For seniors needing help with daily tasks but not full-time nursing.
Nursing Home 24/7 care needed
Assisted Living For seniors needing help with daily tasks but not full-time nursing.
Hospice Care
Memory Care Specialized care for those with Memory Loss, Alzheimer's, or dementia, ensuring safety and support.
Nursing Homes 24/7 care needed
Respite Care
 Montcare Bethesda
 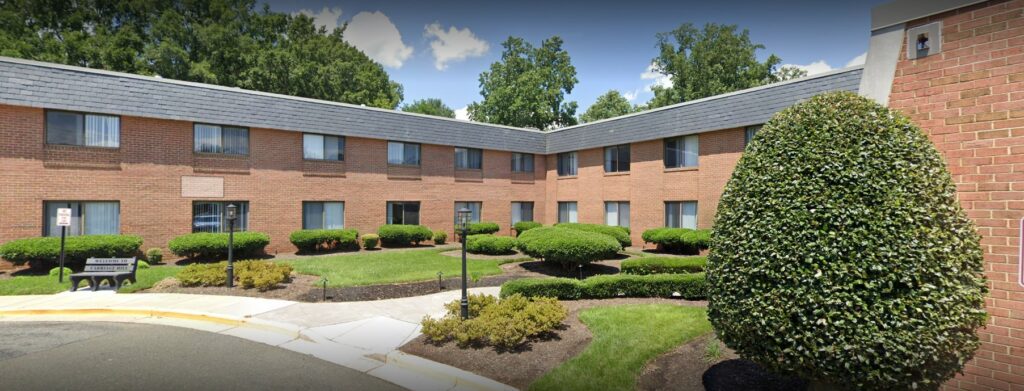 Carriage Hill of Bethesda
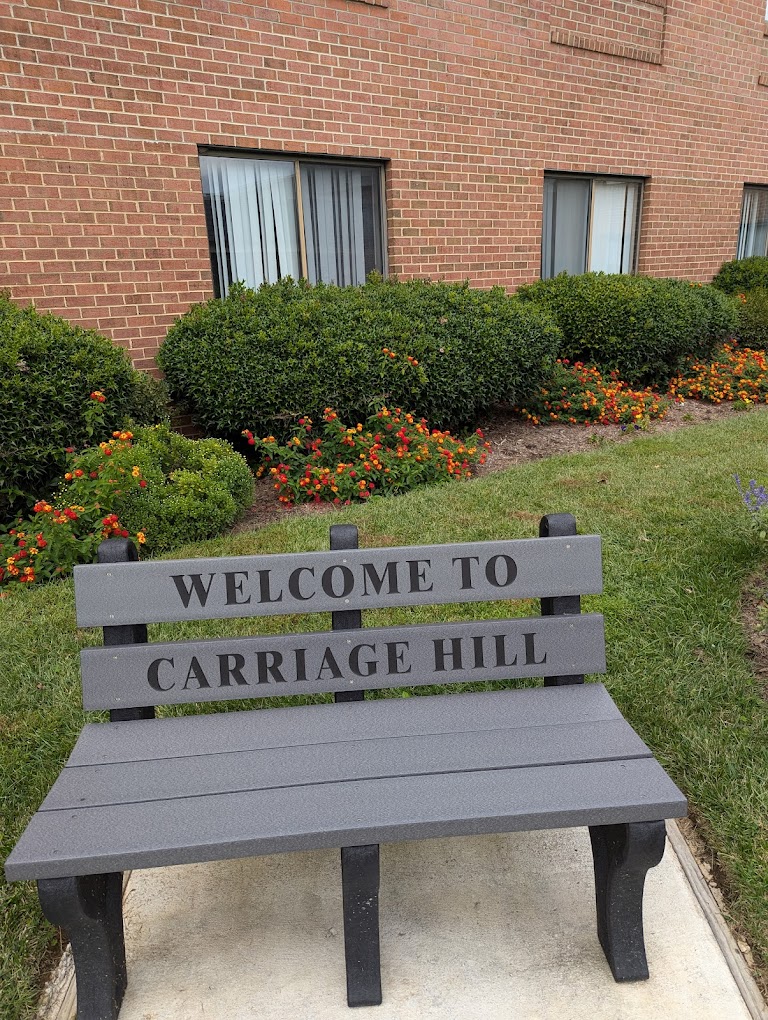
![]() 2.1 miles from city center
2.1 miles from city center
![]() 5215 W Cedar Ln, Bethesda, MD 20814
5215 W Cedar Ln, Bethesda, MD 20814
Add your location
Source: CMS Payroll-Based Journal (Q2 2025)
| Role ⓘ | Count ⓘ | Avg Shift (hrs) ⓘ | Uses Contractors? ⓘ |
|---|---|---|---|
| Registered Nurse | 13 | 8.4 | No |
| Licensed Practical Nurse | 32 | 8 | No |
| Certified Nursing Assistant | 49 | 7.4 | No |
| Role ⓘ | Employees ⓘ | Contractors ⓘ | Total Staff ⓘ | Total Hours ⓘ | Days Worked ⓘ | % of Days ⓘ | Avg Shift (hrs) ⓘ |
|---|---|---|---|---|---|---|---|
| Certified Nursing Assistant | 49 | 0 | 49 | 17,593 | 91 | 100% | 7.4 |
| Licensed Practical Nurse | 32 | 0 | 32 | 10,048 | 91 | 100% | 8 |
| Clinical Nurse Specialist | 11 | 0 | 11 | 3,771 | 76 | 84% | 7.7 |
| Registered Nurse | 13 | 0 | 13 | 3,064 | 91 | 100% | 8.4 |
| Respiratory Therapy Technician | 8 | 0 | 8 | 1,411 | 82 | 90% | 7.5 |
| Physical Therapy Aide | 3 | 0 | 3 | 1,101 | 68 | 75% | 7.6 |
| Physical Therapy Assistant | 7 | 0 | 7 | 1,018 | 75 | 82% | 6.8 |
| Mental Health Service Worker | 2 | 0 | 2 | 728 | 59 | 65% | 8 |
| Speech Language Pathologist | 3 | 0 | 3 | 690 | 72 | 79% | 7.1 |
| Nurse Practitioner | 1 | 0 | 1 | 512 | 64 | 70% | 8 |
| Qualified Social Worker | 4 | 0 | 4 | 505 | 70 | 77% | 4.6 |
| Dietitian | 1 | 0 | 1 | 496 | 62 | 68% | 8 |
| Other Dietary Services Staff | 1 | 0 | 1 | 482 | 65 | 71% | 7.4 |
| Administrator | 1 | 0 | 1 | 464 | 58 | 64% | 8 |
| Physical Therapist | 5 | 0 | 5 | 248 | 11 | 12% | 8 |
| Dental Services Staff | 2 | 0 | 2 | 226 | 28 | 31% | 7.1 |
| RN Director of Nursing | 5 | 0 | 5 | 47 | 3 | 3% | 7.9 |
Source: CMS Long-Term Care Facility Characteristics (Data as of Jan 2026)
Residents meet regularly to discuss policies, care quality, and activities
Organized group of residents that meets regularly to discuss facility policies, quality of life, and activities.
Data sourced from CMS Long-Term Care Facility Characteristics quarterly report. Payer mix reflects the current resident census by primary payment source.
These measures show how residents usually do over time at this home, based on health outcomes and preventive care.
Maryland average: 12.9
Maryland average: 25.7
Maryland average: 23.7%
Maryland average: 27.7%
Maryland average: 25.9%
Maryland average: 2.3%
Maryland average: 6.5%
Maryland average: 1.6%
Maryland average: 5.8%
Maryland average: 20.2%
Maryland average: 12.9%
Maryland average: 92.0%
Maryland average: 96.6%
Maryland average: 1.32
Maryland average: 1.21
Maryland average: 78.4%
Maryland average: 1.4%
Maryland average: 80.6%
Maryland average: 21.2%
Maryland average: 9.9%
Maryland average: 0.8%
Maryland average: 53.7%
Maryland average: 50.6%
Quality measures are calculated from Minimum Data Set (MDS) assessments. For most measures, lower percentages indicate better care quality.
Historical financial and operational data for Carriage Hill of Bethesda based on CMS SNF Cost Reports.
Loading trend charts...
Care Cost Calculator: See Prices in Your Area
Nursing Home Data Explorer
Don’t Wait Too Long: 7 Red Flag Signs Your Parent Needs Assisted Living Now
The True Cost of Assisted Living in 2025 – And How Families Are Paying For It
Understanding Senior Living Costs: Pricing Models, Discounts & Financial Assistance

Touring a community? Use this expert-backed checklist to stay organized, ask the right questions, and find the perfect fit.
We'll send you a PDF version of the touring checklist.