Montcare Bethesda
Nursing Home, Memory Care & Hospice Care · Montgomery County, MD
CMS overall rating Info The Overall CMS Rating is scored from 1 to 5 stars and combines results from health inspections, staffing levels, and quality measures. Health inspections carry the most weight. Staffing and quality scores can increase or decrease the final rating based on performance compared to state and national standards.

Montcare Bethesda

Nursing Home, Memory Care & Hospice Care · Montgomery County, MD
CMS overall rating Info The Overall CMS Rating is scored from 1 to 5 stars and combines results from health inspections, staffing levels, and quality measures. Health inspections carry the most weight. Staffing and quality scores can increase or decrease the final rating based on performance compared to state and national standards.
Calculator: See prices in your area
Montcare Bethesda accepts Medicare, Medicaid, and private pay.

Overview of Montcare Bethesda

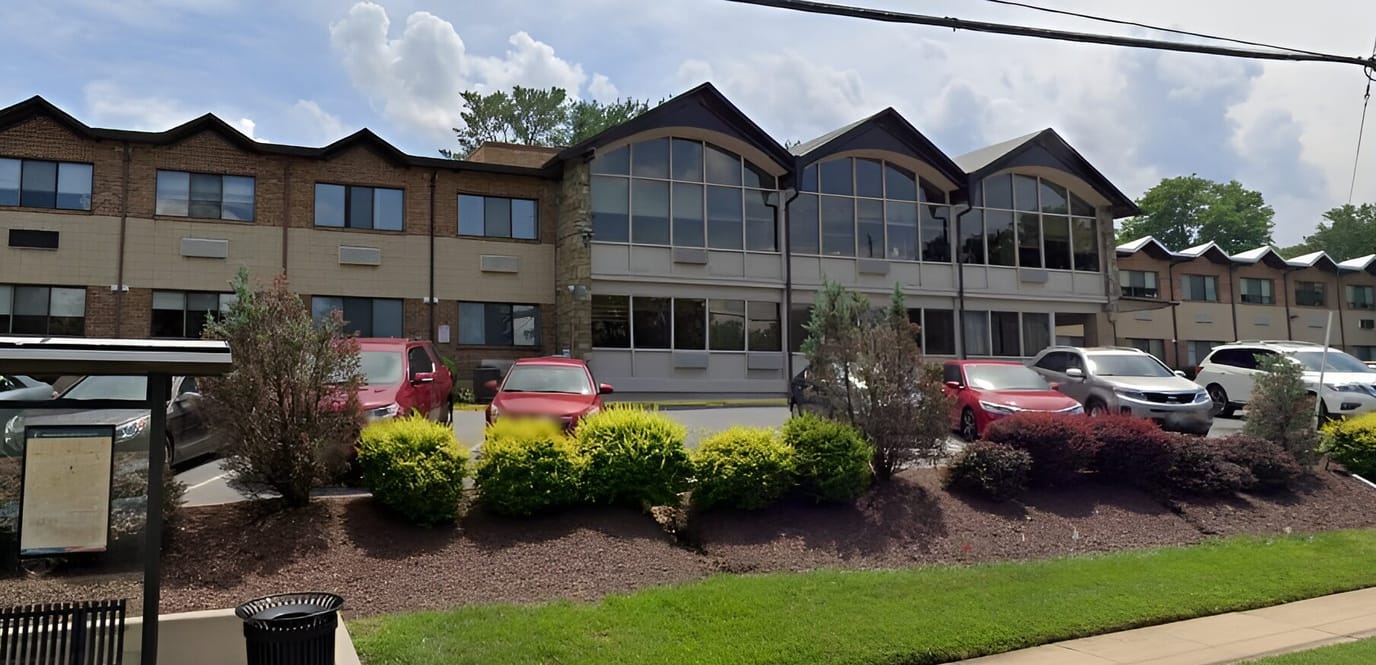
Ideally situated in the charming neighborhood of Democracy Boulevard, Bethesda, MD, Montcare Bethesda is a trusted community that offers nursing care. With comprehensive care services, including therapy services, short-term rehabilitation, palliative care, memory care, and hospice care, residents receive the care they need to live comfortably in their golden years. The community promotes a vibrant and nurturing environment, ensuring residents can easily adapt to their surroundings.

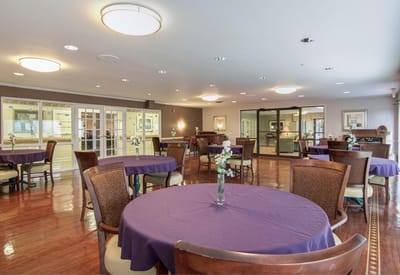
Aside from their healthcare needs, the community also strives to keep residents happy and well engaged through fun recreation and exciting outings. Anticipate a delightful dining experience with healthy and delightful meals that cater to dietary needs and preferences. The community is ideal for those looking to find all the care they need in one place, with its wide range of care services.

(301) 530-9000

Quality ratings

Measured by Centers for Medicare & Medicaid Services (CMS)

Overall rating Info The Overall CMS Rating combines results from health inspections, staffing levels and quality measures. Health inspections carry the most weight. Staffing and quality scores can increase or decrease the final rating based on performance compared to state and national standards.
▲ 31.5% Above MD avg.
Health Inspection Info Based on the results of the facility's three most recent standard inspections and any complaint investigations. CMS reviews the number, scope, and severity of deficiencies, with more recent findings weighted more heavily.
▲ 42.0% Above MD avg.
Staffing Info Measures average nursing staff hours per resident per day, including Registered Nurses (RNs) and total nursing staff. Ratings are adjusted based on the level of care residents require and are compared to state and national benchmarks.
At MD avg.
Quality Measures Info Based on clinical and physical health indicators reported to CMS, such as hospital readmissions, falls, pressure ulcers, and improvements in mobility. These measures reflect how well residents' health needs are being managed.
▲ 8.2% Above MD avg.

Staffing hours breakdown

Info Daily nursing hours per resident by staff type, reported to CMS. Higher is generally better — compare this facility to state and national averages to see where staffing stands.

Hours per resident per day — compared to Maryland state averages

Total nursing care / resident Info This home is ranked 99th out of 111 homes in Maryland.

Total adjusted nursing hours per resident per day, combining RN, LPN, and aide time. CMS adjusts this for case-mix so facilities can be fairly compared.
3h 3m per day
Rank #99 / 111Nurse hours — state benchmarkedThis home is ranked 99th out of 111 homes in Maryland.Shows adjusted nurse hours per resident per day benchmarked to the Maryland average, with a ranking across 111 Maryland SNFs. More hours mean more direct care. The national average is about 3.5 hrs; below 3.0 is a red flag.
This facility Maryland avg (3h 46m per day)
vs Maryland avg
-19%

5 of 6 metrics below state avg

Staff typeHours / dayvs state avg
Registered Nurse (RN) Info RNs hold the highest nursing license and can assess residents, interpret test results, and direct care plans. More RN hours per day often signals stronger clinical oversight and faster response to health changes. 50m per day ■ Avg State avg: 50m per day · National avg: 41m per day
LPN / LVN Info Licensed Practical Nurses (LPNs) or Licensed Vocational Nurses (LVNs) deliver routine hands-on care — medication administration, wound dressing, and monitoring vital signs. They work under RN supervision and make up a large share of daily bedside care. 45m per day ▼ 17% State avg: 54m per day · National avg: 52m per day
Nurse Aide Info Certified Nurse Aides (CNAs) provide the most direct day-to-day assistance: bathing, dressing, feeding, and mobility. Nurse aide hours are typically the largest staffing category and directly affect residents' quality of life. 1h 59m per day ▼ 8% State avg: 2h 10m per day · National avg: 2h 21m per day
Total Nursing (Weekend) Info Combined nursing hours (RN + LPN + Nurse Aide) per resident per day on weekends. Staffing often drops on weekends — this figure reveals whether the facility maintains adequate coverage outside of weekday hours. 3h 8m per day ▼ 10% State avg: 3h 29m per day · National avg: 3h 26m per day
Physical Therapist Info Hours per resident per day provided by licensed Physical Therapists (PTs) or PT Assistants. PT services help residents recover mobility after injury or illness and are especially important for post-acute (short-stay) rehabilitation. 4m per day ▼ 20% State avg: 5m per day · National avg: 4m per day
RN (Weekend) Info Registered nurse hours specifically on weekends. Facilities sometimes reduce RN presence on Saturdays and Sundays — a low weekend RN figure compared to weekday hours can indicate reduced clinical oversight when most administrative staff are absent. 33m per day ▼ 11% State avg: 37m per day · National avg: 29m per day

Capacity and availability

This home usually has availability

Occupancy lower than 85% suggests more openings may be available.

Higher occupancy than the Maryland average: 82.4%
Occupancy rate 84.7% Rank #54 / 113Occupancy rate — state benchmarkedThis home is ranked 54th out of 113 homes in Maryland.Shows this facility's occupancy rate versus the Maryland average, with its statewide rank out of 113. Higher occupancy signals strong local demand and financial stability.
Avg. Length of Stay 90 days
Occupancy rate
84.7% Rank #54 / 113Occupancy rate — state benchmarkedThis home is ranked 54th out of 113 homes in Maryland.Shows this facility's occupancy rate versus the Maryland average, with its statewide rank out of 113. Higher occupancy signals strong local demand and financial stability.
Avg. Length of Stay
90 days

Who this home usually serves

TYPE OF STAY

Mix of rehab and long-term care

This home supports both short-term rehab and long-term care, with residents staying for a wide range of durations.

Breakdown by payment type

Medicare

43% of new residents, usually for short-term rehab.

Typical stay 1 months

Private pay

49% of new residents, often for short stays.

Typical stay 1 months

Medicaid

9% of new residents, often for long-term daily care.

Typical stay 2 years

Finances and operations

Privately-owned community
Operated by a business corporation.
Home revenue
$5.1M
Profit
$25.0K
Privately-owned community Operated by a business corporation.
Home revenue
$5.1M Rank #108 / 113Revenue — state benchmarkedThis home is ranked 108th out of 113 homes in Maryland.Shows this facility's annual revenue compared to the Maryland SNF average. Higher revenue generally means more resources for staffing and capital — read alongside Payroll %.
Profit
$25.0K
Payroll costs Info The portion of the home's budget spent on staff, including nurses, caregivers, and other employees who support care and operations. Rank #84 / 113Payroll — state benchmarkedThis home is ranked 84th out of 113 homes in Maryland.Shows total annual staff payroll benchmarked to the Maryland average. Higher payroll investment relative to peers often signals better staffing and less reliance on cheaper contract labor.
$2.3M
45.6% of revenue Rank #55 / 113Payroll % — state benchmarkedThis home is ranked 55th out of 113 homes in Maryland.Shows payroll as a percentage of revenue versus the Maryland average. Well-run SNFs often land around 55–65%. Below 25% may signal understaffing or heavy agency use — read with Staffing ratings.
Other operating costs Info All remaining costs needed to run the home, such as food, utilities, building maintenance, supplies and administrative expenses.
$2.8M
Total costs $5.1M
Walk Score
Walk Score: 70 / 100 Rank #15 / 109Walk Score — state benchmarkedThis home is ranked 15th out of 109 homes in Maryland.Shows how walkable this facility's neighborhood is compared to the average Walk Score across Maryland SNFs. Higher scores benefit residents, families, and staff.
Very walkable. Most errands can be accomplished on foot, and many essentials are within a short walk.

About this community

Therapy & Rehabilitation

2 services
Rehabilitation Services
Short-Term Rehab

Additional Services

2 services
Long Term
Short Term

Amenities & Lifestyle

Specific ProgramsCovid-19 Updates

What does this home offer?

Housing options icon

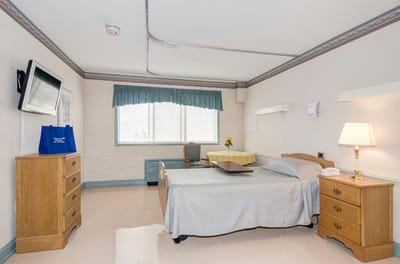
Housing Options: Private / Semi-Private Rooms

Building type icon
Building type icon

Building Type: 2-story

Dining services icon

Dining Services

Housekeeping icon
Housekeeping icon

Housekeeping Services

Recreational activities icon

Recreational Activities

Types of Care at Montcare Bethesda

Nursing Home Memory Care Hospice Care

Contact Montcare Bethesda

Health Inspection History

Inspections
Total health inspections 4

Maryland average 3.9


Last Health inspection on Oct 2025

Total health citations
34 Rank #40 / 113Health citations — state benchmarkedThis home is ranked 40th out of 113 homes in Maryland.Shows this facility's total health deficiency citations benchmarked to the Maryland state average, with a ranking across all 113 MD SNFs. Lower citation counts earn a better rank.

Maryland average 49.9

Citations per inspection
8.5 Rank #36 / 113Citations per inspection — state benchmarkedThis home is ranked 36th out of 113 homes in Maryland.Shows average deficiency citations per CMS inspection for this facility versus the Maryland mean across 113 SNFs with citation data. Lower is better.

Maryland average 12.81


Health citations are formal notices following inspections when they fail to comply with safety and care standards.

29 of 34 citations resulted from standard inspections; 4 of 34 resulted from complaint investigations; and 1 of 34 came from combined inspections (standard and complaint).

Breakdown of citation severity (last 8 years)
Critical Health citations More info
0
100% better than Maryland average

Maryland average: 0.5


Serious Health citations More info 0
100% better than Maryland average

Maryland average: 0.6

0 critical citations More info Maryland average: 0.5

0 serious citations More info Maryland average: 0.6

30 moderate citations More info Maryland average: 47.2

4 minor citations More info Maryland average: 1.7
Citations history (last 8 years)
Quality of Care moderate citation Info Issues related to how well residents receive appropriate treatment and support for their medical and daily care needs. Oct 10, 2025
Corrected

Quality of Care moderate citation Info Issues related to how well residents receive appropriate treatment and support for their medical and daily care needs. Oct 10, 2025
Corrected

Care Planning moderate citation Info Issues related to creating and updating personalized care plans for residents based on their needs and conditions. Oct 10, 2025
Corrected

Care Planning moderate citation Info Issues related to creating and updating personalized care plans for residents based on their needs and conditions. Oct 10, 2025
Corrected

Financial Assistance for
Nursing Home in Maryland

Montcare Bethesda is located in Bethesda, Maryland.
Here are the financial assistance programs available to residents in Maryland.

Get Financial aid guidance

Community Options Waiver

Maryland Medicaid Community Options Waiver

Age 65+ or disabled
General Maryland resident, Medicaid- eligible, nursing home-level care need.
Income Limits (2025) ~$2,829/month 300% FBR, individual
Asset Limits $2,000 (individual), $3,000 (couple) (excludes home, car).
MD

High urban demand; rural outreach efforts.

Benefits
Personal care (5-7 hours/day, e.g., bathing, dressing) Respite care (up to 240 hours/year) Adult day care ($70/day) Home modifications ($1,500 avg.)

Senior Care Program

Maryland Senior Care

Age 65+
General Maryland resident, at risk of nursing home placement.
Income Limits ~$2,000/month individual, varies by county
Asset Limits $11,000 individual
MD

Limited funding; waitlists common in high-demand areas.

Benefits
In-home care (3-5 hours/week) Respite care (up to 10 days/year) Meals (~$6/meal) Transportation (~5 trips/month) Case management

Maryland Nursing Home Medicaid

Maryland Medical Assistance (Medicaid) Nursing Home Program

Age 65+
General Maryland resident, Medicaid-eligible, requires nursing home-level care.
Income Limits (2025) $943/month (individual); most income applied to care costs.
Asset Limits $2,500 (individual), $3,000 (couple); spousal protections up to $155,356.
MD

Home equity limit $636,000; estate recovery applies post-55.

Benefits
24/7 nursing care Meals Therapy Medications (unlimited per medical need)

Senior Assisted Living Subsidy Program

Maryland Senior Assisted Living Group Home Subsidy

Age 62+
General Maryland resident, in or moving to approved assisted living, low/moderate income.
Income Limits (2025) ~$34,000/year individual, varies by county
Asset Limits Not strict; prioritizes low-income.
MD

Not available statewide; facility must be licensed by MDH.

Benefits
Personal care Meals 24-hour supervision (up to $1,500/month subsidy typical)

Veterans Aid and Attendance (A&A) Benefit

Maryland VA Aid and Attendance

Age
General Wartime veteran/spouse, age 65+ or disabled, needs ADL help, Maryland resident.
Income Limits (2025) Net income minus medical expenses < $1,984/month individual with A&A
Asset Limits $155,356 net worth limit
MD

High veteran population in suburban/rural areas.

Benefits
Cash benefit ($1,478-$2,471/month, varies by status) for care costs

Senior Prescription Drug Assistance Program (SPDAP)

Maryland Senior Prescription Drug Assistance Program

Age 65+
General Maryland resident (6+ months), Medicare Part D enrolled.
Income Limits (2025) $48,560/year individual, 300% FPL
Asset Limits None specified.
MD

Supplements Medicare Part D; annual enrollment required.

Benefits
Up to $40/month premium subsidy Reducing drug costs

Medicare Savings Programs (MSP)

Maryland Medicare Savings Programs

Age 65+
General Maryland resident, Medicare Part A/B enrollee.
Income Limits (2025) $2,014/month (QMB), $2,706/month (SLMB/QI, individual).
Asset Limits $9,090 (individual), $13,630 (couple).
MD

Includes QMB, SLMB, QI categories.

Benefits
Covers premiums (up to $174.70/month Part B) Co-pays Deductibles

Community Personal Assistance Services (CPAS)

Maryland Medicaid Community Personal Assistance Services

Age 65+
General Maryland resident, Medicaid-eligible, needs ADL assistance.
Income Limits (2025) $943/month (individual); spend-down available.
Asset Limits $2,500 (individual), $3,000 (couple).
MD

Consumer-directed option allows hiring family caregivers.

Benefits
Personal care (hours vary, typically 20-30/week) Chores Nurse supervision

Places of interest near Montcare Bethesda

Address 3.9 miles from city center Info Estimated distance in miles from Bethesda's city center to Montcare Bethesda's address, calculated via Google Maps.

Calculate Travel Distance to Montcare Bethesda

Add your location

Address

Staffing Data (Q2 2025)

This data corresponds to Q2 2025 and is based on CMS Payroll-Based Journal.

Total staff 131
Employees 96
Contractors 35
Staff to resident ratio 1.26:1
30% worse than Maryland average

Maryland average ratio: 1.81:1

Avg staff/day 54
Average shift 8.1 hours
0% compared with Maryland average

Maryland average: 8 hours

Total staff hours (quarter) 39,711

Nursing staff breakdown

Registered Nurse

Manages medical care and health needs.

Total count 15
Average shift length Info Average shift length. Calculated as total hours divided by days worked and average staff per day. 8.8 hours

No contractors work on this role.

Licensed Practical Nurse

Assists with medical care and medications.

Total count 18
Average shift length Info Average shift length. Calculated as total hours divided by days worked and average staff per day. 8.9 hours

No contractors work on this role.

Certified Nursing Assistant

Helps with daily care and mobility.

Total count 43
Average shift length Info Average shift length. Calculated as total hours divided by days worked and average staff per day. 8.2 hours

No contractors work on this role.

Contractor staffing

Total hours from contractors

7.9%

3,147 contractor hours this quarter

Respiratory Therapy Technician: 11 Physical Therapy Assistant: 8 Physical Therapy Aide: 5 Speech Language Pathologist: 5 Qualified Social Worker: 4 Medical Director: 1 Occupational Therapy Assistant: 1

Staff by category

Certified Nursing Assistant4304318,15391100%8.2
Licensed Practical Nurse180186,02291100%8.9
Registered Nurse150155,56891100%8.8
Clinical Nurse Specialist7072,9338593%8.1
Dental Services Staff2029556571%7.9
Physical Therapy Aide0558407077%6.8
Speech Language Pathologist0557818189%7.3
Other Dietary Services Staff6067297987%7.2
RN Director of Nursing1015937582%7.9
Physical Therapy Assistant0885347785%6.3
Administrator1014966268%8
Dietitian1014886167%8
Qualified Social Worker0444406673%6.7
Respiratory Therapy Technician011114337785%5.4
Nurse Practitioner1013844954%7.8
Occupational Therapy Aide1012445763%4.3
Occupational Therapy Assistant011681011%6.8
Medical Director011521314%4
43 Certified Nursing Assistant
% of Days 100%
18 Licensed Practical Nurse
% of Days 100%
15 Registered Nurse
% of Days 100%
7 Clinical Nurse Specialist
% of Days 93%
2 Dental Services Staff
% of Days 71%
5 Physical Therapy Aide
% of Days 77%
5 Speech Language Pathologist
% of Days 89%
6 Other Dietary Services Staff
% of Days 87%
1 RN Director of Nursing
% of Days 82%
8 Physical Therapy Assistant
% of Days 85%
1 Administrator
% of Days 68%
1 Dietitian
% of Days 67%
4 Qualified Social Worker
% of Days 73%
11 Respiratory Therapy Technician
% of Days 85%
1 Nurse Practitioner
% of Days 54%
1 Occupational Therapy Aide
% of Days 63%
1 Occupational Therapy Assistant
% of Days 11%
1 Medical Director
% of Days 14%

Facility Characteristics

Source: CMS Long-Term Care Facility Characteristics (Data as of Jan 2026)

Total residents 104
Medicare
15
14.4% of residents
Medicaid
67
64.4% of residents
Private pay or other
22
21.2% of residents
Programs & Services
Residents Group

Residents meet regularly to discuss policies, care quality, and activities

Active Resident Council

Organized group of residents that meets regularly to discuss facility policies, quality of life, and activities.

Quality of care over time

These measures show how residents usually do over time at this home, based on health outcomes and preventive care.

High-risk clinical events score Info A composite score based on pressure ulcers, falls with injury, weight loss, walking ability decline, and activities of daily living decline. 5.6
57% better than Maryland average

Maryland average: 12.9

Functional decline score Info A composite score based on activities of daily living decline, walking ability decline, and incontinence. 6.7
74% better than Maryland average

Maryland average: 25.7

Long-stay resident measures
Significantly above average Maryland avg: 3.7 Info CMS star rating based on long-stay quality measure performance. 5 stars = significantly above average, 1 star = significantly below average.
Need for Help with Daily Activities Increased Info Percent of long-stay residents whose need for help with daily activities has increased 7.0%
70% better than Maryland average

Maryland average: 23.7%

Walking Ability Worsened Info Percent of long-stay residents whose ability to move independently worsened 4.0%
86% better than Maryland average

Maryland average: 27.7%

Low Risk Residents with Bowel/Bladder Incontinence Info Percent of low risk long-stay residents who lose control of their bowels or bladder 9.2%
65% better than Maryland average

Maryland average: 25.9%

Falls with Major Injury Info Percent of long-stay residents experiencing one or more falls with major injury 1.4%
41% better than Maryland average

Maryland average: 2.3%

High Risk Residents with Pressure Ulcers Info Percent of long-stay high risk residents with pressure ulcers 8.2%
26% worse than Maryland average

Maryland average: 6.5%

Urinary Tract Infection Info Percent of long-stay residents with a urinary tract infection 0.0%
100% better than Maryland average

Maryland average: 1.6%

Lost Too Much Weight Info Percent of long-stay residents who lose too much weight 7.5%
29% worse than Maryland average

Maryland average: 5.8%

Depressive Symptoms Info Percent of long-stay residents who have depressive symptoms 52.8%
161% worse than Maryland average

Maryland average: 20.2%

Antipsychotic Use Info Percent of long-stay residents who received an antipsychotic medication 9.2%
29% better than Maryland average

Maryland average: 12.9%

Pneumococcal Vaccine Info Percent of long-stay residents assessed and appropriately given the pneumococcal vaccine 98.3%
7% better than Maryland average

Maryland average: 92.0%

Influenza Vaccine Info Percent of long-stay residents assessed and appropriately given the seasonal influenza vaccine 100.0%
In line with Maryland average

Maryland average: 96.6%

Hospitalizations per 1,000 days Info Number of hospitalizations per 1,000 long-stay resident days. 2.09
58% worse than Maryland average

Maryland average: 1.32

ED visits per 1,000 days Info Number of outpatient emergency department visits per 1,000 long-stay resident days. 1.39
15% worse than Maryland average

Maryland average: 1.21

Short-stay resident measures
Above average Maryland avg: 3.7 Info CMS star rating based on short-stay quality measure performance. 5 stars = much above average, 1 star = much below average.
Pneumococcal Vaccine Info Percent of short-stay residents assessed and appropriately given the pneumococcal vaccine 98.4%
25% better than Maryland average

Maryland average: 78.4%

Antipsychotic medication increase Info Percent of short-stay residents who newly received an antipsychotic medication 0.4%
73% better than Maryland average

Maryland average: 1.4%

Influenza Vaccine Info Percent of short-stay residents assessed and appropriately given the seasonal influenza vaccine 98.3%
22% better than Maryland average

Maryland average: 80.6%

Re-hospitalized after SNF stay Info Percentage of short-stay residents who were re-hospitalized after their nursing home admission. 24.1%
14% worse than Maryland average

Maryland average: 21.2%

Emergency department visits Info Percentage of short-stay residents who had an outpatient emergency department visit. 11.0%
11% worse than Maryland average

Maryland average: 9.9%

Falls with major injury Info Percentage of SNF residents who experience falls with major injury during their stay. 0.4%
47% better than Maryland average

Maryland average: 0.8%

Ability to care for self at discharge Info Percentage of residents at or above expected ability to care for themselves at discharge. 71.8%
34% better than Maryland average

Maryland average: 53.7%

Successful return to home or community Info Rate of successful return to home or community from a skilled nursing facility. 52.7%
In line with Maryland average

Maryland average: 50.6%

Penalties and fines

Federal penalties imposed by CMS for regulatory violations, including civil money penalties (fines) and denials of payment for new Medicare/Medicaid admissions.

Source: CMS Penalties Database

No penalties in the past 3 years

No civil money penalties or payment denials were reported in the last 3 years.

Compare Nursing Home around Bethesda

The information below is reported by the Maryland Department of Health, Office of Health Care Quality.

4 facilities compared · CMS & MD Dept. of Health data · Updated May 2026

Filter by care type
Maplewood Park Place
NH

Nursing Home Licensed facility providing 24/7 skilled nursing care for residents with complex, ongoing medical needs. Staffed by RNs, LPNs, and CNAs. Inspected and star-rated annually by CMS. Accepts Medicare (short-term rehab) and Medicaid (long-term care).

AL

Assisted Living A licensed, long-term care setting for seniors or individuals with disabilities who need help with daily activities — like bathing, dressing, and medication management — but not 24-hour skilled nursing. Offers housing, meals, and around-the-clock support while aiming to maximize resident independence.

IL

Independent Living Lifestyle-focused communities for older adults offering dining, activities, and transportation with minimal personal care. Best for active, independent seniors who want community without medical support.

MC

Memory Care Secured, specialized care for people living with Alzheimer's or dementia. Staff trained in cognitive impairment, with higher staff-to-resident ratios and an environment designed to reduce confusion and wandering risk.

Bethesda (Pooks Hill)29 96.7% +17%7.70 +38%+104%052.5116 38 Sunrise Senior Living Services Inc$21.4M$7.9M36.7%215287
Montcare Bethesda
NH

Nursing Home Licensed facility providing 24/7 skilled nursing care for residents with complex, ongoing medical needs. Staffed by RNs, LPNs, and CNAs. Inspected and star-rated annually by CMS. Accepts Medicare (short-term rehab) and Medicaid (long-term care).

HC

Home Care Professional care delivered in the person's own home — from companionship and errands to skilled nursing and therapy. Allows seniors to age in place. Medicare covers skilled home health when medically necessary.

MC

Memory Care Secured, specialized care for people living with Alzheimer's or dementia. Staff trained in cognitive impairment, with higher staff-to-resident ratios and an environment designed to reduce confusion and wandering risk.

Bethesda (Georgetown Village)110 84.7% +3%3.04 -13%-19%0348.5-105 70 Jack Ribikow$5.1M$1.7M33.7%215095
Sterling Care Bethesda
NH

Nursing Home Licensed facility providing 24/7 skilled nursing care for residents with complex, ongoing medical needs. Staffed by RNs, LPNs, and CNAs. Inspected and star-rated annually by CMS. Accepts Medicare (short-term rehab) and Medicaid (long-term care).

HC

Home Care Professional care delivered in the person's own home — from companionship and errands to skilled nursing and therapy. Allows seniors to age in place. Medicare covers skilled home health when medically necessary.

MC

Memory Care Secured, specialized care for people living with Alzheimer's or dementia. Staff trained in cognitive impairment, with higher staff-to-resident ratios and an environment designed to reduce confusion and wandering risk.

RC

Respite Care Short-term temporary care — days to weeks — to give family caregivers a break. Full care provided during the stay. Often used after hospitalization or to trial a facility before a permanent placement decision.

Bethesda195 90.6% +10%3.01 -71%-20%0369.0-178 45 Bbf Holdings LLC$28.4M$9.0M31.5%215187
Carriage Hill of Bethesda
NH

Nursing Home Licensed facility providing 24/7 skilled nursing care for residents with complex, ongoing medical needs. Staffed by RNs, LPNs, and CNAs. Inspected and star-rated annually by CMS. Accepts Medicare (short-term rehab) and Medicaid (long-term care).

AL

Assisted Living A licensed, long-term care setting for seniors or individuals with disabilities who need help with daily activities — like bathing, dressing, and medication management — but not 24-hour skilled nursing. Offers housing, meals, and around-the-clock support while aiming to maximize resident independence.

IL

Independent Living Lifestyle-focused communities for older adults offering dining, activities, and transportation with minimal personal care. Best for active, independent seniors who want community without medical support.

MC

Memory Care Secured, specialized care for people living with Alzheimer's or dementia. Staff trained in cognitive impairment, with higher staff-to-resident ratios and an environment designed to reduce confusion and wandering risk.

Bethesda (Maplewood)108 71.4% -13%3.47 -33%-8%03311.0-102 54 Derek Vucich$15.7M$5.7M36.3%215234

Guides for Better Senior Living

Care Cost Calculator: See Prices in Your Area

Nursing Home Data Explorer

Don’t Wait Too Long: 7 Red Flag Signs Your Parent Needs Assisted Living Now

The True Cost of Assisted Living in 2025 – And How Families Are Paying For It

Understanding Senior Living Costs: Pricing Models, Discounts & Financial Assistance

Frequently Asked Questions about Montcare Bethesda

What neighborhood is Montcare Bethesda in?

Montcare Bethesda is in the Georgetown Village neighborhood of Bethesda.

Is Montcare Bethesda in a walkable area?

Montcare Bethesda has a walk score of 70. Very walkable. Most errands can be accomplished on foot, and many essentials are within a short walk.

Are there photos of Montcare Bethesda?

Yes — there are 2 photos of Montcare Bethesda in the photo gallery on this page.

What is the address of Montcare Bethesda?

Montcare Bethesda is located at 6530 Democracy Blvd, Bethesda, MD 20817.

What is the phone number of Montcare Bethesda?

(301) 530-9000 will put you in contact with the team at Montcare Bethesda.

Is Montcare Bethesda Medicare or Medicaid certified?

Yes — Montcare Bethesda is a CMS-certified provider of Medicare and Medicaid.

Explore Open Rooms
1 Contact details
2 What type of senior care service are you looking for?
3 What budget do you have in mind for senior care?
4 How soon do you need to find care?
5 Additional details

Thank you for your interest!

Our team will be in touch shortly to help with next steps.