Explore Open Rooms

1 Contact details
2 What type of senior care service are you looking for?
3 What budget do you have in mind for senior care?
4 How soon do you need to find care?
5 Additional details

Thank you for your interest!

Our team will be in touch shortly to help with next steps.

Senior Living in Rockville

CMS overall rating Info The Overall CMS Rating combines results from health inspections, staffing levels and quality measures. Health inspections carry the most weight. Staffing and quality scores can increase or decrease the final rating based on performance compared to state and national standards.

Charles E. Smith Life Communities

6121 Montrose Rd, Rockville, MD 20852 View map
Overview of Charles E. Smith Life Communities

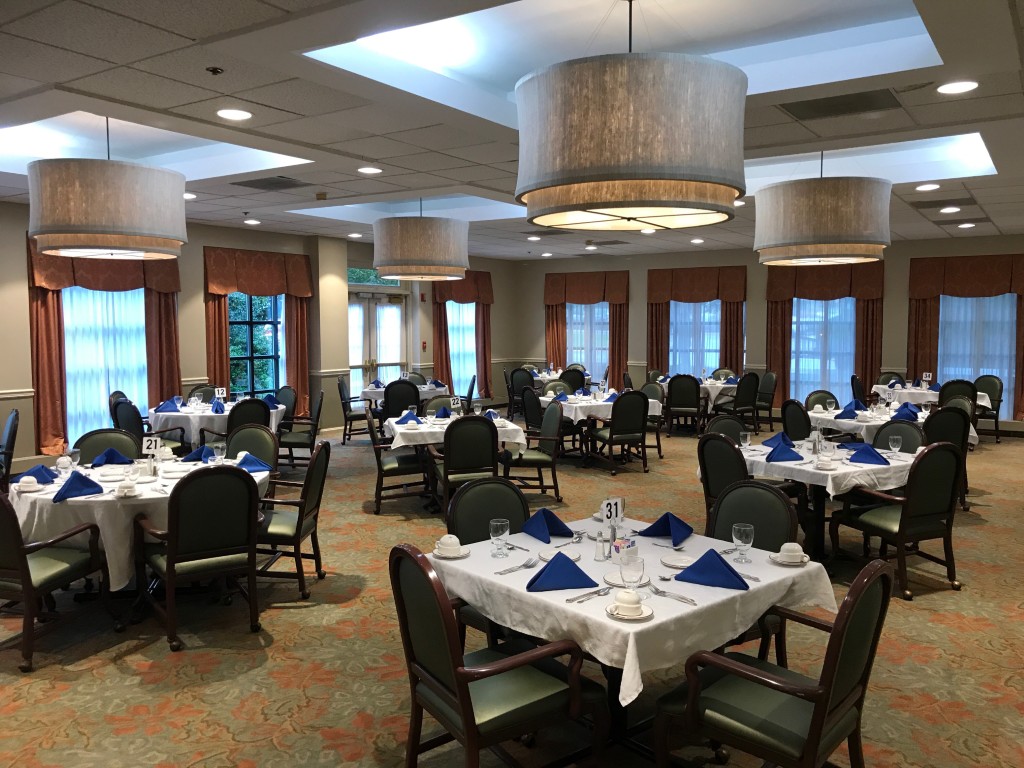
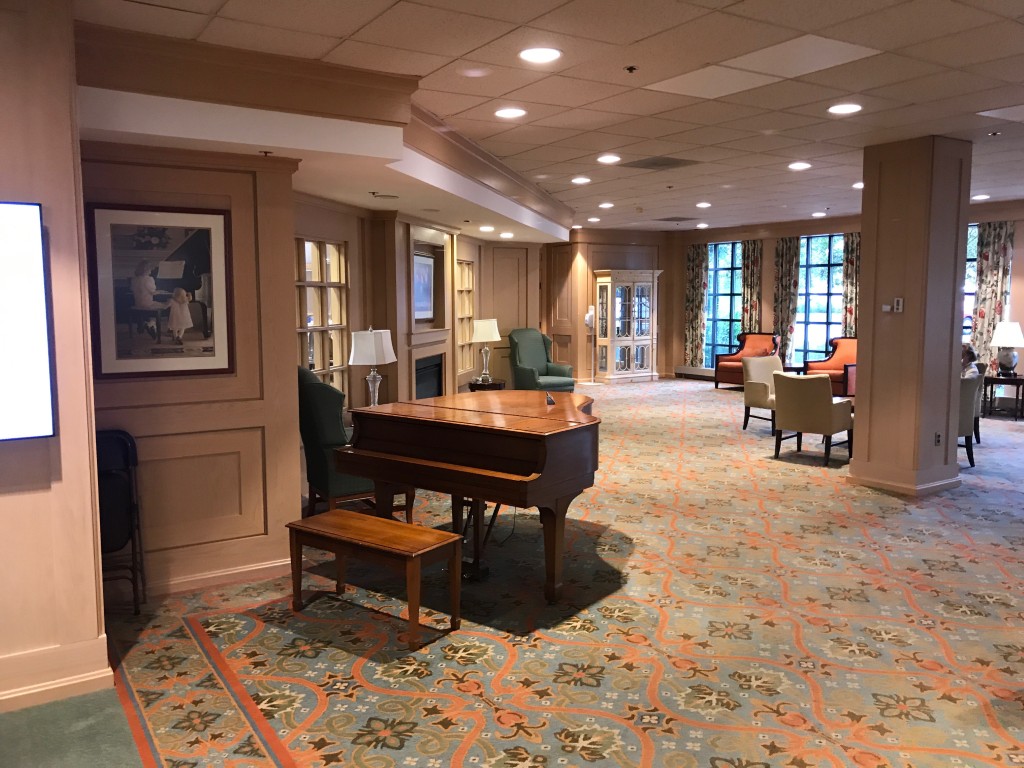
Age gracefully at Charles E. Smith Life Communities-Revitz House, a distinguished community located in the harmonious neighborhood of Rockville, MD, offering independent living. Beautifully designed one-bedroom floor plans are provided in a warm and welcoming environment, ensuring residents are comfortable and safe. A 24-hour concierge and a personal emergency response system are available for residents’ safety.

Residents will not run out of things to do, with plenty of recreational opportunities and engaging programs. Delightful dining options are also available, ensuring residents have the finest dining experience that caters to their dietary needs and preferences. Filled with state-of-the-art amenities and exceptional services, the community ensures residents have the finest retirement experience.

(667) 895-3577

Quality ratings

Measured by Centers for Medicare & Medicaid Services (CMS)

Overall rating Info The Overall CMS Rating combines results from health inspections, staffing levels and quality measures. Health inspections carry the most weight. Staffing and quality scores can increase or decrease the final rating based on performance compared to state and national standards.
4/5
Maryland average: 3.0/5
Health Inspection Info Based on the results of the facility's three most recent standard inspections and any complaint investigations. CMS reviews the number, scope, and severity of deficiencies, with more recent findings weighted more heavily.
4/5
Maryland average: 2.8/5
Staffing Info Measures average nursing staff hours per resident per day, including Registered Nurses (RNs) and total nursing staff. Ratings are adjusted based on the level of care residents require and are compared to state and national benchmarks.
4/5
Maryland average: 3.0/5
Quality Measures Info Based on clinical and physical health indicators reported to CMS, such as hospital readmissions, falls, pressure ulcers, and improvements in mobility. These measures reflect how well residents' health needs are being managed.
4/5
Maryland average: 3.7/5

Nursing care per resident

Info This shows how many total hours of nursing staff time are available per resident each day. Higher numbers usually mean more staff support.
3h 54m per day

This home provides 4% more nursing time per resident than the Maryland average.

Maryland average: 3h 46m per day

Capacity and availability

High-capacity home

May provide extensive amenities, services and programs.

Total beds 556

This home usually has availability

Lower occupancy suggests more openings may be available.

Lower demand than the Maryland average
Occupancy rate 69.4%
Residents per day (avg) 381
Occupancy rate
69.4%
Residents per day (avg)
381

Who this home usually serves

TYPE OF STAY

Mostly short-term rehab stays

Most residents typically stay for a few weeks or months before returning home or moving on.

Might be optimal for
Short stays Recovery Medicare-covered care

Breakdown by payment type

Medicare

66% of new residents, usually for short-term rehab.

Typical stay 30 days

Private pay

25% of new residents, often for short stays.

Typical stay 2 - 3 months

Medicaid

9% of new residents, often for long-term daily care.

Typical stay 2 - 3 years

Finances and operations

Voluntary non-profit community
Operated by a church.
Home revenue
$89.0M
Operating deficit
-$4.7M
Voluntary non-profit community Operated by a church.
Home revenue
$89,042,347.00
Operating deficit
$-4,733,328.00
Payroll costs Info The portion of the home's budget spent on staff, including nurses, caregivers, and other employees who support care and operations.
$35.9M
40.3% of revenue
Other operating costs Info All remaining costs needed to run the home, such as food, utilities, building maintenance, supplies and administrative expenses.
$57.9M
Total costs $93.8M
Walk Score
Walk Score: 68 / 100
Moderately walkable. Some errands can be accomplished on foot, with a mix of nearby amenities.

About this community

Safety & Compliance

Wheelchair Accessible

Care Services

Accepts Medicare
Nursing Services
Rehabilitation Services
Respite Care
Memory Care
Independent Living
Skilled Nursing
24-Hour Staffing

Amenities & Lifestyle

Rehabilitation Services
Outpatient Care
Onsite Physician Care
Award-Winning Cultural Programs
Multiple Dining Options

Programs & Activities

Specific Programs
Independent Living, Assisted Living, Memory Care, Long-Term Care, SmithLife® Home Care, ElderSAFE™ Center

Pricing & Financial Information

What does this home offer?

Housing options icon

Housing Options: Apartments / Cottages

Building type icon
Building type icon

Building Type: Mid-rise

Dining services icon

Dining Services

Transportation services icon

Transportation Services

Social and recreational activities icon

Social and Recreational Activities

Wellness Programs icon

Wellness Programs

Types of Care at Charles E. Smith Life Communities

Independent Living Memory Care
Contact Charles E. Smith Life Communities

Health Inspection History

Inspections
Total health inspections 3

Maryland average 3.9


Last Health inspection on Feb 2025

Total health citations 25

Maryland average 49.9

Citations per inspection
8.33

Maryland average 12.81


Health citations are formal notices following inspections when they fail to comply with safety and care standards.

15 of 25 citations resulted from standard inspections; and 10 of 25 came from combined inspections (standard and complaint).

Breakdown of citation severity (last 3 years)
Critical Health citations More info 0
100% better than Maryland average

Maryland average: 0.5


Serious Health citations More info 0
100% better than Maryland average

Maryland average: 0.6

0 critical citations More info Maryland average: 0.5

0 serious citations More info Maryland average: 0.6

24 moderate citations More info Maryland average: 47.2

1 minor citation More info Maryland average: 1.7
Citations history (last 3 years)
Abuse/Neglect moderate citation Info Issues related to protecting resident's from harm, including abuse, neglect, or mistreatment. Feb 07, 2025
Corrected

Abuse/Neglect moderate citation Info Issues related to protecting resident's from harm, including abuse, neglect, or mistreatment. Feb 07, 2025
Corrected

Environmental moderate citation Info Issues related to building safety, cleanliness, maintenance, and overall living conditions. Feb 07, 2025
Corrected

Nursing Services moderate citation Info Issues related to the availability and quality of nursing staff and the care they provide. Feb 07, 2025
Corrected

Compare Senior Living around Rockville The information below is reported by the Maryland Department of Health, Office of Health Care Quality.

Filter by care type
Charles E. Smith Life Communities
NH

Nursing Home Licensed facility providing 24/7 skilled nursing care for residents with complex, ongoing medical needs. Staffed by RNs, LPNs, and CNAs. Inspected and star-rated annually by CMS. Accepts Medicare (short-term rehab) and Medicaid (long-term care).

ILAL

Independent Living. Assisted Living

MC

Memory Care Secured, specialized care for people living with Alzheimer's or dementia. Staff trained in cognitive impairment, with higher staff-to-resident ratios and an environment designed to reduce confusion and wandering risk.

Rockville
556
No
68
Apartments / Cottages

Places of interest near Charles E. Smith Life Communities

Address 3.4 miles from city center

Address 6121 Montrose Rd, Rockville, MD 20852

Calculate Travel Distance to Charles E. Smith Life Communities

Add your location

Address

Staffing Data (Q2 2025)

This data corresponds to Q2 2025 and is based on CMS Payroll-Based Journal.

Total staff 449
Employees 308
Contractors 141
Staff to resident ratio 1.29:1
28% worse than Maryland average

Maryland average ratio: 1.81:1

Avg staff/day 201
Average shift 9 hours
13% better than Maryland average

Maryland average: 8 hours

Total staff hours (quarter) 163,826
Nursing staff breakdown
Registered Nurse

Manages medical care and health needs.

Total count 40
Average shift length Info Average shift length. Calculated as total hours divided by days worked and average staff per day. 9.8 hours

This role is partially covered by contractors.

Licensed Practical Nurse

Assists with medical care and medications.

Total count 84
Average shift length Info Average shift length. Calculated as total hours divided by days worked and average staff per day. 10 hours

This role is partially covered by contractors.

Certified Nursing Assistant

Helps with daily care and mobility.

Total count 201
Average shift length Info Average shift length. Calculated as total hours divided by days worked and average staff per day. 9.3 hours

This role is partially covered by contractors.

Contractor staffing

Total hours from contractors

18.6%

30,521 contractor hours this quarter

Certified Nursing Assistant: 63 Licensed Practical Nurse: 23 Speech Language Pathologist: 8 Respiratory Therapy Technician: 8 Physical Therapy Assistant: 8 Registered Nurse: 7 Physical Therapy Aide: 6 Occupational Therapy Aide: 6 Therapeutic Recreation Specialist: 5 Qualified Social Worker: 4 Occupational Therapy Assistant: 3
Staff by category
Certified Nursing Assistant1386320174,18391100%9.3
Licensed Practical Nurse61238434,61191100%10
Registered Nurse3374013,77591100%9.8
Clinical Nurse Specialist250257,60291100%7.9
RN Director of Nursing130135,9207582%7.9
Mental Health Service Worker9094,2246571%8
Other Dietary Services Staff8083,69491100%8
Physical Therapy Assistant0882,6188796%7.5
Respiratory Therapy Technician0882,5978189%7.6
Speech Language Pathologist0882,2548189%7
Other Physician6062,0377886%7.9
Occupational Therapy Aide0661,8307886%7.9
Physical Therapy Aide0661,6588492%6.1
Therapeutic Recreation Specialist0551,3576571%7.5
Qualified Social Worker0441,2166875%7.2
Feeding Assistant2029926571%8
Nurse Practitioner2029206571%8
Dietitian1015126470%8
Administrator1014886167%8
Other Social Services Staff1014415763%7.7
Medical Director1013924954%8
Medication Aide/Technician7073212527%10
Occupational Therapy Assistant0331856268%2.4
201 Certified Nursing Assistant
% of Days 100%
84 Licensed Practical Nurse
% of Days 100%
40 Registered Nurse
% of Days 100%
25 Clinical Nurse Specialist
% of Days 100%
13 RN Director of Nursing
% of Days 82%
9 Mental Health Service Worker
% of Days 71%
8 Other Dietary Services Staff
% of Days 100%
8 Physical Therapy Assistant
% of Days 96%
8 Respiratory Therapy Technician
% of Days 89%
8 Speech Language Pathologist
% of Days 89%
6 Other Physician
% of Days 86%
6 Occupational Therapy Aide
% of Days 86%
6 Physical Therapy Aide
% of Days 92%
5 Therapeutic Recreation Specialist
% of Days 71%
4 Qualified Social Worker
% of Days 75%
2 Feeding Assistant
% of Days 71%
2 Nurse Practitioner
% of Days 71%
1 Dietitian
% of Days 70%
1 Administrator
% of Days 67%
1 Other Social Services Staff
% of Days 63%
1 Medical Director
% of Days 54%
7 Medication Aide/Technician
% of Days 27%
3 Occupational Therapy Assistant
% of Days 68%

Facility Characteristics

Source: CMS Long-Term Care Facility Characteristics (Data as of Jan 2026)

Total census
347 residents
Residents by payment source
Medicare
53 residents (15.3%)
Medicaid
247 residents (71.2%)
Private pay or other
47 residents (13.5%)
Programs & Services
Residents' Group

Residents meet regularly to discuss policies, care quality, and activities

Active Resident Council

Organized group of residents that meets regularly to discuss facility policies, quality of life, and activities.

Quality of care over time

These measures show how residents usually do over time at this home, based on health outcomes and preventive care.

High-risk clinical events score Info A composite score based on pressure ulcers, falls with injury, weight loss, walking ability decline, and activities of daily living decline. 11.1
14% better than Maryland average

Maryland average: 12.9

Functional decline score Info A composite score based on activities of daily living decline, walking ability decline, and incontinence. 20.8
19% better than Maryland average

Maryland average: 25.7

Long-stay resident measures
Need for Help with Daily Activities Increased Info Percent of long-stay residents whose need for help with daily activities has increased 22.1%
7% better than Maryland average

Maryland average: 23.7%

Walking Ability Worsened Info Percent of long-stay residents whose ability to move independently worsened 20.0%
28% better than Maryland average

Maryland average: 27.7%

Low Risk Residents with Bowel/Bladder Incontinence Info Percent of low risk long-stay residents who lose control of their bowels or bladder 20.2%
22% better than Maryland average

Maryland average: 25.9%

Falls with Major Injury Info Percent of long-stay residents experiencing one or more falls with major injury 4.8%
110% worse than Maryland average

Maryland average: 2.3%

High Risk Residents with Pressure Ulcers Info Percent of long-stay high risk residents with pressure ulcers 6.2%
5% better than Maryland average

Maryland average: 6.5%

Urinary Tract Infection Info Percent of long-stay residents with a urinary tract infection 2.0%
24% worse than Maryland average

Maryland average: 1.6%

Lost Too Much Weight Info Percent of long-stay residents who lose too much weight 2.4%
59% better than Maryland average

Maryland average: 5.8%

Depressive Symptoms Info Percent of long-stay residents who have depressive symptoms 6.9%
66% better than Maryland average

Maryland average: 20.2%

Antipsychotic Use Info Percent of long-stay residents who received an antipsychotic medication 16.7%
29% worse than Maryland average

Maryland average: 12.9%

Pneumococcal Vaccine Info Percent of long-stay residents assessed and appropriately given the pneumococcal vaccine 92.9%
In line with Maryland average

Maryland average: 92.0%

Influenza Vaccine Info Percent of long-stay residents assessed and appropriately given the seasonal influenza vaccine 99.1%
In line with Maryland average

Maryland average: 96.6%

Short-stay resident measures
Pneumococcal Vaccine Info Percent of short-stay residents assessed and appropriately given the pneumococcal vaccine 83.8%
7% better than Maryland average

Maryland average: 78.4%

Antipsychotic medication increase Info Percent of short-stay residents who newly received an antipsychotic medication 1.3%
9% better than Maryland average

Maryland average: 1.4%

Influenza Vaccine Info Percent of short-stay residents assessed and appropriately given the seasonal influenza vaccine 80.7%
In line with Maryland average

Maryland average: 80.6%

Guides for Better Senior Living

Care Cost Calculator: See Prices in Your Area

Nursing Home Data Explorer

Don’t Wait Too Long: 7 Red Flag Signs Your Parent Needs Assisted Living Now

The True Cost of Assisted Living in 2025 – And How Families Are Paying For It

Understanding Senior Living Costs: Pricing Models, Discounts & Financial Assistance

Financial Aid for Maryland Seniors

Get financial aid guidance

Community Options Waiver

Maryland Medicaid Community Options Waiver

Age 65+ or disabled, Maryland resident, Medicaid- eligible, nursing home-level care need.

~$2,829/month (300% FBR, individual).

$2,000 (individual), $3,000 (couple) (excludes home, car).

High urban demand; rural outreach efforts.

Senior Care Program

Maryland Senior Care

Age 65+, Maryland resident, at risk of nursing home placement.

~$2,000/month (individual, varies by county).

$11,000 (individual).

Limited funding; waitlists common in high-demand areas.

Maryland Nursing Home Medicaid

Maryland Medical Assistance (Medicaid) Nursing Home Program

Age 65+, Maryland resident, Medicaid-eligible, requires nursing home-level care.

$943/month (individual); most income applied to care costs.

$2,500 (individual), $3,000 (couple); spousal protections up to $155,356.

Home equity limit $636,000; estate recovery applies post-55.

Senior Assisted Living Subsidy Program

Maryland Senior Assisted Living Group Home Subsidy

Age 62+, Maryland resident, in or moving to approved assisted living, low/moderate income.

~$34,000/year (individual, varies by county).

Not strict; prioritizes low-income.

Not available statewide; facility must be licensed by MDH.

Veterans Aid and Attendance (A&A) Benefit

Maryland VA Aid and Attendance

Wartime veteran/spouse, age 65+ or disabled, needs ADL help, Maryland resident.

Net income minus medical expenses < $1,984/month (individual with A&A).

$155,356 (net worth limit).

High veteran population in suburban/rural areas.

Senior Prescription Drug Assistance Program (SPDAP)

Maryland Senior Prescription Drug Assistance Program

Age 65+, Maryland resident (6+ months), Medicare Part D enrolled.

$48,560/year (individual, 300% FPL).

None specified.

Supplements Medicare Part D; annual enrollment required.

Medicare Savings Programs (MSP)

Maryland Medicare Savings Programs

Age 65+, Maryland resident, Medicare Part A/B enrollee.

$2,014/month (QMB), $2,706/month (SLMB/QI, individual).

$9,090 (individual), $13,630 (couple).

Includes QMB, SLMB, QI categories.

Community Personal Assistance Services (CPAS)

Maryland Medicaid Community Personal Assistance Services

Age 65+, Maryland resident, Medicaid-eligible, needs ADL assistance.

$943/month (individual); spend-down available.

$2,500 (individual), $3,000 (couple).

Consumer-directed option allows hiring family caregivers.