Explore Open Rooms

1 Contact details
2 What type of senior care service are you looking for?
3 What budget do you have in mind for senior care?
4 How soon do you need to find care?
5 Additional details

Thank you for your interest!

Our team will be in touch shortly to help with next steps.

Nursing Home

Cherokee Park Rehabilitation

Nursing Home

Cherokee Park Rehabilitation

2100 Cherokee Rdg Wy, Louisville, KY 40205 View map
Overview of Cherokee Park Rehabilitation

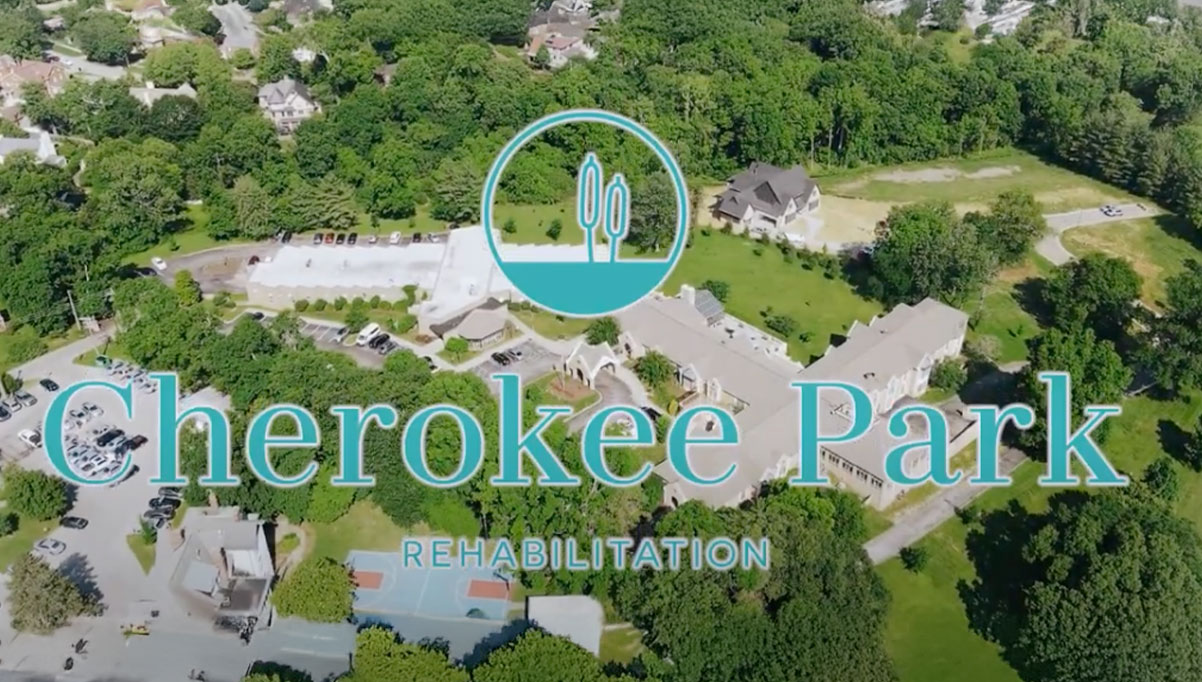
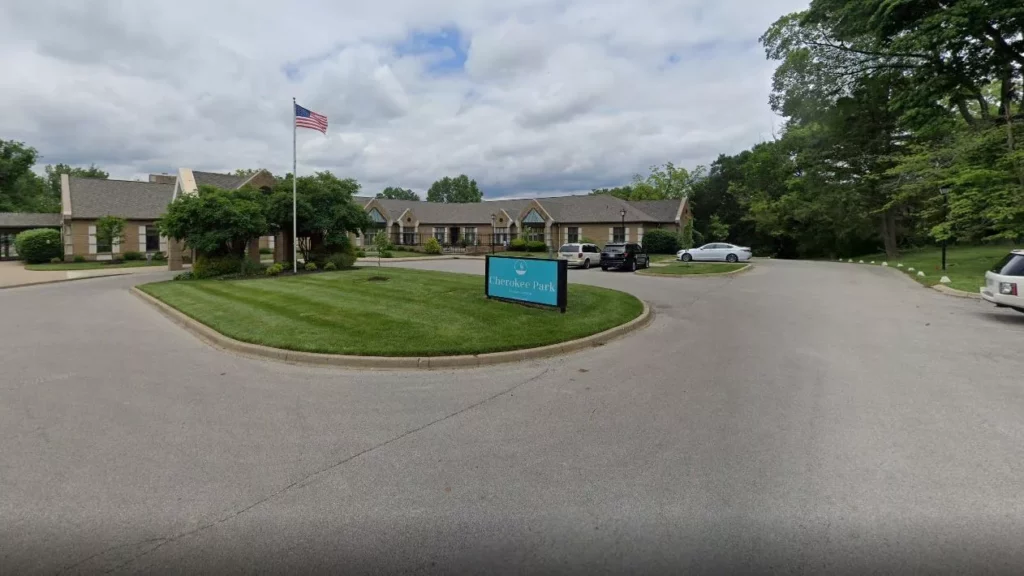
Embraced by the beauty of Louisville, Cherokee Park Rehabilitation spans 12 acres of pristine woodlands. This facility holds a wealth of heritage dating back to 1949. The exquisite upscale details of the furnished interiors and the light-filled and airy rooms create a therapeutic ambiance. The staff at Cherokee Park Rehabilitation are highly skilled and compassionate individuals driven by a genuine commitment to exceptional care. From specialized therapies to wound care, tracheotomy care to bariatric care, and even palliative care, the needs of each resident are met with expertise, ensuring a personalized approach to healing.
At Cherokee Park Rehabilitation, healing goes beyond just physical recovery. Engaging activities such as gardening outings and social gatherings are woven into the fabric of daily life, bringing joy to the hearts of the residents. The home also understands the significance of staying connected in today’s digital world. With modern amenities such as WiFi, a solarium, a grand piano, and TV, residents can stay in touch with their loved ones and enjoy the comforts of home with newfound connections.

Quality ratings

Measured by Centers for Medicare & Medicaid Services (CMS)

Overall rating Info The Overall CMS Rating combines results from health inspections, staffing levels and quality measures. Health inspections carry the most weight. Staffing and quality scores can increase or decrease the final rating based on performance compared to state and national standards.
2/5
Kentucky average: 2.8/5
Health Inspection Info Based on the results of the facility's three most recent standard inspections and any complaint investigations. CMS reviews the number, scope, and severity of deficiencies, with more recent findings weighted more heavily.
2/5
Kentucky average: 2.9/5
Staffing Info Measures average nursing staff hours per resident per day, including Registered Nurses (RNs) and total nursing staff. Ratings are adjusted based on the level of care residents require and are compared to state and national benchmarks.
3/5
Kentucky average: 2.4/5
Quality Measures Info Based on clinical and physical health indicators reported to CMS, such as hospital readmissions, falls, pressure ulcers, and improvements in mobility. These measures reflect how well residents' health needs are being managed.
2/5
Kentucky average: 2.9/5

Nursing care per resident

Info This shows how many total hours of nursing staff time are available per resident each day. Higher numbers usually mean more staff support.
3h 21m per day

This home provides 3% less nursing time per resident than the Kentucky average.

Kentucky average: 3h 27m per day

Staffing hours breakdown

Info Hours of care per resident per day, broken down by staff type. Data from CMS Medicare.
Staff type Facility State avg National avg
Registered Nurse (RN) Info Registered nurse hours per resident per day. 52m per day 46m per day 41m per day
Nurse Aide Info Nurse aide hours per resident per day. 1h 52m per day 2h 25m per day 2h 21m per day
Total Nursing (Weekend) Info Total number of nurse staff hours per resident per day on weekends. 3h 12m per day 3h 29m per day 3h 26m per day
Physical Therapist Info Physical therapist staff hours per resident per day. 3m per day 4m per day 4m per day
RN (Weekend) Info Registered nurse hours per resident per day on weekends. 48m per day 31m per day 29m per day

Capacity and availability

Medium-capacity home

Offers a balance of services and community atmosphere.

Total beds 104

This home usually has availability

Lower occupancy suggests more openings may be available.

Lower demand than the Kentucky average
Occupancy rate 71.2%
Residents per day (avg) 93
Occupancy rate
71.2%
Residents per day (avg)
93

Who this home usually serves

TYPE OF STAY

Mix of rehab and long-term care

This home supports both short-term rehab and long-term care, with residents staying for a wide range of durations.

Breakdown by payment type

Medicare

29% of new residents, usually for short-term rehab.

Typical stay 24 days

Private pay

41% of new residents, often for short stays.

Typical stay 2 - 3 months

Medicaid

30% of new residents, often for long-term daily care.

Typical stay 7 - 8 months

Finances and operations

Privately-owned community
Operated by a business corporation.
Home revenue
$11.4M
Operating loss
-$329.3K
Privately-owned community Operated by a business corporation.
Home revenue
$11,390,073.00
Operating loss
$-329,327.00
Payroll costs Info The portion of the home's budget spent on staff, including nurses, caregivers, and other employees who support care and operations.
$5.5M
48.7% of revenue
Other operating costs Info All remaining costs needed to run the home, such as food, utilities, building maintenance, supplies and administrative expenses.
$6.2M
Total costs $11.7M
Bed community size
104-bed community
A larger shared setting that may offer more common spaces and organized community services.
Years in operation
8 years in operation
An established community with some operational experience and growing routines.
Walk Score
Walk Score: 49 / 100
Somewhat walkable. A few nearby services may be reachable on foot, but most trips require transportation.
BBB Rating
BBB Rating: A+ (Not Accredited)
An independent rating from the Better Business Bureau based on factors such as complaint history, transparency, and business practices.
How BBB ratings work

About this community

Occupancy

Occupancy rate
71%
In line with Kentucky average
Occupied beds
74 / 104
Average residents 80 per day

License details

Facility type
Long Term Care (nursing Facility)
Issuance February 1, 2025
Expiration January 31, 2026
County: JEFFERSON

Additional licensing details

License number: 100221
CMS Certification Number: 185237

Ownership & operating entity

Cherokee Park Rehabilitation is legally operated by CHEROKEE PARK REHABILITATION, LLC, and administrated by MICHAEL.

Type Of Units

NF (Nursing Facility)
104 units
Total beds
104 units

Staffing

Key information about the people who lead and staff this community.

Leadership

Contact: Mr. Michael Peel, Administrator

Care Services

Nursing Services
Rehabilitation Services

Amenities & Lifestyle

Wifi
Solarium
Gardening
Musical Performances
Community Outings
Grand Piano

Programs & Activities

Specific Programs
Speech Therapy, Occupational Therapy, Physical Therapy, Wound Care, Tracheotomy Care, Bariatric Care, Palliative Care
Contact Cherokee Park Rehabilitation

Inspection History

In Kentucky, the Cabinet for Health and Family Services, Office of Inspector General is the regulatory authority that conducts inspections and investigates complaints in all long-term care homes.

3 visits/inspections

2 routine inspections

Results

3 with issues

0 without issues

Latest inspection

Date:July 9, 2025
Type:Annual Inspection

36 deficiencies

Deficiencies indicate regulatory issues. A higher number implies the facility had several areas requiring improvement.

Health Inspection History

Inspections
Total health inspections 3

Kentucky average 2.9


Last Health inspection on Jul 2025

Total health citations 35

Kentucky average 13.5

Citations per inspection
11.67

Kentucky average 4.4


Health citations are formal notices following inspections when they fail to comply with safety and care standards.

33 of 35 citations resulted from standard inspections; and 2 of 35 came from combined inspections (standard and complaint).

Breakdown of citation severity (last 3 years)
Critical Health citations More info 1
9% better than Kentucky average

Kentucky average: 1.1


Serious Health citations More info 4
567% worse than Kentucky average

Kentucky average: 0.6

1 critical citation More info Kentucky average: 1.1

4 serious citations More info Kentucky average: 0.6

30 moderate citations More info Kentucky average: 11.6

0 minor citations More info Kentucky average: 0.1
Citations history (last 3 years)
Nutrition moderate citation Info Issues related to food quality, meal service, and resident's nutritional needs. Jul 09, 2025
Corrected

Pharmacy moderate citation Info Issues related to medication management, including how drugs are stored, administered, and monitored. Jul 09, 2025
Corrected

Quality of Care moderate citation Info Issues related to how well residents receive appropriate treatment and support for their medical and daily care needs. Jul 09, 2025
Corrected

Infection Control moderate citation Info Issues related to preventing and controlling infections, including hygiene practices and safety protocols. Jun 14, 2024
Corrected

Compare Nursing Homes around Louisville The information below is reported by the Kentucky Cabinet for Health and Family Services, Office of Inspector General.

5 facilities compared · CMS & KY Dept. of Health data · Updated Mar 2026

Cherokee Park Rehabilitation
NH

Nursing Home Licensed facility providing 24/7 skilled nursing care for residents with complex, ongoing medical needs. Staffed by RNs, LPNs, and CNAs. Inspected and star-rated annually by CMS. Accepts Medicare (short-term rehab) and Medicaid (long-term care).

AL

Assisted Living A licensed, long-term care setting for seniors or individuals with disabilities who need help with daily activities — like bathing, dressing, and medication management — but not 24-hour skilled nursing. Offers housing, meals, and around-the-clock support while aiming to maximize resident independence.

Louisville (Highlands Douglass)
104
87.1%
+7%
3.36
+67%
-10%
1
35
5
93
A+
49
Cherokee Park Rehabilitation, Llc
$11,4M
$5,5M
48.8%
185237
Christian Health Center of Louisville
NH

Nursing Home Licensed facility providing 24/7 skilled nursing care for residents with complex, ongoing medical needs. Staffed by RNs, LPNs, and CNAs. Inspected and star-rated annually by CMS. Accepts Medicare (short-term rehab) and Medicaid (long-term care).

AL

Assisted Living A licensed, long-term care setting for seniors or individuals with disabilities who need help with daily activities — like bathing, dressing, and medication management — but not 24-hour skilled nursing. Offers housing, meals, and around-the-clock support while aiming to maximize resident independence.

Louisville (Old Louisville)
122
71.5%
-12%
3.45
-26%
-8%
0
16
0
104
-
83
-
$12,8M
$4,2M
32.4%
185029
Chestnut Ridge Health & Rehabilitation
-
NH

Nursing Home Licensed facility providing 24/7 skilled nursing care for residents with complex, ongoing medical needs. Staffed by RNs, LPNs, and CNAs. Inspected and star-rated annually by CMS. Accepts Medicare (short-term rehab) and Medicaid (long-term care).

AL

Assisted Living A licensed, long-term care setting for seniors or individuals with disabilities who need help with daily activities — like bathing, dressing, and medication management — but not 24-hour skilled nursing. Offers housing, meals, and around-the-clock support while aiming to maximize resident independence.

LOUISVILLE
92
-
-
-
-
-
-
-
-
0
0
0
-
-
-
-
-
-
-
-
Eastern Star Home in Ky
-
NH

Nursing Home Licensed facility providing 24/7 skilled nursing care for residents with complex, ongoing medical needs. Staffed by RNs, LPNs, and CNAs. Inspected and star-rated annually by CMS. Accepts Medicare (short-term rehab) and Medicaid (long-term care).

AL

Assisted Living A licensed, long-term care setting for seniors or individuals with disabilities who need help with daily activities — like bathing, dressing, and medication management — but not 24-hour skilled nursing. Offers housing, meals, and around-the-clock support while aiming to maximize resident independence.

LOUISVILLE
42
-
-
-
-
-
-
-
-
0
0
0
-
-
-
-
-
-
-
-
Eastway Health & Rehabilitation
-
NH

Nursing Home Licensed facility providing 24/7 skilled nursing care for residents with complex, ongoing medical needs. Staffed by RNs, LPNs, and CNAs. Inspected and star-rated annually by CMS. Accepts Medicare (short-term rehab) and Medicaid (long-term care).

AL

Assisted Living A licensed, long-term care setting for seniors or individuals with disabilities who need help with daily activities — like bathing, dressing, and medication management — but not 24-hour skilled nursing. Offers housing, meals, and around-the-clock support while aiming to maximize resident independence.

LOUISVILLE
252
-
-
-
-
-
-
-
-
0
0
0
-
-
-
-
-
-
-
-

Places of interest near Cherokee Park Rehabilitation

Address 4.5 miles from city center — 1.55 miles to nearest hospital (UofL Health u2013 Peace Hospital)

Address 2100 Cherokee Rdg Wy, Louisville, KY 40205

Calculate Travel Distance to Cherokee Park Rehabilitation

Add your location

Address

Staffing Data (Q2 2025)

This data corresponds to Q2 2025 and is based on CMS Payroll-Based Journal.

Total staff 110
Employees 98
Contractors 12
Staff to resident ratio 1.26:1
28% worse than Kentucky average

Kentucky average ratio: 1.75:1

Avg staff/day 43
Average shift 8.8 hours
0% compared with Kentucky average

Kentucky average: 8.5 hours

Total staff hours (quarter) 34,314
Nursing staff breakdown
Registered Nurse

Manages medical care and health needs.

Total count 19
Average shift length Info Average shift length. Calculated as total hours divided by days worked and average staff per day. 9.5 hours

No contractors work on this role.

Licensed Practical Nurse

Assists with medical care and medications.

Total count 15
Average shift length Info Average shift length. Calculated as total hours divided by days worked and average staff per day. 9 hours

No contractors work on this role.

Certified Nursing Assistant

Helps with daily care and mobility.

Total count 43
Average shift length Info Average shift length. Calculated as total hours divided by days worked and average staff per day. 9.5 hours

No contractors work on this role.

Contractor staffing

Total hours from contractors

7.1%

2,443 contractor hours this quarter

Physical Therapy Aide: 4 Respiratory Therapy Technician: 3 Physical Therapy Assistant: 2 Speech Language Pathologist: 2 Qualified Social Worker: 1
Staff by category
Certified Nursing Assistant4304314,37691100%9.5
Registered Nurse190196,28391100%9.5
Licensed Practical Nurse150154,33491100%9
RN Director of Nursing5051,3837481%8.1
Other Dietary Services Staff4041,35791100%6.6
Medication Aide/Technician3031,0598593%7.9
Administrator2029766571%8
Physical Therapy Aide0447366571%6.4
Speech Language Pathologist0226736470%6.3
Clinical Nurse Specialist4046716369%8
Physical Therapy Assistant0225357077%7.6
Nurse Practitioner1015206571%8
Mental Health Service Worker1014725965%8
Respiratory Therapy Technician0334606369%7.3
Dietitian1014405560%8
Qualified Social Worker011402022%2
43 Certified Nursing Assistant
% of Days 100%
19 Registered Nurse
% of Days 100%
15 Licensed Practical Nurse
% of Days 100%
5 RN Director of Nursing
% of Days 81%
4 Other Dietary Services Staff
% of Days 100%
3 Medication Aide/Technician
% of Days 93%
2 Administrator
% of Days 71%
4 Physical Therapy Aide
% of Days 71%
2 Speech Language Pathologist
% of Days 70%
4 Clinical Nurse Specialist
% of Days 69%
2 Physical Therapy Assistant
% of Days 77%
1 Nurse Practitioner
% of Days 71%
1 Mental Health Service Worker
% of Days 65%
3 Respiratory Therapy Technician
% of Days 69%
1 Dietitian
% of Days 60%
1 Qualified Social Worker
% of Days 22%

Facility Characteristics

Source: CMS Long-Term Care Facility Characteristics (Data as of Jan 2026)

Total census
87 residents
Residents by payment source
Medicare
4 residents (4.6%)
Medicaid
76 residents (87.4%)
Private pay or other
7 residents (8%)
Programs & Services
Residents' Group

Residents meet regularly to discuss policies, care quality, and activities

Active Resident Council

Organized group of residents that meets regularly to discuss facility policies, quality of life, and activities.

Quality of care over time

These measures show how residents usually do over time at this home, based on health outcomes and preventive care.

High-risk clinical events score Info A composite score based on pressure ulcers, falls with injury, weight loss, walking ability decline, and activities of daily living decline. 13.0
24% worse than Kentucky average

Kentucky average: 10.5

Functional decline score Info A composite score based on activities of daily living decline, walking ability decline, and incontinence. 23.5
24% worse than Kentucky average

Kentucky average: 18.9

Long-stay resident measures
Below average Kentucky avg: 3.6 Info CMS star rating based on long-stay quality measure performance. 5 stars = significantly above average, 1 star = significantly below average.
Need for Help with Daily Activities Increased Info Percent of long-stay residents whose need for help with daily activities has increased 23.3%
39% worse than Kentucky average

Kentucky average: 16.8%

Walking Ability Worsened Info Percent of long-stay residents whose ability to move independently worsened 28.7%
46% worse than Kentucky average

Kentucky average: 19.6%

Low Risk Residents with Bowel/Bladder Incontinence Info Percent of low risk long-stay residents who lose control of their bowels or bladder 18.6%
9% better than Kentucky average

Kentucky average: 20.5%

Falls with Major Injury Info Percent of long-stay residents experiencing one or more falls with major injury 3.3%
12% better than Kentucky average

Kentucky average: 3.8%

High Risk Residents with Pressure Ulcers Info Percent of long-stay high risk residents with pressure ulcers 4.8%
16% better than Kentucky average

Kentucky average: 5.8%

Urinary Tract Infection Info Percent of long-stay residents with a urinary tract infection 6.3%
236% worse than Kentucky average

Kentucky average: 1.9%

Lost Too Much Weight Info Percent of long-stay residents who lose too much weight 4.6%
31% better than Kentucky average

Kentucky average: 6.8%

Depressive Symptoms Info Percent of long-stay residents who have depressive symptoms 0.0%
100% better than Kentucky average

Kentucky average: 14.3%

Antipsychotic Use Info Percent of long-stay residents who received an antipsychotic medication 12.7%
18% better than Kentucky average

Kentucky average: 15.6%

Pneumococcal Vaccine Info Percent of long-stay residents assessed and appropriately given the pneumococcal vaccine 94.3%
In line with Kentucky average

Kentucky average: 93.9%

Influenza Vaccine Info Percent of long-stay residents assessed and appropriately given the seasonal influenza vaccine 98.9%
In line with Kentucky average

Kentucky average: 96.2%

Hospitalizations per 1,000 days Info Number of hospitalizations per 1,000 long-stay resident days. 1.83
In line with Kentucky average

Kentucky average: 1.87

ED visits per 1,000 days Info Number of outpatient emergency department visits per 1,000 long-stay resident days. 1.60
27% better than Kentucky average

Kentucky average: 2.19

Short-stay resident measures
Average Kentucky avg: 2.3 Info CMS star rating based on short-stay quality measure performance. 5 stars = much above average, 1 star = much below average.
Pneumococcal Vaccine Info Percent of short-stay residents assessed and appropriately given the pneumococcal vaccine 78.0%
7% worse than Kentucky average

Kentucky average: 83.7%

Antipsychotic medication increase Info Percent of short-stay residents who newly received an antipsychotic medication 0.5%
76% better than Kentucky average

Kentucky average: 1.9%

Influenza Vaccine Info Percent of short-stay residents assessed and appropriately given the seasonal influenza vaccine 83.0%
In line with Kentucky average

Kentucky average: 83.6%

Re-hospitalized after SNF stay Info Percentage of short-stay residents who were re-hospitalized after their nursing home admission. 23.3%
5% better than Kentucky average

Kentucky average: 24.5%

Emergency department visits Info Percentage of short-stay residents who had an outpatient emergency department visit. 7.5%
46% better than Kentucky average

Kentucky average: 13.9%

Falls with major injury Info Percentage of SNF residents who experience falls with major injury during their stay. 2.9%
271% worse than Kentucky average

Kentucky average: 0.8%

Ability to care for self at discharge Info Percentage of residents at or above expected ability to care for themselves at discharge. 62.2%
16% better than Kentucky average

Kentucky average: 53.7%

Successful return to home or community Info Rate of successful return to home or community from a skilled nursing facility. 33.7%
33% worse than Kentucky average

Kentucky average: 50.6%

Penalties and fines

Federal penalties imposed by CMS for regulatory violations, including civil money penalties (fines) and denials of payment for new Medicare/Medicaid admissions.

Source: CMS Penalties Database (Data as of Jan 2026)

Total fines amount $12K
81% lower than Kentucky average

Kentucky average: $63K

Number of fines 1
57% fewer fines than Kentucky average

Kentucky average: 2.3

Payment Denials Info Serious action where Medicare and/or Medicaid temporarily stops payments for new residents until issues are fixed. 1
206% more payment denials than Kentucky average

Kentucky average: 0.3

Fines amount comparison
This facility $12K
Kentucky average $63K
Penalty History

Penalties are imposed by CMS for violations of federal nursing home regulations.

Civil Money Penalty Info Fines imposed for noncompliance, which can be assessed per day or per instance of violation. Jun 14, 2024
$12K
Payment Denial Info Serious action where Medicare and/or Medicaid temporarily stops payments for new residents until issues are fixed. Jun 14, 2024
20 days

Last updated: Jan 2026

Guides for Better Senior Living

Care Cost Calculator: See Prices in Your Area

Nursing Home Data Explorer

Don’t Wait Too Long: 7 Red Flag Signs Your Parent Needs Assisted Living Now

The True Cost of Assisted Living in 2025 – And How Families Are Paying For It

Understanding Senior Living Costs: Pricing Models, Discounts & Financial Assistance

Financial Aid for Kentucky Seniors

Get financial aid guidance

Home and Community Based Waiver

Kentucky Medicaid HCB Waiver

Age 65+ or disabled, Kentucky resident, Medicaid-eligible, nursing home-level care need.

~$2,829/month (300% FBR, individual).

$2,000 (individual), $3,000 (couple).

Rural focus; waitlists possible.

Hart-Supported Living Program

KY Hart-Supported Living

Age 65+ or disabled, Kentucky resident.

No strict limit; prioritizes low-income.

Not applicable.

Competitive grants; limited availability.

Kentucky Homecare Program

Kentucky Homecare Program

Age 60+, Kentucky resident, at risk of nursing home placement, not eligible for Medicaid waivers.

No strict limit; prioritizes low-income (~$24,980/year individual).

Not assessed; need-based focus.

15 AAAs; rural focus; not in nursing homes.

Medicare Savings Program (MSP)

Kentucky Medicare Savings Program

Age 65+ or disabled, Kentucky resident, Medicare Part A/B.

~$2,510/month (QMB), ~$3,380/month (SLMB), ~$3,598/month (QI)—individual.

$9,430 (individual), $14,130 (couple).

Three tiers; no waitlist; auto Extra Help for Part D.

National Family Caregiver Support Program (NFCSP) Respite

Kentucky NFCSP Respite Care

Caregivers of 60+ needing care or 55+ caregivers of others; Kentucky resident; functional needs (2+ ADLs).

Prioritizes ~$24,980/year (individual); no strict cap.

Not assessed; need-based.

15 AAAs; prioritizes low-income, rural caregivers.

Kentucky Family Caregiver Program

Kentucky Family Caregiver Program

Grandparents (often 55+) as primary caregivers to grandchildren under 18, Kentucky resident, not on Kinship Care.

~$31,225/year (individual); varies by AAA.

Not strictly assessed; need-based.

Max $1,500/year; statewide via AAAs.

Senior Community Service Employment Program (SCSEP)

Kentucky SCSEP

Age 55+, unemployed, low-income, Kentucky resident.

~$1,983/month (125% FPL).

Not specified; income-focused.

Priority for veterans, rural residents.

VA Aid and Attendance (A&A) and Housebound Benefits

Kentucky VA Aid and Attendance/Housebound

Age 65+ or disabled veteran/spouse, Kentucky resident, wartime service, need for ADL help (A&A) or homebound.

Net income < ~$1,984/month (veteran with dependent, A&A); pension offsets income.

~$155,356 (net worth limit).

High veteran demand in rural areas.

Tour Icon
Planning a tour? Check our touring checklist.
Chat Icon
Thinking of living here? We can help you speak to a current resident