Total health inspections
4
Tennessee average 3.5
Last Health inspection on Oct 2023

We arrange tours, appointments, and even moving support so you don’t have to
Thank you for your interest!
Our team will be in touch shortly to help with next steps.
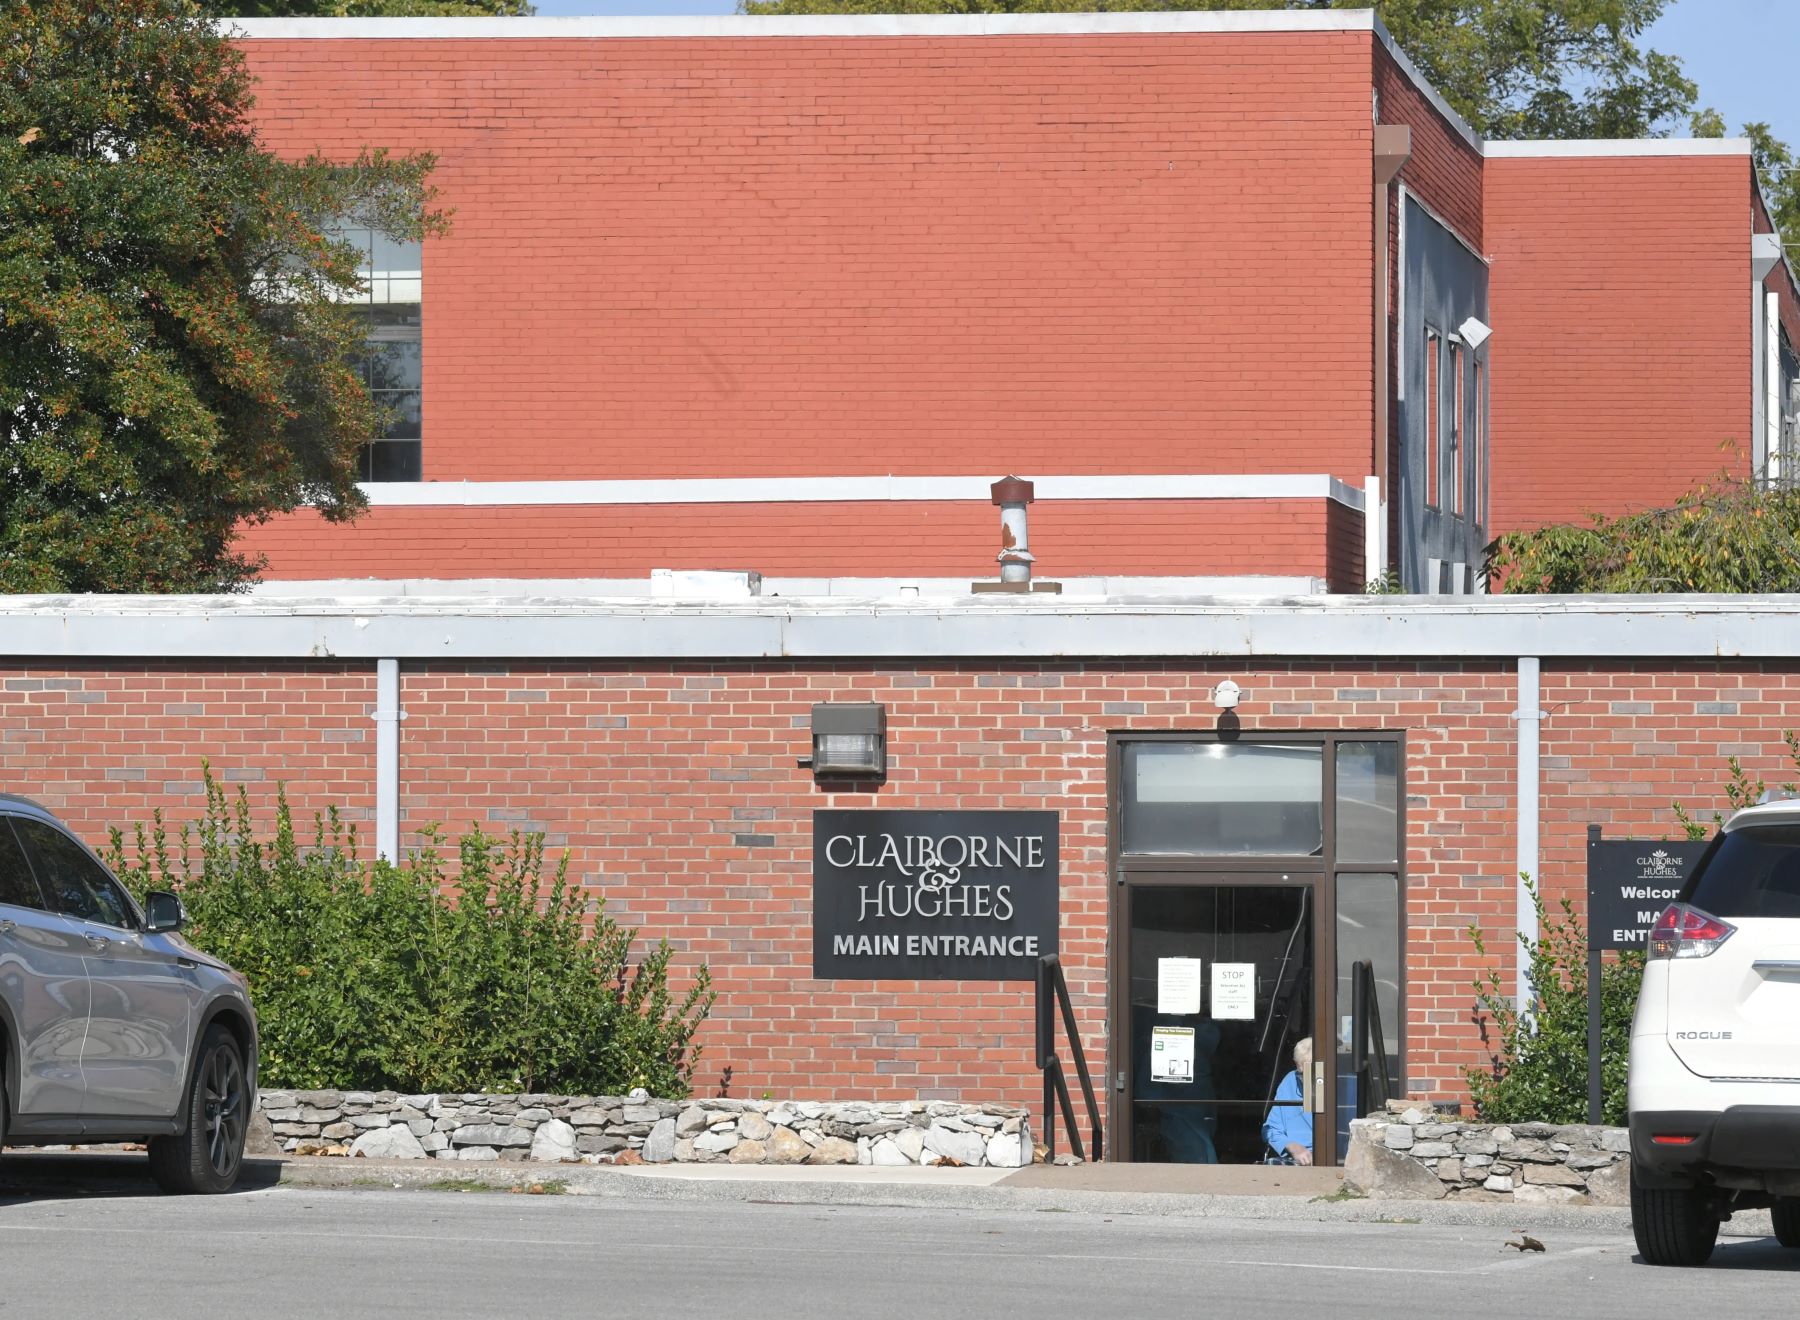
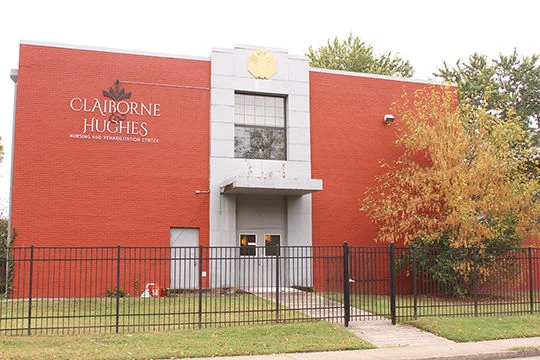
Claiborne and Hughes Health Center, a prominent nursing and rehabilitation center in Franklin, offers a diverse range of care options designed to enhance the lives of seniors in the community. Renowned for its high-caliber skilled nursing and rehabilitation facilities, the center is a credible choice for individuals recovering from conditions like strokes, heart attacks, and other ailments requiring specialized care. With cutting-edge technology and a trusted team, this facility stands as a premier destination for those seeking skilled nursing care.
Beyond the standard nursing care, Claiborne and Hughes Health Center provides on-site dialysis, hospice care, dementia care, and long-term care, ensuring a comprehensive approach to residents’ well-being. Far from being dull, life here is filled with opportunities for recreation and entertainment, catering to individuals with varying physical and cognitive abilities. The commitment to dining excellence further contributes to the exceptional experience residents can expect at this skilled nursing home, where activities are tailored to enhance the senior living journey.
Offers a balance of services and community atmosphere.
Lower occupancy suggests more openings may be available.
Most residents stay for extended periods and receive ongoing daily care.
23% of new residents, usually for short-term rehab.
51% of new residents, often for short stays.
26% of new residents, often for long-term daily care.
Key information about the people who lead and staff this community.
In Tennessee, the Department of Health, Division of Health Care Facilities performs unannounced inspections and investigations to ensure facilities provide high-quality resident care.
3 visits/inspections triggered by complaints
1 routine inspections
4 with issues
0 without issues
Tennessee average: 9 complaint visits
Deficiencies indicate regulatory issues. A higher number implies the facility had several areas requiring improvement.
Tennessee average: 17 deficiencies
Tennessee average 3.5
Last Health inspection on Oct 2023
Tennessee average 15.4
Tennessee average 4.39
Health citations are formal notices following inspections when they fail to comply with safety and care standards.
29 of 35 citations resulted from standard inspections; 4 of 35 resulted from complaint investigations; and 2 of 35 came from combined inspections (standard and complaint).
Tennessee average: 1.1
Tennessee average: 0.6
Data sourced from CMS Health Deficiencies reports. Citation severity codes range from A (least serious) to L (most serious). Immediate Jeopardy (J-L) citations indicate situations where the facility's noncompliance has placed residents at risk of death or serious harm.
Assisted Living A licensed, long-term care setting for seniors or individuals with disabilities who need help with daily activities — like bathing, dressing, and medication management — but not 24-hour skilled nursing. Offers housing, meals, and around-the-clock support while aiming to maximize resident independence.
Nursing Home Licensed facility providing 24/7 skilled nursing care for residents with complex, ongoing medical needs. Staffed by RNs, LPNs, and CNAs. Inspected and star-rated annually by CMS. Accepts Medicare (short-term rehab) and Medicaid (long-term care).
Respite Care Short-term temporary care — days to weeks — to give family caregivers a break. Full care provided during the stay. Often used after hospitalization or to trial a facility before a permanent placement decision.
Nursing Home Licensed facility providing 24/7 skilled nursing care for residents with complex, ongoing medical needs. Staffed by RNs, LPNs, and CNAs. Inspected and star-rated annually by CMS. Accepts Medicare (short-term rehab) and Medicaid (long-term care).
Assisted Living A licensed, long-term care setting for seniors or individuals with disabilities who need help with daily activities — like bathing, dressing, and medication management — but not 24-hour skilled nursing. Offers housing, meals, and around-the-clock support while aiming to maximize resident independence.
Home Care Professional care delivered in the person's own home — from companionship and errands to skilled nursing and therapy. Allows seniors to age in place. Medicare covers skilled home health when medically necessary.
Memory Care Secured, specialized care for people living with Alzheimer's or dementia. Staff trained in cognitive impairment, with higher staff-to-resident ratios and an environment designed to reduce confusion and wandering risk.
Nursing Home Licensed facility providing 24/7 skilled nursing care for residents with complex, ongoing medical needs. Staffed by RNs, LPNs, and CNAs. Inspected and star-rated annually by CMS. Accepts Medicare (short-term rehab) and Medicaid (long-term care).
Assisted Living A licensed, long-term care setting for seniors or individuals with disabilities who need help with daily activities — like bathing, dressing, and medication management — but not 24-hour skilled nursing. Offers housing, meals, and around-the-clock support while aiming to maximize resident independence.
![]() 1 mile from city center — 0.29 miles to nearest hospital (GracePointe Healthcare)
1 mile from city center — 0.29 miles to nearest hospital (GracePointe Healthcare)
![]() 200 Strahl St, Franklin, TN 37064
200 Strahl St, Franklin, TN 37064
Add your location
This data corresponds to Q2 2025 and is based on CMS Payroll-Based Journal.
Tennessee average ratio: 1.79:1
Tennessee average: 8.3 hours
Manages medical care and health needs.
This role is partially covered by contractors.
Assists with medical care and medications.
This role is partially covered by contractors.
Helps with daily care and mobility.
This role is partially covered by contractors.
Total hours from contractors
5,089 contractor hours this quarter
| Certified Nursing Assistant | 48 | 108 | 156 | 17,506 | 91 | 100% | 9.4 |
| Licensed Practical Nurse | 13 | 73 | 86 | 5,877 | 91 | 100% | 8.9 |
| RN Director of Nursing | 5 | 0 | 5 | 2,318 | 80 | 88% | 7.9 |
| Respiratory Therapy Technician | 4 | 0 | 4 | 608 | 67 | 74% | 6.9 |
| Nurse Practitioner | 2 | 0 | 2 | 544 | 63 | 69% | 8 |
| Dietitian | 3 | 0 | 3 | 515 | 61 | 67% | 7.9 |
| Administrator | 2 | 0 | 2 | 504 | 63 | 69% | 8 |
| Registered Nurse | 8 | 8 | 16 | 485 | 51 | 56% | 7.5 |
| Other Dietary Services Staff | 5 | 0 | 5 | 455 | 53 | 58% | 7.6 |
| Mental Health Service Worker | 1 | 0 | 1 | 447 | 54 | 59% | 8.3 |
| Qualified Activities Professional | 1 | 0 | 1 | 432 | 54 | 59% | 8 |
| Clinical Nurse Specialist | 3 | 0 | 3 | 407 | 45 | 49% | 7.8 |
| Physical Therapy Aide | 6 | 0 | 6 | 247 | 59 | 65% | 3.7 |
| Occupational Therapy Aide | 1 | 0 | 1 | 148 | 24 | 26% | 6.2 |
| Physical Therapy Assistant | 3 | 0 | 3 | 89 | 17 | 19% | 5.3 |
| Speech Language Pathologist | 1 | 0 | 1 | 66 | 19 | 21% | 3.5 |
| Qualified Social Worker | 2 | 0 | 2 | 13 | 6 | 7% | 2.2 |
| Medication Aide/Technician | 0 | 1 | 1 | 8 | 1 | 1% | 7.6 |
Source: CMS Long-Term Care Facility Characteristics (Data as of Jan 2026)
Residents meet regularly to discuss policies, care quality, and activities
Organized group of residents that meets regularly to discuss facility policies, quality of life, and activities.
Data sourced from CMS Long-Term Care Facility Characteristics quarterly report. Payer mix reflects the current resident census by primary payment source.
These measures show how residents usually do over time at this home, based on health outcomes and preventive care.
Tennessee average: 10.5
Tennessee average: 19.5
Tennessee average: 16.0%
Tennessee average: 21.7%
Tennessee average: 20.7%
Tennessee average: 3.7%
Tennessee average: 5.4%
Tennessee average: 2.1%
Tennessee average: 6.3%
Tennessee average: 11.0%
Tennessee average: 16.5%
Tennessee average: 89.9%
Tennessee average: 94.5%
Tennessee average: 79.7%
Tennessee average: 1.7%
Tennessee average: 79.8%
Quality measures are calculated from Minimum Data Set (MDS) assessments. For most measures, lower percentages indicate better care quality.
Historical financial and operational data for Claiborne and Hughes Health Center based on CMS SNF Cost Reports.
Loading trend charts...
Care Cost Calculator: See Prices in Your Area
Nursing Home Data Explorer
Don’t Wait Too Long: 7 Red Flag Signs Your Parent Needs Assisted Living Now
The True Cost of Assisted Living in 2025 – And How Families Are Paying For It
Understanding Senior Living Costs: Pricing Models, Discounts & Financial Assistance

Touring a community? Use this expert-backed checklist to stay organized, ask the right questions, and find the perfect fit.
We'll send you a PDF version of the touring checklist.