Claiborne and Hughes Health Center

Nursing Home in Franklin

CMS overall rating Info The Overall CMS Rating is scored from 1 to 5 stars and combines results from health inspections, staffing levels, and quality measures. Health inspections carry the most weight. Staffing and quality scores can increase or decrease the final rating based on performance compared to state and national standards.
Calculator: See prices in your area
Claiborne and Hughes Health Center accepts Medicare, Medicaid, and private pay.

Overview of Claiborne and Hughes Health Center

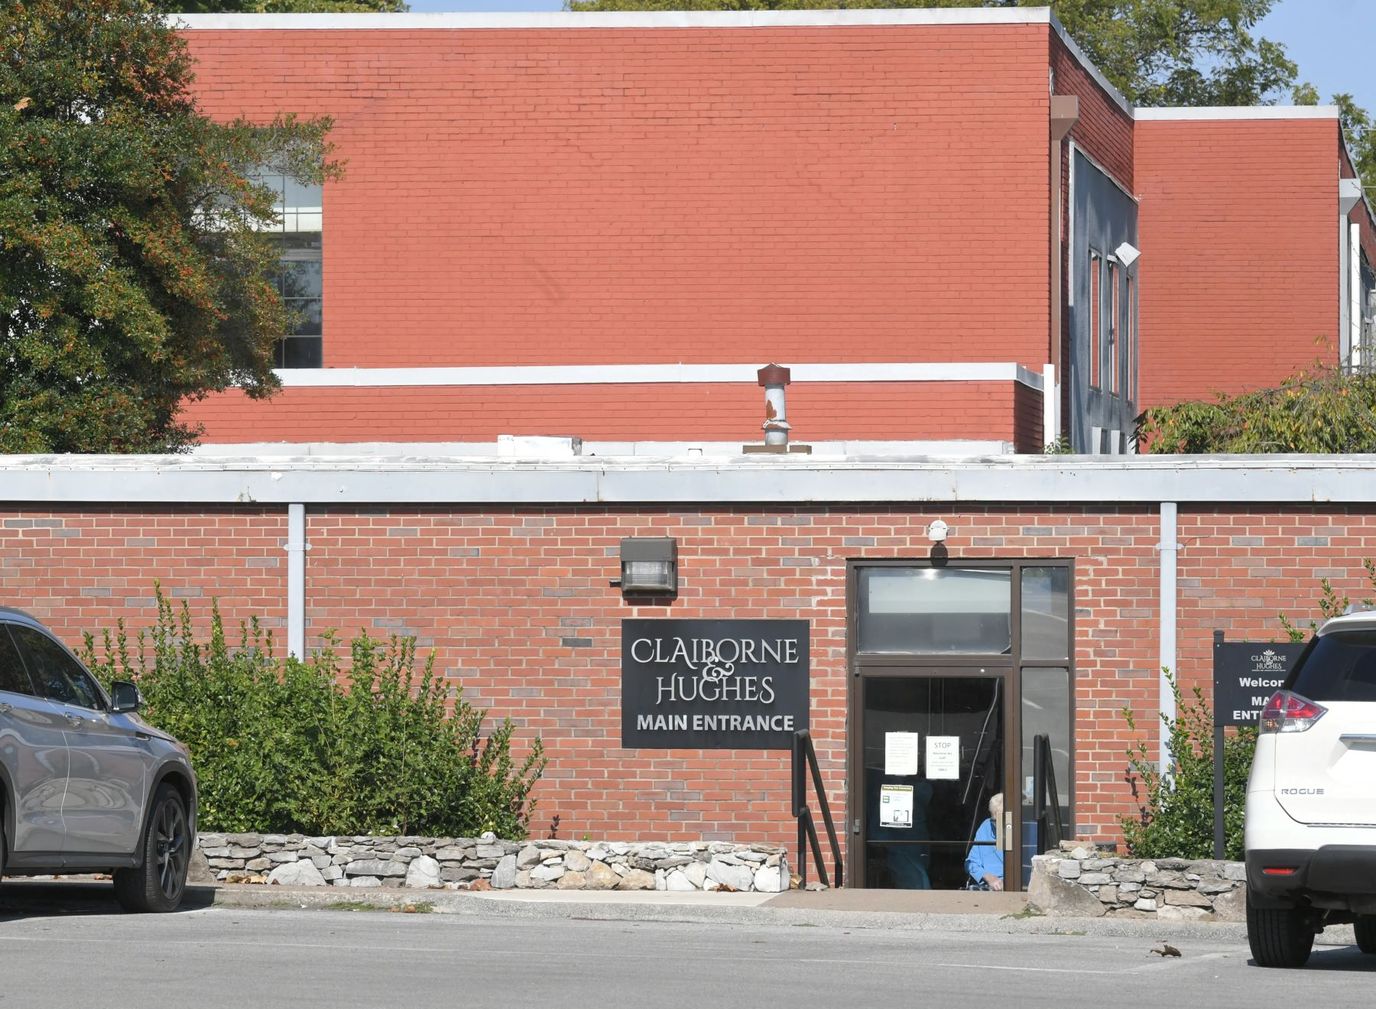
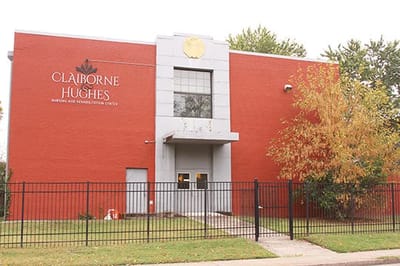
Claiborne and Hughes Health Center, a prominent nursing and rehabilitation center in Franklin, offers a diverse range of care options designed to enhance the lives of seniors in the community. Renowned for its high-caliber skilled nursing and rehabilitation facilities, the center is a credible choice for individuals recovering from conditions like strokes, heart attacks, and other ailments requiring specialized care. With cutting-edge technology and a trusted team, this facility stands as a premier destination for those seeking skilled nursing care.

Beyond the standard nursing care, Claiborne and Hughes Health Center provides on-site dialysis, hospice care, dementia care, and long-term care, ensuring a comprehensive approach to residents’ well-being. Far from being dull, life here is filled with opportunities for recreation and entertainment, catering to individuals with varying physical and cognitive abilities. The commitment to dining excellence further contributes to the exceptional experience residents can expect at this skilled nursing home, where activities are tailored to enhance the senior living journey.

(615) 791-1103

Quality ratings

Measured by Centers for Medicare & Medicaid Services (CMS)

Overall rating Info The Overall CMS Rating combines results from health inspections, staffing levels and quality measures. Health inspections carry the most weight. Staffing and quality scores can increase or decrease the final rating based on performance compared to state and national standards.
1/5 ▼ 2.1 Tennessee average: 3.1/5
Health Inspection Info Based on the results of the facility's three most recent standard inspections and any complaint investigations. CMS reviews the number, scope, and severity of deficiencies, with more recent findings weighted more heavily.
1/5 ▼ 1.9 Tennessee average: 2.9/5
Staffing Info Measures average nursing staff hours per resident per day, including Registered Nurses (RNs) and total nursing staff. Ratings are adjusted based on the level of care residents require and are compared to state and national benchmarks.
1/5 ▼ 1.5 Tennessee average: 2.5/5
Quality Measures Info Based on clinical and physical health indicators reported to CMS, such as hospital readmissions, falls, pressure ulcers, and improvements in mobility. These measures reflect how well residents' health needs are being managed.
3/5 ▼ 0.7 Tennessee average: 3.7/5

Staffing hours breakdown

Info Daily nursing hours per resident by staff type, reported to CMS. Higher is generally better — compare this facility to state and national averages to see where staffing stands.

Hours per resident per day — compared to Tennessee state averages

Total nursing care / resident Info This home is ranked 70th out of 134 homes in Tennessee.

Total adjusted nursing hours per resident per day, combining RN, LPN, and aide time. CMS adjusts this for case-mix so facilities can be fairly compared.
3h 26m per day
Rank #70 / 134Nurse hours — state benchmarkedThis home is ranked 70th out of 134 homes in Tennessee.Shows adjusted nurse hours per resident per day benchmarked to the Tennessee average, with a ranking across 134 Tennessee SNFs. More hours mean more direct care. The national average is about 3.5 hrs; below 3.0 is a red flag.
This facility Tennessee avg (3h 40m per day)
vs Tennessee avg
-6%

6 of 6 metrics below state avg

Staff type Hours / day vs state avg
Registered Nurse (RN) Info RNs hold the highest nursing license and can assess residents, interpret test results, and direct care plans. More RN hours per day often signals stronger clinical oversight and faster response to health changes. 11m per day ▼ 70% State avg: 37m per day · National avg: 41m per day
LPN / LVN Info Licensed Practical Nurses (LPNs) or Licensed Vocational Nurses (LVNs) deliver routine hands-on care — medication administration, wound dressing, and monitoring vital signs. They work under RN supervision and make up a large share of daily bedside care. 1h 1m per day ▼ 8% State avg: 1h 6m per day · National avg: 52m per day
Nurse Aide Info Certified Nurse Aides (CNAs) provide the most direct day-to-day assistance: bathing, dressing, feeding, and mobility. Nurse aide hours are typically the largest staffing category and directly affect residents' quality of life. 2h 1m per day ▼ 6% State avg: 2h 9m per day · National avg: 2h 21m per day
Total Nursing (Weekend) Info Combined nursing hours (RN + LPN + Nurse Aide) per resident per day on weekends. Staffing often drops on weekends — this figure reveals whether the facility maintains adequate coverage outside of weekday hours. 2h 53m per day ▼ 14% State avg: 3h 21m per day · National avg: 3h 26m per day
Physical Therapist Info Hours per resident per day provided by licensed Physical Therapists (PTs) or PT Assistants. PT services help residents recover mobility after injury or illness and are especially important for post-acute (short-stay) rehabilitation. 4m per day ▼ 20% State avg: 5m per day · National avg: 4m per day
RN (Weekend) Info Registered nurse hours specifically on weekends. Facilities sometimes reduce RN presence on Saturdays and Sundays — a low weekend RN figure compared to weekday hours can indicate reduced clinical oversight when most administrative staff are absent. 7m per day ▼ 72% State avg: 25m per day · National avg: 29m per day

Capacity and availability

This home usually has availability

Occupancy lower than 85% suggests more openings may be available.

Lower occupancy than the Tennessee average: 73%
Occupancy rate 59.6% Rank #114 / 139Occupancy rate — state benchmarkedThis home is ranked 114th out of 139 homes in Tennessee.Shows this facility's occupancy rate versus the Tennessee average, with its statewide rank out of 139. Higher occupancy signals strong local demand and financial stability.
Avg. Length of Stay 481 days
Occupancy rate
59.6% Rank #114 / 139Occupancy rate — state benchmarkedThis home is ranked 114th out of 139 homes in Tennessee.Shows this facility's occupancy rate versus the Tennessee average, with its statewide rank out of 139. Higher occupancy signals strong local demand and financial stability.
Avg. Length of Stay
481 days

Who this home usually serves

TYPE OF STAY

Mostly long-term care residents

Most residents stay for extended periods and receive ongoing daily care.

Breakdown by payment type

Medicare

23% of new residents, usually for short-term rehab.

Typical stay 2 - 3 months

Private pay

51% of new residents, often for short stays.

Typical stay 4 - 5 months

Medicaid

26% of new residents, often for long-term daily care.

Typical stay 3 years

Finances and operations

Privately-owned community
Operated by a partnership between two or more business owners.
Home revenue
$11.0M
Operating loss
-$200.2K
Privately-owned community Operated by a partnership between two or more business owners.
Home revenue
$11.0M Rank #92 / 139Revenue — state benchmarkedThis home is ranked 92nd out of 139 homes in Tennessee.Shows this facility's annual revenue compared to the Tennessee SNF average. Higher revenue generally means more resources for staffing and capital — read alongside Payroll %.
Operating loss
-$200.2K
Payroll costs Info The portion of the home's budget spent on staff, including nurses, caregivers, and other employees who support care and operations. Rank #81 / 139Payroll — state benchmarkedThis home is ranked 81st out of 139 homes in Tennessee.Shows total annual staff payroll benchmarked to the Tennessee average. Higher payroll investment relative to peers often signals better staffing and less reliance on cheaper contract labor.
$4.1M
37.1% of revenue Rank #60 / 139Payroll % — state benchmarkedThis home is ranked 60th out of 139 homes in Tennessee.Shows payroll as a percentage of revenue versus the Tennessee average. Well-run SNFs often land around 55–65%. Below 25% may signal understaffing or heavy agency use — read with Staffing ratings.
Other operating costs Info All remaining costs needed to run the home, such as food, utilities, building maintenance, supplies and administrative expenses.
$7.1M
Total costs $11.2M
Years in operation
45 years in operation
A longer operating history, which may indicate experience navigating regulations and delivering ongoing care.
Walk Score
Walk Score: 72 / 100 Rank #5 / 56Walk Score — state benchmarkedThis home is ranked 5th out of 56 homes in Tennessee.Shows how walkable this facility's neighborhood is compared to the average Walk Score across Tennessee SNFs. Higher scores benefit residents, families, and staff.
Very walkable. Most errands can be accomplished on foot, and many essentials are within a short walk.
BBB Rating
BBB Rating: A+ (Not Accredited)
An independent rating from the Better Business Bureau based on factors such as complaint history, transparency, and business practices.
How BBB ratings work

Staffing

Key information about the people who lead and staff this community.

Leadership

ContactMs. Millicent Morley, Administrator

Types of Care at Claiborne and Hughes Health Center

Skilled Nursing Hospice Care Memory Care

Contact Claiborne and Hughes Health Center

Inspection History

In Tennessee, the Department of Health, Division of Health Care Facilities performs unannounced inspections and investigations to ensure facilities provide high-quality resident care.

4 visits/inspections Info Inspections are mandatory, regular evaluations conducted by state health departments or regulatory agencies. They ensure the community provides safe, compliant care, covering areas like resident health, staff and management.

Tennessee average: 9 complaint visits

Latest inspection

Date October 27, 2023
Complaint Investigation

35 deficiencies

Deficiencies indicate regulatory issues. A higher number implies the facility had several areas requiring improvement.

Tennessee average: 17 deficiencies

Inspection Report Summary for Claiborne and Hughes Health Center

The most recent inspection on October 27, 2023, identified deficiencies related to verbal abuse by dietary staff, failure to timely report and investigate injuries of unknown origin, and improper transfer methods for a resident. Earlier inspections showed a pattern of issues with abuse reporting, resident care planning, monitoring of health conditions like blood glucose, and infection control. Prior complaint investigations substantiated failures in abuse reporting and supervision, including a 2021 investigation that found immediate jeopardy related to resident safety and staff training, though enforcement actions were not listed in the available reports. Most complaints were substantiated, particularly those involving abuse and inadequate investigation or reporting. The facility’s inspection history indicates ongoing challenges with abuse prevention and regulatory compliance, with no clear improvement trend evident.

Health Inspection History

Inspections
Total health inspections 4

Tennessee average 3.5


Last Health inspection on Oct 2023

Total health citations
35 Rank #132 / 138Health citations — state benchmarkedThis home is ranked 132nd out of 138 homes in Tennessee.Shows this facility's total health deficiency citations benchmarked to the Tennessee state average, with a ranking across all 138 TN SNFs. Lower citation counts earn a better rank.

Tennessee average 15.4

Citations per inspection
8.75 Rank #134 / 138Citations per inspection — state benchmarkedThis home is ranked 134th out of 138 homes in Tennessee.Shows average deficiency citations per CMS inspection for this facility versus the Tennessee mean across 138 SNFs with citation data. Lower is better.

Tennessee average 4.39


Health citations are formal notices following inspections when they fail to comply with safety and care standards.

29 of 35 citations resulted from standard inspections; 4 of 35 resulted from complaint investigations; and 2 of 35 came from combined inspections (standard and complaint).

Breakdown of citation severity (last 3 years)
Critical Health citations More info
5
355% worse than Tennessee average

Tennessee average: 1.1


Serious Health citations More info 0
100% better than Tennessee average

Tennessee average: 0.6

5 critical citations More info Tennessee average: 1.1

0 serious citations More info Tennessee average: 0.6

30 moderate citations More info Tennessee average: 13.7

0 minor citations More info Tennessee average: 0.1
Citations history (last 3 years)
Abuse/Neglect moderate citation Info Issues related to protecting resident's from harm, including abuse, neglect, or mistreatment. Oct 27, 2023
Corrected

Abuse/Neglect moderate citation Info Issues related to protecting resident's from harm, including abuse, neglect, or mistreatment. Oct 27, 2023
Corrected

Abuse/Neglect moderate citation Info Issues related to protecting resident's from harm, including abuse, neglect, or mistreatment. Oct 27, 2023
Corrected

Quality of Care moderate citation Info Issues related to how well residents receive appropriate treatment and support for their medical and daily care needs. Oct 27, 2023
Corrected

Financial Assistance for
Nursing Home in Tennessee

Claiborne and Hughes Health Center is located in Franklin, Tennessee.
Here are the financial assistance programs available to residents in Tennessee.

Get Financial aid guidance

CHOICES Program

TN Medicaid CHOICES

Age 65+ or disabled
General Tennessee resident, Medicaid-eligible, nursing home-level care need.
Income Limits (2025) ~$2,829/month 300% FBR, individual
Asset Limits $2,000 (individual), $3,000 (couple).
TN

Managed care model; high rural demand.

Benefits
Personal care (5-7 hours/day) Respite (240 hours/year) Adult day care ($65/day) Home modifications ($1,500 avg.)

Tennessee Options for Community Living

TN Options

Age 60+
General Tennessee resident, at risk of nursing home.
Income Limits ~$2,000/month individual, varies
Asset Limits $5,000 individual
TN

Limited funding; rural/urban balance.

Benefits
In-home care (3-5 hours/week) Respite (up to 10 days/year) Transportation (~5 trips/month)

Medicare Savings Program (MSP)

Tennessee Medicare Savings Program

Age 65+ or disabled
General TN resident, Medicare Part A/B.
Income Limits (2025) ~$2,510/month (QMB), ~$3,380/month (SLMB), ~$3,598/month (QI)—individual.
Asset Limits $9,430 (individual), $14,130 (couple).
TN

Three tiers; includes Extra Help for Part D; no waitlist.

Benefits
Covers Part B premiums ($174.70/month) Deductibles ($240/year) Copays (~20%)

Low-Income Home Energy Assistance Program (LIHEAP)

Tennessee LIHEAP

Age 60+ prioritized
General TN resident, low-income household.
Income Limits (2025) ~$3,970/month individual, 185% FPL
Asset Limits Not assessed; income-focused.
TN

Covers gas, electric, propane; emergency aid available.

Benefits
Heating/cooling aid ($300-$1,000/season) Emergency aid ($500 max)

Family Caregiver Support Program (FCSP)

Tennessee Family Caregiver Support Program

Age
General Caregivers of 60+ needing care or 55+ caregivers of others; TN resident; functional needs (2+ ADLs).
Income Limits (2025) No strict cap; prioritizes low-income ~$24,980/year
Asset Limits Not assessed; need-based.
TN

Includes grandparent caregivers; high rural demand.

Benefits
Respite (4-6 hours/week or 5 days/year) Adult day care ($60/day) Training Supplies (~$500/year)

Senior Community Service Employment Program (SCSEP)

Tennessee SCSEP

Age 55+
General unemployed, low-income, TN resident.
Income Limits (2025) ~$1,983/month 125% FPL
Asset Limits Not specified; income-focused.
TN

Priority for veterans, rural residents; AARP/Goodwill partnership.

Benefits
Paid training (~20 hours/week at ~$7.25/hour) Job placement

VA Aid and Attendance (A&A) and Housebound Benefits

Tennessee VA Aid and Attendance/Housebound

Age 65+ or disabled veteran/spouse
General TN resident, wartime service, need for ADL help (A&A) or homebound.
Income Limits (2025) Net income < ~$1,984/month (veteran with dependent, A&A); pension offsets income.
Asset Limits ~$155,356 net worth limit
TN

High veteran population; supports rural/urban care needs.

Benefits
Cash (~$1,433-$2,642/month veteran, ~$951-$1,318 spouse) for care costs (e.g., in-home, assisted living)

Elderly Nutrition Program

Tennessee Elderly Nutrition Program

Age 60+
General TN resident; no income limit but prioritizes low-income.
Income Limits (2025) None; donations encouraged.
Asset Limits Not assessed.
TN

Serves ~50,000 annually; 200+ congregate sites plus Meals on Wheels.

Benefits
Congregate meals ($5-$7/meal value) at senior centers Home-delivered meals ($5-$7/meal)

Property Tax Relief Program

Tennessee Property Tax Relief Program

Age 65+
General TN resident, homeowner/renter (or widow/er 50+, disabled 18+).
Income Limits (2025) ~$45,000/year household, excludes half of Social Security
Asset Limits Not assessed; income-focused.
TN

Rebates up to $1,000; serves ~100,000 annually.

Benefits
Tax rebates (~$250-$1,000 based on income; e.g., $1,000 if income < $8,000)

Places of interest near Claiborne and Hughes Health Center

Address 1 mile from city center — 0.29 miles to nearest hospital (GracePointe Healthcare)

Calculate Travel Distance to Claiborne and Hughes Health Center

Add your location

Address

Staffing Data (Q2 2025)

This data corresponds to Q2 2025 and is based on CMS Payroll-Based Journal.

Total staff 298
Employees 108
Contractors 190
Staff to resident ratio 3.27:1
83% better than Tennessee average

Tennessee average ratio: 1.79:1

Avg staff/day 39
Average shift 8.6 hours
0% compared with Tennessee average

Tennessee average: 8.3 hours

Total staff hours (quarter) 30,670
Nursing staff breakdown
Registered Nurse

Manages medical care and health needs.

Total count 16
Average shift length Info Average shift length. Calculated as total hours divided by days worked and average staff per day. 7.5 hours

This role is partially covered by contractors.

Licensed Practical Nurse

Assists with medical care and medications.

Total count 86
Average shift length Info Average shift length. Calculated as total hours divided by days worked and average staff per day. 8.9 hours

This role is partially covered by contractors.

Certified Nursing Assistant

Helps with daily care and mobility.

Total count 156
Average shift length Info Average shift length. Calculated as total hours divided by days worked and average staff per day. 9.4 hours

This role is partially covered by contractors.

Contractor staffing

Total hours from contractors

16.6%

5,089 contractor hours this quarter

Certified Nursing Assistant: 108 Licensed Practical Nurse: 73 Registered Nurse: 8 Medication Aide/Technician: 1
Staff by category
Certified Nursing Assistant 48 108 156 17,506 91 100% 9.4
Licensed Practical Nurse 13 73 86 5,877 91 100% 8.9
RN Director of Nursing 5 0 5 2,318 80 88% 7.9
Respiratory Therapy Technician 4 0 4 608 67 74% 6.9
Nurse Practitioner 2 0 2 544 63 69% 8
Dietitian 3 0 3 515 61 67% 7.9
Administrator 2 0 2 504 63 69% 8
Registered Nurse 8 8 16 485 51 56% 7.5
Other Dietary Services Staff 5 0 5 455 53 58% 7.6
Mental Health Service Worker 1 0 1 447 54 59% 8.3
Qualified Activities Professional 1 0 1 432 54 59% 8
Clinical Nurse Specialist 3 0 3 407 45 49% 7.8
Physical Therapy Aide 6 0 6 247 59 65% 3.7
Occupational Therapy Aide 1 0 1 148 24 26% 6.2
Physical Therapy Assistant 3 0 3 89 17 19% 5.3
Speech Language Pathologist 1 0 1 66 19 21% 3.5
Qualified Social Worker 2 0 2 13 6 7% 2.2
Medication Aide/Technician 0 1 1 8 1 1% 7.6
156 Certified Nursing Assistant
% of Days 100%
86 Licensed Practical Nurse
% of Days 100%
5 RN Director of Nursing
% of Days 88%
4 Respiratory Therapy Technician
% of Days 74%
2 Nurse Practitioner
% of Days 69%
3 Dietitian
% of Days 67%
2 Administrator
% of Days 69%
16 Registered Nurse
% of Days 56%
5 Other Dietary Services Staff
% of Days 58%
1 Mental Health Service Worker
% of Days 59%
1 Qualified Activities Professional
% of Days 59%
3 Clinical Nurse Specialist
% of Days 49%
6 Physical Therapy Aide
% of Days 65%
1 Occupational Therapy Aide
% of Days 26%
3 Physical Therapy Assistant
% of Days 19%
1 Speech Language Pathologist
% of Days 21%
2 Qualified Social Worker
% of Days 7%
1 Medication Aide/Technician
% of Days 1%

Facility Characteristics

Source: CMS Long-Term Care Facility Characteristics (Data as of Jan 2026)

Total residents 91
Medicare
12
13.2% of residents
Medicaid
61
67% of residents
Private pay or other
18
19.8% of residents
Programs & Services
Residents Group

Residents meet regularly to discuss policies, care quality, and activities

Active Resident Council

Organized group of residents that meets regularly to discuss facility policies, quality of life, and activities.

Quality of care over time

These measures show how residents usually do over time at this home, based on health outcomes and preventive care.

High-risk clinical events score Info A composite score based on pressure ulcers, falls with injury, weight loss, walking ability decline, and activities of daily living decline. 9.8
6% better than Tennessee average

Tennessee average: 10.5

Functional decline score Info A composite score based on activities of daily living decline, walking ability decline, and incontinence. 14.0
28% better than Tennessee average

Tennessee average: 19.5

Long-stay resident measures
Average Tennessee avg: 3.7 Info CMS star rating based on long-stay quality measure performance. 5 stars = significantly above average, 1 star = significantly below average.
Need for Help with Daily Activities Increased Info Percent of long-stay residents whose need for help with daily activities has increased 11.9%
26% better than Tennessee average

Tennessee average: 16.0%

Walking Ability Worsened Info Percent of long-stay residents whose ability to move independently worsened 14.7%
32% better than Tennessee average

Tennessee average: 21.7%

Low Risk Residents with Bowel/Bladder Incontinence Info Percent of low risk long-stay residents who lose control of their bowels or bladder 15.5%
25% better than Tennessee average

Tennessee average: 20.7%

Falls with Major Injury Info Percent of long-stay residents experiencing one or more falls with major injury 6.1%
68% worse than Tennessee average

Tennessee average: 3.7%

High Risk Residents with Pressure Ulcers Info Percent of long-stay high risk residents with pressure ulcers 5.4%
In line with Tennessee average

Tennessee average: 5.4%

Urinary Tract Infection Info Percent of long-stay residents with a urinary tract infection 0.3%
85% better than Tennessee average

Tennessee average: 2.1%

Lost Too Much Weight Info Percent of long-stay residents who lose too much weight 11.0%
74% worse than Tennessee average

Tennessee average: 6.3%

Depressive Symptoms Info Percent of long-stay residents who have depressive symptoms 1.0%
91% better than Tennessee average

Tennessee average: 11.0%

Antipsychotic Use Info Percent of long-stay residents who received an antipsychotic medication 29.8%
80% worse than Tennessee average

Tennessee average: 16.5%

Pneumococcal Vaccine Info Percent of long-stay residents assessed and appropriately given the pneumococcal vaccine 34.2%
62% worse than Tennessee average

Tennessee average: 89.9%

Influenza Vaccine Info Percent of long-stay residents assessed and appropriately given the seasonal influenza vaccine 89.3%
6% worse than Tennessee average

Tennessee average: 94.5%

Hospitalizations per 1,000 days Info Number of hospitalizations per 1,000 long-stay resident days. 1.43
9% better than Tennessee average

Tennessee average: 1.58

ED visits per 1,000 days Info Number of outpatient emergency department visits per 1,000 long-stay resident days. 1.85
18% worse than Tennessee average

Tennessee average: 1.57

Short-stay resident measures
Significantly below average Tennessee avg: 3.4 Info CMS star rating based on short-stay quality measure performance. 5 stars = much above average, 1 star = much below average.
Pneumococcal Vaccine Info Percent of short-stay residents assessed and appropriately given the pneumococcal vaccine 49.8%
37% worse than Tennessee average

Tennessee average: 79.7%

Antipsychotic medication increase Info Percent of short-stay residents who newly received an antipsychotic medication 1.0%
39% better than Tennessee average

Tennessee average: 1.7%

Influenza Vaccine Info Percent of short-stay residents assessed and appropriately given the seasonal influenza vaccine 62.9%
21% worse than Tennessee average

Tennessee average: 79.8%

Re-hospitalized after SNF stay Info Percentage of short-stay residents who were re-hospitalized after their nursing home admission. 16.1%
27% better than Tennessee average

Tennessee average: 22.2%

Emergency department visits Info Percentage of short-stay residents who had an outpatient emergency department visit. 13.6%
21% worse than Tennessee average

Tennessee average: 11.2%

Falls with major injury Info Percentage of SNF residents who experience falls with major injury during their stay. 0.0%
100% better than Tennessee average

Tennessee average: 0.8%

Ability to care for self at discharge Info Percentage of residents at or above expected ability to care for themselves at discharge. 29.2%
46% worse than Tennessee average

Tennessee average: 53.7%

Successful return to home or community Info Rate of successful return to home or community from a skilled nursing facility. 33.7%
33% worse than Tennessee average

Tennessee average: 50.6%

Penalties and fines

Federal penalties imposed by CMS for regulatory violations, including civil money penalties (fines) and denials of payment for new Medicare/Medicaid admissions.

Source: CMS Penalties Database

Penalty History

Penalties are imposed by CMS for violations of federal nursing home regulations.

No penalties in the past 3 years

No civil money penalties or payment denials were reported in the last 3 years.

Compare Nursing Homes around Franklin The information below is reported by the Tennessee Department of Health, Division of Health Care Facilities.

5 facilities compared · CMS & TN Dept. of Health data · Updated Apr 2026

Filter by care type
NHC HealthCare in Franklin
AL

Assisted Living A licensed, long-term care setting for seniors or individuals with disabilities who need help with daily activities — like bathing, dressing, and medication management — but not 24-hour skilled nursing. Offers housing, meals, and around-the-clock support while aiming to maximize resident independence.

NH

Nursing Home Licensed facility providing 24/7 skilled nursing care for residents with complex, ongoing medical needs. Staffed by RNs, LPNs, and CNAs. Inspected and star-rated annually by CMS. Accepts Medicare (short-term rehab) and Medicaid (long-term care).

RC

Respite Care Short-term temporary care — days to weeks — to give family caregivers a break. Full care provided during the stay. Often used after hospitalization or to trial a facility before a permanent placement decision.

Franklin 44 20.5% -72% 3.46 +38% -5% 0 9 3.0 1 76 A+ 47 Norris, Chelsey $11.0M $5.2M 47.2% 445127
Claiborne and Hughes Health Center
NH

Nursing Home Licensed facility providing 24/7 skilled nursing care for residents with complex, ongoing medical needs. Staffed by RNs, LPNs, and CNAs. Inspected and star-rated annually by CMS. Accepts Medicare (short-term rehab) and Medicaid (long-term care).

AL

Assisted Living A licensed, long-term care setting for seniors or individuals with disabilities who need help with daily activities — like bathing, dressing, and medication management — but not 24-hour skilled nursing. Offers housing, meals, and around-the-clock support while aiming to maximize resident independence.

HC

Home Care Professional care delivered in the person's own home — from companionship and errands to skilled nursing and therapy. Allows seniors to age in place. Medicare covers skilled home health when medically necessary.

MC

Memory Care Secured, specialized care for people living with Alzheimer's or dementia. Staff trained in cognitive impairment, with higher staff-to-resident ratios and an environment designed to reduce confusion and wandering risk.

Franklin 157 59.6% -18% 3.44 -38% -5% 0 35 8.8 5 92 A+ 72 Claiborne Group Llc $11.0M $4.1M 37.1% 445157
Canterfield of Franklin LLC -
NH

Nursing Home Licensed facility providing 24/7 skilled nursing care for residents with complex, ongoing medical needs. Staffed by RNs, LPNs, and CNAs. Inspected and star-rated annually by CMS. Accepts Medicare (short-term rehab) and Medicaid (long-term care).

AL

Assisted Living A licensed, long-term care setting for seniors or individuals with disabilities who need help with daily activities — like bathing, dressing, and medication management — but not 24-hour skilled nursing. Offers housing, meals, and around-the-clock support while aiming to maximize resident independence.

Franklin 99 - - - - - - - - 0 0 0.0 0 - - - - - - - -
Fountains of Franklin -
NH

Nursing Home Licensed facility providing 24/7 skilled nursing care for residents with complex, ongoing medical needs. Staffed by RNs, LPNs, and CNAs. Inspected and star-rated annually by CMS. Accepts Medicare (short-term rehab) and Medicaid (long-term care).

AL

Assisted Living A licensed, long-term care setting for seniors or individuals with disabilities who need help with daily activities — like bathing, dressing, and medication management — but not 24-hour skilled nursing. Offers housing, meals, and around-the-clock support while aiming to maximize resident independence.

Franklin 68 - - - - - - - - 0 0 0.0 0 - - - - - - - -
Franklin Manor Nursing Center -
NH

Nursing Home Licensed facility providing 24/7 skilled nursing care for residents with complex, ongoing medical needs. Staffed by RNs, LPNs, and CNAs. Inspected and star-rated annually by CMS. Accepts Medicare (short-term rehab) and Medicaid (long-term care).

AL

Assisted Living A licensed, long-term care setting for seniors or individuals with disabilities who need help with daily activities — like bathing, dressing, and medication management — but not 24-hour skilled nursing. Offers housing, meals, and around-the-clock support while aiming to maximize resident independence.

Franklin 47 - - - - - - - - 0 0 0.0 0 - - - - - - - -

Guides for Better Senior Living

Care Cost Calculator: See Prices in Your Area

Nursing Home Data Explorer

Don’t Wait Too Long: 7 Red Flag Signs Your Parent Needs Assisted Living Now

The True Cost of Assisted Living in 2025 – And How Families Are Paying For It

Understanding Senior Living Costs: Pricing Models, Discounts & Financial Assistance

Explore Open Rooms
1 Contact details
2 What type of senior care service are you looking for?
3 What budget do you have in mind for senior care?
4 How soon do you need to find care?
5 Additional details

Thank you for your interest!

Our team will be in touch shortly to help with next steps.