Explore Open Rooms

1 Contact details
2 What type of senior care service are you looking for?
3 What budget do you have in mind for senior care?
4 How soon do you need to find care?
5 Additional details

Thank you for your interest!

Our team will be in touch shortly to help with next steps.

Nursing Home in Poplar Bluff

CMS overall rating Info The Overall CMS Rating combines results from health inspections, staffing levels and quality measures. Health inspections carry the most weight. Staffing and quality scores can increase or decrease the final rating based on performance compared to state and national standards.

Clark’s Mountain

2100 Barnes St, Piedmont, MO 63957 View map
Overview of Clark’s Mountain

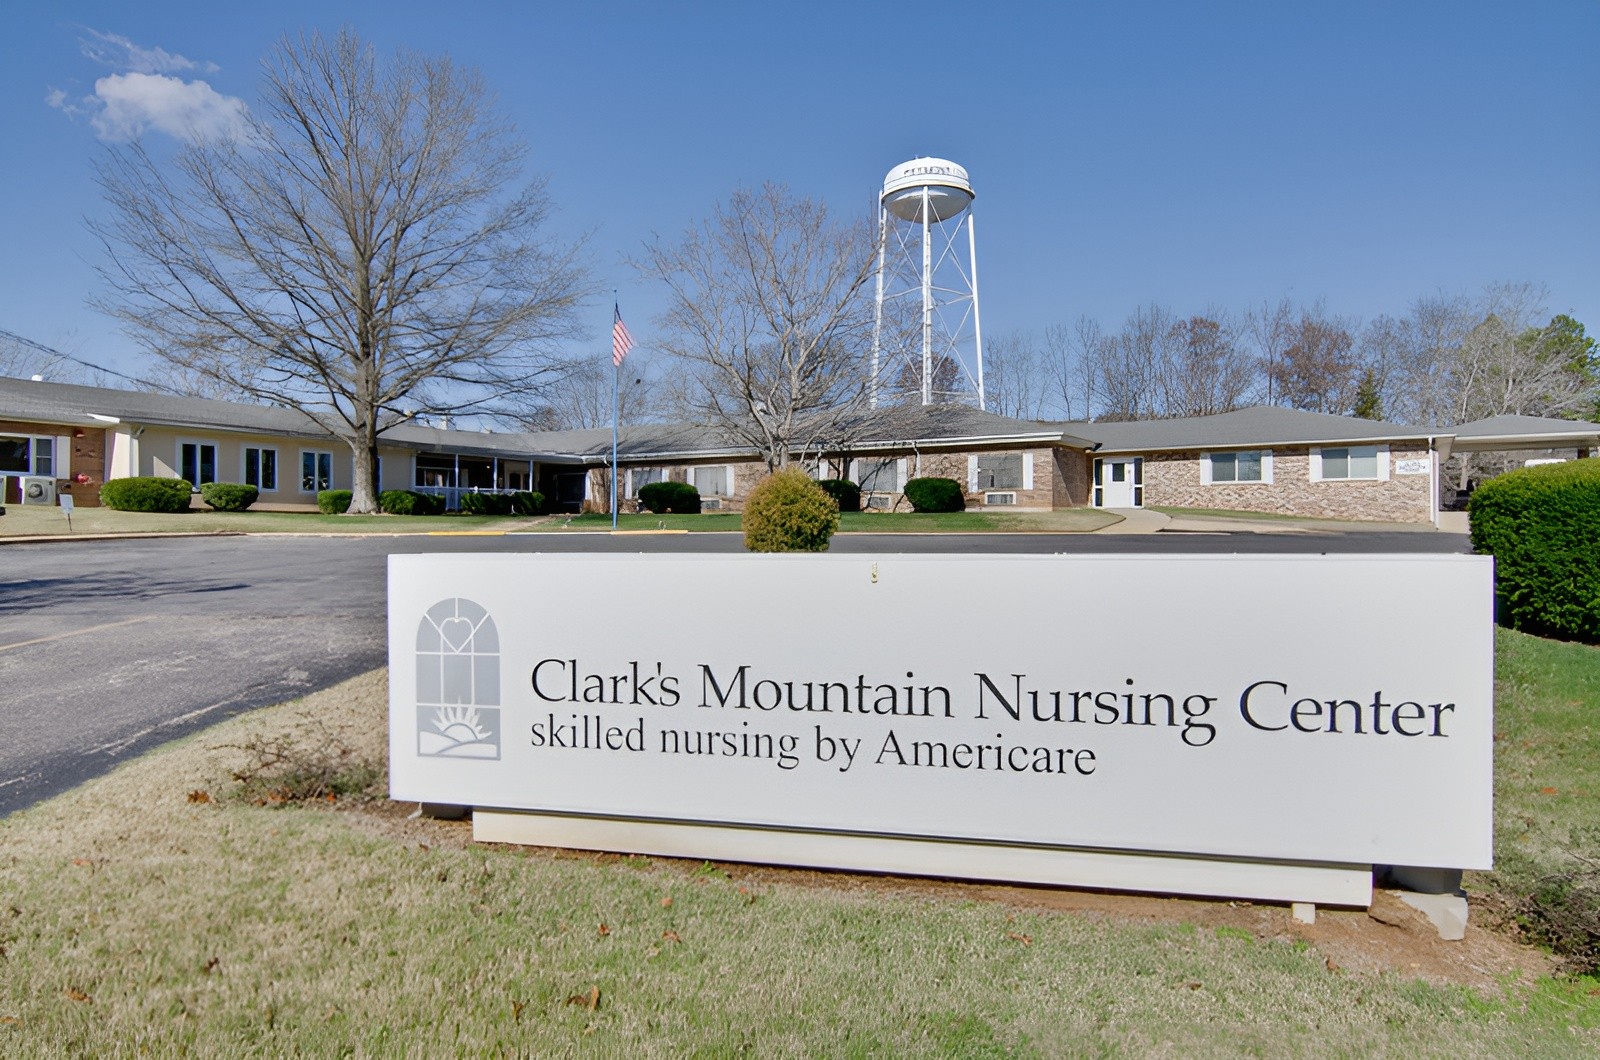
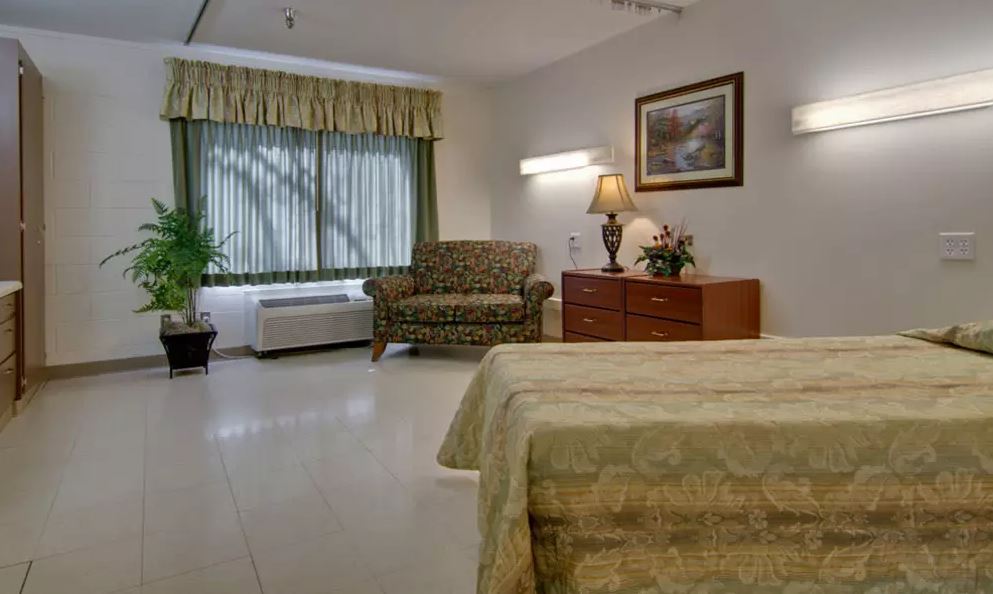
Bask in the warmth of Barnes Street, Piedmont, MO, with the blissful senior living community of Clark’s Mountain Nursing Center Skilled Nursing by Americare offering skilled nursing, hospice care, home health care, and rehabilitation. The community strives to provide a haven for seniors to keep their peace of mind with several studio floor plans, carefully designed for unparalleled comfort and safety. Flourish and let go of your worries with a team of compassionate and highly trained professionals providing top-notch care and support.

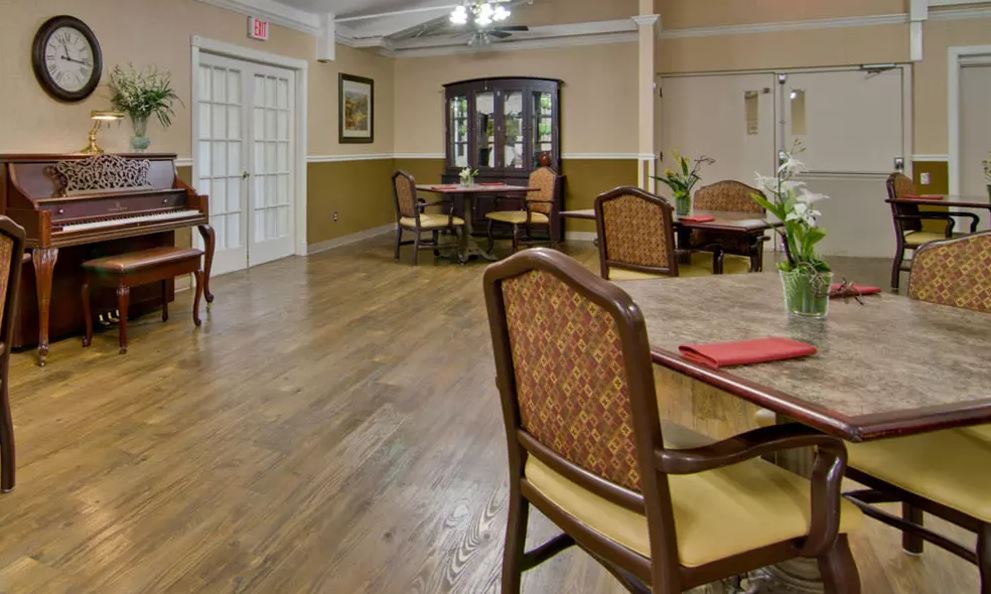
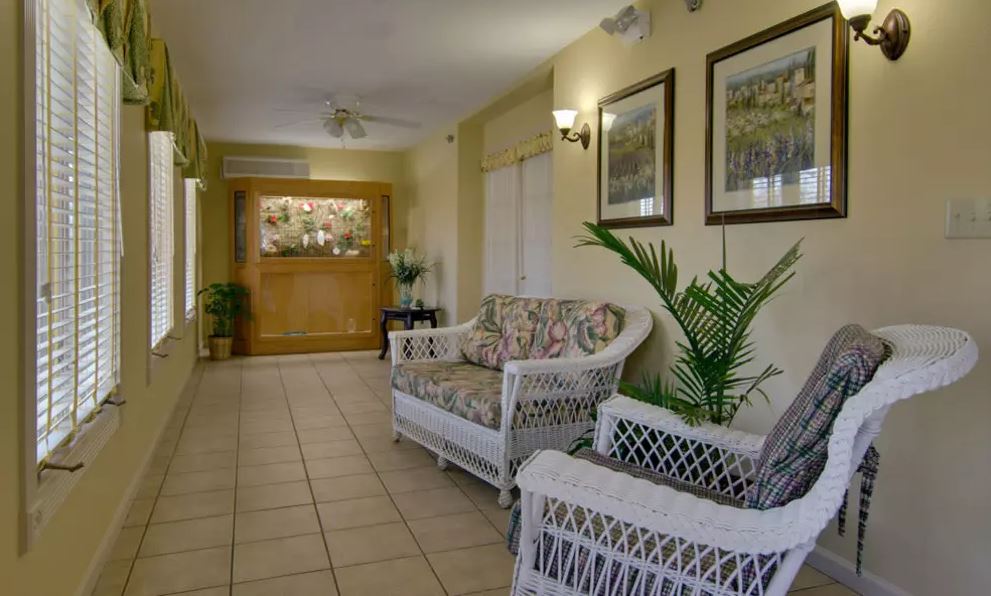
The community utilizes a holistic approach to ensure every aspect of residents’ well-being is well-cared for. Moreover, enjoyable activities and engaging programs accompany seniors as they strive to make the most out of their day. Enjoy mealtimes with friends and indulge in delicious and healthy dining options. Clark’s Mountain Nursing Center is a good place for seniors to spend their healing journey with its amazing amenities and exceptional quality.

(573) 223-4297

Quality ratings

Measured by Centers for Medicare & Medicaid Services (CMS)

Overall rating Info The Overall CMS Rating combines results from health inspections, staffing levels and quality measures. Health inspections carry the most weight. Staffing and quality scores can increase or decrease the final rating based on performance compared to state and national standards.
5/5
Missouri average: 2.5/5
Health Inspection Info Based on the results of the facility's three most recent standard inspections and any complaint investigations. CMS reviews the number, scope, and severity of deficiencies, with more recent findings weighted more heavily.
5/5
Missouri average: 2.8/5
Staffing Info Measures average nursing staff hours per resident per day, including Registered Nurses (RNs) and total nursing staff. Ratings are adjusted based on the level of care residents require and are compared to state and national benchmarks.
3/5
Missouri average: 2.2/5
Quality Measures Info Based on clinical and physical health indicators reported to CMS, such as hospital readmissions, falls, pressure ulcers, and improvements in mobility. These measures reflect how well residents' health needs are being managed.
2/5
Missouri average: 2.7/5

Nursing care per resident

Info This shows how many total hours of nursing staff time are available per resident each day. Higher numbers usually mean more staff support.
3h 56m per day

This home provides 5% more nursing time per resident than the Missouri average.

Missouri average: 3h 44m per day

Staffing hours breakdown

Info Hours of care per resident per day, broken down by staff type. Data from CMS Medicare.
Staff type Facility State avg National avg
Registered Nurse (RN) Info Registered nurse hours per resident per day. 24m per day 28m per day 41m per day
Nurse Aide Info Nurse aide hours per resident per day. 2h 44m per day 2h 20m per day 2h 21m per day
Total Nursing (Weekend) Info Total number of nurse staff hours per resident per day on weekends. 3h 12m per day 3h 3m per day 3h 26m per day
RN (Weekend) Info Registered nurse hours per resident per day on weekends. 12m per day 20m per day 29m per day

Capacity and availability

Smaller home

May offer a more intimate, personalized care environment.

Total beds 91

This home usually has availability

Lower occupancy suggests more openings may be available.

Lower demand than the Missouri average
Occupancy rate 61.7%
Residents per day (avg) 62
Occupancy rate
61.7%
Residents per day (avg)
62

Who this home usually serves

TYPE OF STAY

Mostly short-term rehab stays

Most residents typically stay for a few weeks or months before returning home or moving on.

Might be optimal for
Short stays Recovery Medicare-covered care

Breakdown by payment type

Medicare

43% of new residents, usually for short-term rehab.

Typical stay 1 - 2 months

Private pay

38% of new residents, often for short stays.

Typical stay 2 - 3 months

Medicaid

19% of new residents, often for long-term daily care.

Typical stay 1 - 2 years

Finances and operations

Privately-owned community
Operated by a partnership between two or more business owners.
Home revenue
$5.5M
Profit
$160.7K
Privately-owned community Operated by a partnership between two or more business owners.
Home revenue
$5,526,490.00
Profit
$160,666.00
Payroll costs Info The portion of the home's budget spent on staff, including nurses, caregivers, and other employees who support care and operations.
$2.7M
49.4% of revenue
Other operating costs Info All remaining costs needed to run the home, such as food, utilities, building maintenance, supplies and administrative expenses.
$2.6M
Total costs $5.4M

What does this home offer?

Pets allowed icon
Pets allowed icon

Pets Allowed: Yes, Pets Allowed

Room sizes icon
Room sizes icon

Room Sizes: 190 / 200 / 220 / 240

Housing options icon

Housing Options: Studio

Building type icon
Building type icon

Building Type: Single-story

Transportation services icon

Transportation Services

Fitness and recreation icon

Fitness and Recreation

Types of Care at Clark’s Mountain

Skilled Nursing Hospice Care
Contact Clark’s Mountain

Health Inspection History

Inspections
Total health inspections 2

Missouri average 6.6


Last Health inspection on Jan 2025

Total health citations 5

Missouri average 36.5

Citations per inspection
2.5

Missouri average 5.67


Health citations are formal notices following inspections when they fail to comply with safety and care standards.

All 5 citations resulted from standard inspections.

Breakdown of citation severity (last 3 years)
Critical Health citations More info 0
100% better than Missouri average

Missouri average: 0.7


Serious Health citations More info 0
100% better than Missouri average

Missouri average: 1

0 critical citations More info Missouri average: 0.7

0 serious citations More info Missouri average: 1

5 moderate citations More info Missouri average: 33.6

0 minor citations More info Missouri average: 1.2
Citations history (last 3 years)
Administration moderate citation Info Issues related to how the facility is managed, including policies, procedures, and compliance with regulations. Jan 31, 2025
Corrected

Infection Control moderate citation Info Issues related to preventing and controlling infections, including hygiene practices and safety protocols. Jan 31, 2025
Corrected

Nursing Services moderate citation Info Issues related to the availability and quality of nursing staff and the care they provide. Jan 31, 2025
Corrected

Nutrition moderate citation Info Issues related to food quality, meal service, and resident's nutritional needs. Dec 06, 2023
Corrected

Compare Nursing Homes around Poplar Bluff The information below is reported by the Missouri Department of Health and Senior Services, Division of Regulation and Licensure.

1 facility compared · CMS & MO Dept. of Health data · Updated Apr 2026

Filter by care type
Clark’s Mountain
HC

Home Care Professional care delivered in the person's own home — from companionship and errands to skilled nursing and therapy. Allows seniors to age in place. Medicare covers skilled home health when medically necessary.

NH

Nursing Home Licensed facility providing 24/7 skilled nursing care for residents with complex, ongoing medical needs. Staffed by RNs, LPNs, and CNAs. Inspected and star-rated annually by CMS. Accepts Medicare (short-term rehab) and Medicaid (long-term care).

Piedmont
91
61.7%
-7%
3.93
-11%
+5%
0
5
2.5
0
62
13
Turner, William
$5.5M
$2.7M
49.9%
265416
Studio

Places of interest near Clark’s Mountain

Address 49.4 miles from city center

Address 2100 Barnes St, Piedmont, MO 63957

Calculate Travel Distance to Clark’s Mountain

Add your location

Address

Staffing Data (Q2 2025)

This data corresponds to Q2 2025 and is based on CMS Payroll-Based Journal.

Total staff 100
Employees 88
Contractors 12
Staff to resident ratio 1.61:1
6% worse than Missouri average

Missouri average ratio: 1.71:1

Avg staff/day 42
Average shift 7.3 hours
10% worse than Missouri average

Missouri average: 8.1 hours

Total staff hours (quarter) 28,034
Nursing staff breakdown
Registered Nurse

Manages medical care and health needs.

Total count 7
Average shift length Info Average shift length. Calculated as total hours divided by days worked and average staff per day. 9.5 hours

No contractors work on this role.

Licensed Practical Nurse

Assists with medical care and medications.

Total count 10
Average shift length Info Average shift length. Calculated as total hours divided by days worked and average staff per day. 8.6 hours

No contractors work on this role.

Certified Nursing Assistant

Helps with daily care and mobility.

Total count 21
Average shift length Info Average shift length. Calculated as total hours divided by days worked and average staff per day. 7.3 hours

No contractors work on this role.

Contractor staffing

Total hours from contractors

5.4%

1,522 contractor hours this quarter

Qualified Social Worker: 3 Physical Therapy Aide: 2 Speech Language Pathologist: 2 Physical Therapy Assistant: 2 Respiratory Therapy Technician: 1 Occupational Therapy Aide: 1 Medical Director: 1
Staff by category
Certified Nursing Assistant210217,62191100%7.3
Nurse Aide in Training170174,46691100%6.7
Licensed Practical Nurse100103,42791100%8.6
Physical Therapist150153,37391100%6.3
Medication Aide/Technician100103,27091100%8.8
Registered Nurse7072,34891100%9.5
Dietitian5055627582%6.9
Administrator1015046369%8
Nurse Practitioner1014725965%8
Mental Health Service Worker1014695864%8.1
Physical Therapy Aide0224246571%5.8
Qualified Social Worker0333876571%5.7
Respiratory Therapy Technician0113516470%5.5
Speech Language Pathologist0222864246%6.8
Medical Director0113033%10
Physical Therapy Assistant022232325%1
Occupational Therapy Aide0112133%7
21 Certified Nursing Assistant
% of Days 100%
17 Nurse Aide in Training
% of Days 100%
10 Licensed Practical Nurse
% of Days 100%
15 Physical Therapist
% of Days 100%
10 Medication Aide/Technician
% of Days 100%
7 Registered Nurse
% of Days 100%
5 Dietitian
% of Days 82%
1 Administrator
% of Days 69%
1 Nurse Practitioner
% of Days 65%
1 Mental Health Service Worker
% of Days 64%
2 Physical Therapy Aide
% of Days 71%
3 Qualified Social Worker
% of Days 71%
1 Respiratory Therapy Technician
% of Days 70%
2 Speech Language Pathologist
% of Days 46%
1 Medical Director
% of Days 3%
2 Physical Therapy Assistant
% of Days 25%
1 Occupational Therapy Aide
% of Days 3%

Facility Characteristics

Source: CMS Long-Term Care Facility Characteristics (Data as of Jan 2026)

Total census
62 residents
Residents by payment source
Medicare
7 residents (11.3%)
Medicaid
44 residents (71%)
Private pay or other
11 residents (17.7%)
Programs & Services
Residents' Group

Residents meet regularly to discuss policies, care quality, and activities

Nurse Aide Training

State-approved Nurse Aide Training and Competency Evaluation Program on-site

Active Resident Council

Organized group of residents that meets regularly to discuss facility policies, quality of life, and activities.

Quality of care over time

These measures show how residents usually do over time at this home, based on health outcomes and preventive care.

High-risk clinical events score Info A composite score based on pressure ulcers, falls with injury, weight loss, walking ability decline, and activities of daily living decline. 9.0
17% better than Missouri average

Missouri average: 10.9

Functional decline score Info A composite score based on activities of daily living decline, walking ability decline, and incontinence. 13.4
31% better than Missouri average

Missouri average: 19.5

Long-stay resident measures
Average Missouri avg: 3.1 Info CMS star rating based on long-stay quality measure performance. 5 stars = significantly above average, 1 star = significantly below average.
Need for Help with Daily Activities Increased Info Percent of long-stay residents whose need for help with daily activities has increased 13.5%
32% better than Missouri average

Missouri average: 19.8%

Walking Ability Worsened Info Percent of long-stay residents whose ability to move independently worsened 11.9%
42% better than Missouri average

Missouri average: 20.6%

Low Risk Residents with Bowel/Bladder Incontinence Info Percent of low risk long-stay residents who lose control of their bowels or bladder 14.9%
18% better than Missouri average

Missouri average: 18.1%

Falls with Major Injury Info Percent of long-stay residents experiencing one or more falls with major injury 1.4%
66% better than Missouri average

Missouri average: 4.0%

High Risk Residents with Pressure Ulcers Info Percent of long-stay high risk residents with pressure ulcers 3.8%
25% better than Missouri average

Missouri average: 5.0%

Urinary Tract Infection Info Percent of long-stay residents with a urinary tract infection 3.9%
41% worse than Missouri average

Missouri average: 2.7%

Lost Too Much Weight Info Percent of long-stay residents who lose too much weight 14.6%
162% worse than Missouri average

Missouri average: 5.6%

Depressive Symptoms Info Percent of long-stay residents who have depressive symptoms 0.0%
100% better than Missouri average

Missouri average: 12.8%

Antipsychotic Use Info Percent of long-stay residents who received an antipsychotic medication 18.8%
15% better than Missouri average

Missouri average: 22.0%

Pneumococcal Vaccine Info Percent of long-stay residents assessed and appropriately given the pneumococcal vaccine 98.6%
16% better than Missouri average

Missouri average: 85.2%

Influenza Vaccine Info Percent of long-stay residents assessed and appropriately given the seasonal influenza vaccine 96.5%
6% better than Missouri average

Missouri average: 90.9%

Hospitalizations per 1,000 days Info Number of hospitalizations per 1,000 long-stay resident days. 3.58
72% worse than Missouri average

Missouri average: 2.08

ED visits per 1,000 days Info Number of outpatient emergency department visits per 1,000 long-stay resident days. 2.60
11% worse than Missouri average

Missouri average: 2.35

Short-stay resident measures
Above average Missouri avg: 2.6 Info CMS star rating based on short-stay quality measure performance. 5 stars = much above average, 1 star = much below average.
Pneumococcal Vaccine Info Percent of short-stay residents assessed and appropriately given the pneumococcal vaccine 96.0%
44% better than Missouri average

Missouri average: 66.6%

Antipsychotic medication increase Info Percent of short-stay residents who newly received an antipsychotic medication 1.1%
50% better than Missouri average

Missouri average: 2.2%

Influenza Vaccine Info Percent of short-stay residents assessed and appropriately given the seasonal influenza vaccine 92.9%
46% better than Missouri average

Missouri average: 63.5%

Re-hospitalized after SNF stay Info Percentage of short-stay residents who were re-hospitalized after their nursing home admission. 21.2%
16% better than Missouri average

Missouri average: 25.3%

Emergency department visits Info Percentage of short-stay residents who had an outpatient emergency department visit. 19.2%
43% worse than Missouri average

Missouri average: 13.4%

Falls with major injury Info Percentage of SNF residents who experience falls with major injury during their stay. 1.6%
109% worse than Missouri average

Missouri average: 0.8%

Ability to care for self at discharge Info Percentage of residents at or above expected ability to care for themselves at discharge. 32.5%
39% worse than Missouri average

Missouri average: 53.7%

Successful return to home or community Info Rate of successful return to home or community from a skilled nursing facility. 56.7%
12% better than Missouri average

Missouri average: 50.6%

Guides for Better Senior Living

Care Cost Calculator: See Prices in Your Area

Nursing Home Data Explorer

Don’t Wait Too Long: 7 Red Flag Signs Your Parent Needs Assisted Living Now

The True Cost of Assisted Living in 2025 – And How Families Are Paying For It

Understanding Senior Living Costs: Pricing Models, Discounts & Financial Assistance

Financial Aid for Missouri Seniors

Get financial aid guidance

Aged and Disabled Waiver

Missouri Medicaid A&D Waiver

Age 65+ or disabled, Missouri resident, Medicaid- eligible, nursing home-level care need.

~$2,829/month (300% FBR, individual).

$2,000 (individual), $3,000 (couple).

Rural access prioritized.

Missouri Supplemental Nursing Care (SNC)

MO SNC

Age 65+, Missouri resident, in approved facility.

~$1,215/month (individual).

$2,000 (individual).

Supplements SSI; facility-based only.

Structured Family Caregiving Waiver (SFCW)

Missouri Structured Family Caregiving Waiver

Age 65+, Missouri resident, MO HealthNet-eligible, NFLOC, dementia diagnosis, live with caregiver.

~$2,901/month (300% FBR, individual); QIT required.

$5,909.25 (individual), $11,818.45 (couple).

Caregiver must be family; small program size.

MO HealthNet Aged, Blind, and Disabled (ABD)

Missouri MO HealthNet ABD

Age 65+ or disabled, Missouri resident, MO HealthNet-eligible, needs help with 1+ ADL.

~$1,690/month (individual, projected); spenddown allowed.

$5,909.25 (individual), $11,818.45 (couple).

Less intensive than waivers; statewide access.

Medicare Savings Program (MSP)

Missouri Medicare Savings Program

Age 65+ or disabled, Missouri resident, Medicare Part A/B.

~$2,510/month (QMB), ~$3,380/month (SLMB), ~$3,598/month (QI)—individual.

$9,430 (individual), $14,130 (couple).

Three tiers; no waitlist; includes Extra Help for Part D.

Missouri Caregiver Program (Customized Caregiver Training & Relief)

Missouri Caregiver Program

Caregivers of 60+ with dementia, Missouri resident, functional needs (2+ ADLs).

No strict cap; prioritizes low-income (~$24,980/year individual).

Not assessed; need-based.

Administered via AAAs and Alzheimer’s Association; rural focus.

Senior Community Service Employment Program (SCSEP)

Missouri SCSEP

Age 55+, unemployed, low-income, Missouri resident.

~$1,983/month (125% FPL).

Not specified; income-focused.

Priority for veterans, rural residents; AARP partnership.

VA Aid and Attendance (A&A) and Housebound Benefits

Missouri VA Aid and Attendance/Housebound

Age 65+ or disabled veteran/spouse, Missouri resident, wartime service, need for ADL help (A&A) or homebound.

Net income < ~$1,984/month (veteran with dependent, A&A); pension offsets income.

~$155,356 (net worth limit).

High veteran demand in rural/urban areas.

Tour Icon
Planning a tour? Check our touring checklist.
Chat Icon
Thinking of living here? We can help you speak to a current resident