Collingswood Rehabilitation & Healthcare Center

Nursing Home

Collingswood Rehabilitation & Healthcare Center

299 Hurley Ave, Rockville, MD 20850 View Map
Nursing Home
icon
Care Cost Calculator: See Prices in Your Area Care Cost Calculator: See Prices in Your Area icon
Overview of Collingswood Rehabilitation & Healthcare Center

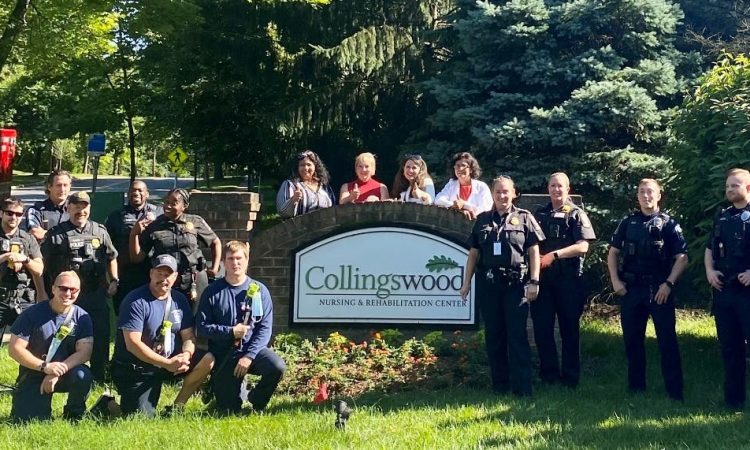
Situated in Rockville, Maryland, Collingswood Rehabilitation & Healthcare Center is committed to providing a full range of skilled nursing care for residents. Rehabilitative services aid in transitioning from hospital stays to home, bolstering strength and confidence through the guidance of expertly trained staff.

The team compassionately and tirelessly works 24/7 to ensure that residents’ comfort and well-being are the top priorities at Collingswood. Recently completed renovations bolster this, offering a modern and inviting facility. Amenities include a range of therapeutic programs, social and recreational activities to foster holistic recovery, engagement for nursing home seniors, and community at the center.

Managed by Titania El Bey

Administrator

20 years in long

Titania El Bey is the licensed nursing home administrator at Collingswood Rehabilitation & Healthcare Center. With 20 years of experience in long-term care and a Master of Science in Occupational Therapy, she is dedicated to improving residents’ quality of life and supporting clinical leaders. Titania focuses on enhancing customer service, professionalism, clinical outcomes, and addressing the cultural needs of the community.

Quality ratings

Measured by Centers for Medicare & Medicaid Services (CMS)

Overall rating Info Official CMS rating based on health inspections, staffing and quality measures.
1/5
Maryland average: 3.0/5
Health Inspection Info Official CMS rating based on deficiencies found during state health inspections.
1/5
Maryland average: 2.8/5
Staffing Info Official CMS rating based on nurse staffing hours per resident per day.
2/5
Maryland average: 3.0/5
Quality Measures Info Official CMS rating based on clinical outcomes for residents.
4/5
Maryland average: 3.7/5

Nursing care per resident

Info Average daily nursing hours per resident (adjusted for acuity). Higher values indicate more nursing time per resident.
2h 55m per day

This home provides 23% less nursing time per resident than the state average.

Maryland average: 3h 46m per day

Staffing hours breakdown

Info Hours of care per resident per day, broken down by staff type. Data from CMS Medicare.
Staff type Facility State avg National avg
Registered Nurse (RN) Info Registered nurse hours per resident per day. 41m per day 50m per day 41m per day
LPN / LVN Info Licensed Practical Nurse / Licensed Vocational Nurse hours per resident per day. 1h 5m per day 54m per day 52m per day
Nurse Aide Info Nurse aide hours per resident per day. 2h 21m per day 2h 10m per day 2h 21m per day
Total Nursing (Weekend) Info Total number of nurse staff hours per resident per day on weekends. 3h 28m per day 3h 29m per day 3h 26m per day
RN (Weekend) Info Registered nurse hours per resident per day on weekends. 21m per day 37m per day 29m per day

Capacity and availability

Medium-capacity home

Offers a balance of services and community atmosphere.

Total beds 160

This home usually has limited availability

Occupancy is moderate, suggesting balanced demand.

Similar demand to the Maryland average
Occupancy rate 92.6%
Residents per day (avg) 148
Occupancy rate
92.6%
Residents per day (avg)
148

Who this home usually serves

TYPE OF STAY

Mostly short-term rehab stays

Most residents typically stay for a few weeks or months before returning home or moving on.

Might be optimal for
Short stays Recovery Medicare-covered care

Breakdown by payment type

Medicare

55% of new residents, usually for short-term rehab.

Typical stay 1 - 2 months

Private pay

39% of new residents, often for short stays.

Typical stay 1 - 2 months

Medicaid

6% of new residents, often for long-term daily care.

Typical stay 2 - 3 years

Finances and operations

Proprietary home
Corporation
Home revenue
$25.7M
Operating loss
-$268.3K
Proprietary home Corporation
Home revenue
$25,660,516.00
Operating loss
$-268,346.00
Payroll costs Info The portion of the home's budget spent on staff, including nurses, caregivers, and other employees who support care and operations.
$9.3M
36.1% of revenue
Other operating costs Info All remaining costs needed to run the home, such as food, utilities, building maintenance, supplies and administrative expenses.
$16.7M
Total costs $25.9M
Walk Score
Walk Score: 43 / 100
Somewhat walkable. A few nearby services may be reachable on foot, but most trips require transportation.
BBB Rating
BBB Rating: A+ (Not Accredited)
An independent rating from the Better Business Bureau based on factors such as complaint history, transparency, and business practices.
How BBB ratings work

About this community

Additional licensing details

CMS Certification Number: 215092

Staffing

Key information about the people who lead and staff this community.

Leadership

Contact: Ms. Diana Pauciullo, Owner

Care Services

Nursing Services
Rehabilitation Services
Respite Care
Memory Care
Skilled Nursing
Licensed Nurses/CNAs
Short-Term Rehab

All Levels of Care

Subacute Rehab
Long Term Care
Memory Care.

Amenities & Lifestyle

Well-Appointed Patient Suites
Healthy Cuisine with a Variety of Menu Selections
Outdoor Deck & Patios
Beautiful Landscaping
Great Room with Fireplace
Bright & Airy Lounges with Flat Screen TVs
Complimentary WiFi & Cable
Housekeeping & Laundry
Beauty & Barber Services
Religious Services
Stimulating Recreation Activities
Local Trips & Outings.

Programs & Activities

Specific Programs
Subacute Rehab, Chronic Kidney Disease Management, Cardiopulmonary Rehabilitation, Long Term Care, Respite Care, Urgent SNF™ Service, Journeys Memory Care, Care Navigation, Family Matters Program, LifeLoop, Activities Calendar.
Religious Services
Yes

Dining & Nutrition

Food Description
Healthy cuisine with a variety of menu selections.
Meals Included
Yes

Compare Nursing Homes around Rockville

The information below is reported by the Maryland Department of Health, Office of Health Care Quality.
Collingswood Rehabilitation & Healthcare Center
N

Nursing

SNF

Nursing Homes 24/7 care needed

Rockville
160
No
A+
43
MANUFACTURERS & TRADERS TRUST COMPANY
92.6%
$25,153,796.00
$9,259,165.00
36.8%
148.10
1/5
2.9217
1/5
2/5
4/5
1
81
1
-13%
-23%
+12%

Places of interest near Collingswood Rehabilitation & Healthcare Center

Address 1.5 miles from city center — 1.23 miles to nearest hospital (Adventist HealthCare Shady Grove Medical Center)
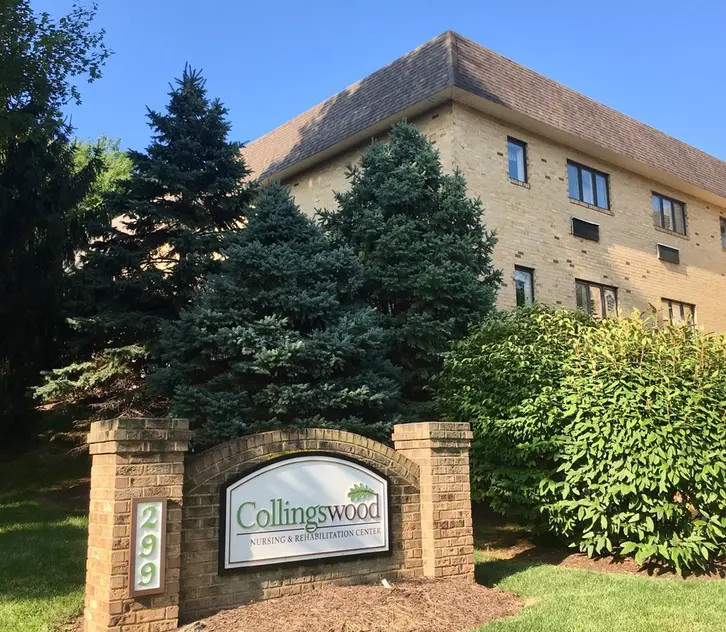
Address 299 Hurley Ave, Rockville, MD 20850

Calculate Travel Distance to Collingswood Rehabilitation & Healthcare Center

Add your location

Address

Staffing Data

Source: CMS Payroll-Based Journal (Q2 2025)

227
Total Staff
198
Employees
29
Contractors
67,766
Total Hours (Quarter)
94
Avg Staff/Day
7.9
Avg Shift (hrs)
Nursing Staff Breakdown
Role Count Avg Shift (hrs) Uses Contractors?
Registered Nurse267.7 Yes
Licensed Practical Nurse348.8 Yes
Certified Nursing Assistant907.5 No
Staff by Category
Administration
1 staff
8hs shift avg
Nursing Staff
164 staff
7.9hs shift avg
Physicians & Practitioners
10 staff
8hs shift avg
Therapy Services
17 staff
7.7hs shift avg
Activities & Recreation
22 staff
8.8hs shift avg
Social Services
3 staff
8.7hs shift avg
Dietary Services
7 staff
7.8hs shift avg
Other Services
3 staff
7.9hs shift avg
Contractor Analysis
6.2%
of total hours from contractors
4,179 contractor hours this quarter
Physical Therapy Aide: 2 Licensed Practical Nurse: 1 Registered Nurse: 8 Physical Therapy Assistant: 6 Qualified Social Worker: 3 Speech Language Pathologist: 3 Respiratory Therapy Technician: 6
Role Employees Contractors Total Staff Total Hours Days Worked % of Days Avg Shift (hrs)
Certified Nursing Assistant9009028,29291100%7.5
Licensed Practical Nurse3313412,93191100%8.8
Registered Nurse188265,60491100%7.7
Qualified Activities Professional220224,86791100%8.8
Clinical Nurse Specialist8083,6417279%8
Medication Aide/Technician110113,3809099%8.3
Other Dietary Services Staff6062,2668695%7.8
Mental Health Service Worker3031,0276470%7.9
Respiratory Therapy Technician0669568391%7.7
Physical Therapy Aide0228776571%7.8
Physical Therapy Assistant0667867684%7.4
RN Director of Nursing3037486369%7.5
Qualified Social Worker0335816268%8.7
Speech Language Pathologist0335006369%7.6
Administrator1014725965%8
Nurse Practitioner2024485662%8
Dietitian1013924954%8

Health Inspection History

Inspections
Total health inspections 5

Maryland average 3.9


Last Health inspection on Aug 2025

Total health citations 81
Citations per inspection
16.2

Health citations are formal notices following inspections when they fail to comply with safety and care standards.

62 of 81 citations resulted from standard inspections; and 19 of 81 resulted from complaint investigations.

Breakdown of citation severity (last 3 years)
Critical Health citations More info 1
100% worse than Maryland average

Maryland average: 0.5


Serious Health citations More info 0
100% better than Maryland average

Maryland average: 0.6

1 critical citation More info Maryland average: 0.5

0 serious citations More info Maryland average: 0.6

79 moderate citations More info Maryland average: 47.2

1 minor citation More info Maryland average: 1.7
Citations history (last 3 years)
Environmental moderate citation Aug 08, 2025
Corrected

Infection Control moderate citation Aug 08, 2025
Corrected

Infection Control moderate citation Aug 08, 2025
Corrected

Nursing Services moderate citation Aug 08, 2025
Corrected

Facility Characteristics

Source: CMS Long-Term Care Facility Characteristics (Data as of Jan 2026)

Ownership: For-Profit LLC
Part of: Marquis
Resident Census by Payment Source
151 Total Residents
Medicare 27 (17.9%)
Medicaid 89 (58.9%)
Private Pay/Other 35 (23.2%)
Specialized Care Beds
59 Total Specialty Beds
36.9% of Bed Capacity
39
Alzheimer's / Dementia Beds
24.4%
20
Ventilator Beds
12.5%
Programs & Services
Residents' Group
Family Engagement

Active councils help families stay involved in care decisions and facility operations.

Quality of care over time

These measures show how residents usually do over time at this home, based on health outcomes and preventive care.

High-risk clinical events score Info A composite score based on pressure ulcers, falls with injury, weight loss, walking ability decline, and activities of daily living decline. 19.8
53% worse than Maryland average

Maryland average: 12.9

Functional decline score Info A composite score based on activities of daily living decline, walking ability decline, and incontinence. 34.3
34% worse than Maryland average

Maryland average: 25.7

Long-stay resident measures
Need for Help with Daily Activities Increased Info Percent of long-stay residents whose need for help with daily activities has increased 37.6%
59% worse than Maryland average

Maryland average: 23.7%

Walking Ability Worsened Info Percent of long-stay residents whose ability to move independently worsened 39.8%
44% worse than Maryland average

Maryland average: 27.7%

Low Risk Residents with Bowel/Bladder Incontinence Info Percent of low risk long-stay residents who lose control of their bowels or bladder 25.6%
In line with Maryland average

Maryland average: 25.9%

Falls with Major Injury Info Percent of long-stay residents experiencing one or more falls with major injury 4.6%
103% worse than Maryland average

Maryland average: 2.3%

High Risk Residents with Pressure Ulcers Info Percent of long-stay high risk residents with pressure ulcers 7.4%
14% worse than Maryland average

Maryland average: 6.5%

Urinary Tract Infection Info Percent of long-stay residents with a urinary tract infection 0.6%
61% better than Maryland average

Maryland average: 1.6%

Lost Too Much Weight Info Percent of long-stay residents who lose too much weight 9.3%
61% worse than Maryland average

Maryland average: 5.8%

Depressive Symptoms Info Percent of long-stay residents who have depressive symptoms 94.2%
366% worse than Maryland average

Maryland average: 20.2%

Antipsychotic Use Info Percent of long-stay residents who received an antipsychotic medication 2.8%
79% better than Maryland average

Maryland average: 12.9%

Pneumococcal Vaccine Info Percent of long-stay residents assessed and appropriately given the pneumococcal vaccine 93.6%
In line with Maryland average

Maryland average: 92.0%

Influenza Vaccine Info Percent of long-stay residents assessed and appropriately given the seasonal influenza vaccine 96.4%
In line with Maryland average

Maryland average: 96.6%

Hospitalizations per 1,000 days Info Number of hospitalizations per 1,000 long-stay resident days. 1.58
20% worse than Maryland average

Maryland average: 1.32

ED visits per 1,000 days Info Number of outpatient emergency department visits per 1,000 long-stay resident days. 1.00
17% better than Maryland average

Maryland average: 1.21

Short-stay resident measures
Pneumococcal Vaccine Info Percent of short-stay residents assessed and appropriately given the pneumococcal vaccine 51.4%
35% worse than Maryland average

Maryland average: 78.4%

Antipsychotic medication increase Info Percent of short-stay residents who newly received an antipsychotic medication 0.6%
55% better than Maryland average

Maryland average: 1.4%

Influenza Vaccine Info Percent of short-stay residents assessed and appropriately given the seasonal influenza vaccine 48.3%
40% worse than Maryland average

Maryland average: 80.6%

Re-hospitalized after SNF stay Info Percentage of short-stay residents who were re-hospitalized after their nursing home admission. 20.8%
In line with Maryland average

Maryland average: 21.2%

Emergency department visits Info Percentage of short-stay residents who had an outpatient emergency department visit. 8.6%
13% better than Maryland average

Maryland average: 9.9%

Falls with major injury Info Percentage of SNF residents who experience falls with major injury during their stay. 1.6%
104% worse than Maryland average

Maryland average: 0.8%

Ability to care for self at discharge Info Percentage of residents at or above expected ability to care for themselves at discharge. 35.4%
34% worse than Maryland average

Maryland average: 53.7%

Successful return to home or community Info Rate of successful return to home or community from a skilled nursing facility. 55.4%
10% better than Maryland average

Maryland average: 50.6%

Guides for Better Senior Living

Care Cost Calculator: See Prices in Your Area

Nursing Home Data Explorer

Don’t Wait Too Long: 7 Red Flag Signs Your Parent Needs Assisted Living Now

The True Cost of Assisted Living in 2025 – And How Families Are Paying For It

Understanding Senior Living Costs: Pricing Models, Discounts & Financial Assistance

Financial Aid for Maryland Seniors

Get financial aid guidance

Community Options Waiver

Maryland Medicaid Community Options Waiver

Age 65+ or disabled, Maryland resident, Medicaid- eligible, nursing home-level care need.

~$2,829/month (300% FBR, individual).

$2,000 (individual), $3,000 (couple) (excludes home, car).

High urban demand; rural outreach efforts.

Senior Care Program

Maryland Senior Care

Age 65+, Maryland resident, at risk of nursing home placement.

~$2,000/month (individual, varies by county).

$11,000 (individual).

Limited funding; waitlists common in high-demand areas.

Maryland Nursing Home Medicaid

Maryland Medical Assistance (Medicaid) Nursing Home Program

Age 65+, Maryland resident, Medicaid-eligible, requires nursing home-level care.

$943/month (individual); most income applied to care costs.

$2,500 (individual), $3,000 (couple); spousal protections up to $155,356.

Home equity limit $636,000; estate recovery applies post-55.

Senior Assisted Living Subsidy Program

Maryland Senior Assisted Living Group Home Subsidy

Age 62+, Maryland resident, in or moving to approved assisted living, low/moderate income.

~$34,000/year (individual, varies by county).

Not strict; prioritizes low-income.

Not available statewide; facility must be licensed by MDH.

Veterans Aid and Attendance (A&A) Benefit

Maryland VA Aid and Attendance

Wartime veteran/spouse, age 65+ or disabled, needs ADL help, Maryland resident.

Net income minus medical expenses < $1,984/month (individual with A&A).

$155,356 (net worth limit).

High veteran population in suburban/rural areas.

Senior Prescription Drug Assistance Program (SPDAP)

Maryland Senior Prescription Drug Assistance Program

Age 65+, Maryland resident (6+ months), Medicare Part D enrolled.

$48,560/year (individual, 300% FPL).

None specified.

Supplements Medicare Part D; annual enrollment required.

Medicare Savings Programs (MSP)

Maryland Medicare Savings Programs

Age 65+, Maryland resident, Medicare Part A/B enrollee.

$2,014/month (QMB), $2,706/month (SLMB/QI, individual).

$9,090 (individual), $13,630 (couple).

Includes QMB, SLMB, QI categories.

Community Personal Assistance Services (CPAS)

Maryland Medicaid Community Personal Assistance Services

Age 65+, Maryland resident, Medicaid-eligible, needs ADL assistance.

$943/month (individual); spend-down available.

$2,500 (individual), $3,000 (couple).

Consumer-directed option allows hiring family caregivers.

Who we are

Your Senior Care Partner, Every Step of the Way

We help families find affordable senior communities and unlock same day discounts, Medicaid, and Medicare options tailored to your needs.

Contact us Today