Collingswood Rehabilitation & Healthcare Center
Nursing Home, Hospice Care, Memory Care, Palliative Care & Respite Care · Rockville, MD
CMS overall rating Info CMS (the Centers for Medicare & Medicaid Services) is the federal agency that rates nursing home quality. Its Overall Rating runs from 1 to 5 stars, combining health inspections, staffing, and quality measures, with inspections weighted most heavily.

Collingswood Rehabilitation & Healthcare Center

Nursing Home, Hospice Care, Memory Care, Palliative Care & Respite Care · Rockville, MD
CMS overall rating Info CMS (the Centers for Medicare & Medicaid Services) is the federal agency that rates nursing home quality. Its Overall Rating runs from 1 to 5 stars, combining health inspections, staffing, and quality measures, with inspections weighted most heavily.
Calculator: See prices in your area
Collingswood Rehabilitation & Healthcare Center accepts Medicare, Medicaid, and private pay.

Overview of Collingswood Rehabilitation & Healthcare Center

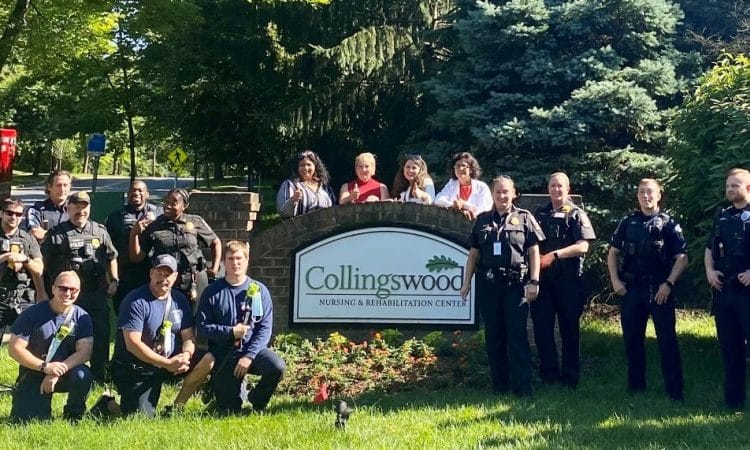
Situated in Rockville, Maryland, Collingswood Rehabilitation & Healthcare Center is committed to providing a full range of skilled nursing care for residents. Rehabilitative services aid in transitioning from hospital stays to home, bolstering strength and confidence through the guidance of expertly trained staff.

The team compassionately and tirelessly works 24/7 to ensure that residents’ comfort and well-being are the top priorities at Collingswood. Recently completed renovations bolster this, offering a modern and inviting facility. Amenities include a range of therapeutic programs, social and recreational activities to foster holistic recovery, engagement for nursing home seniors, and community at the center.

Quality ratings

Measured by Centers for Medicare & Medicaid Services (CMS)

Overall rating Info The Overall CMS Rating combines results from health inspections, staffing levels and quality measures. Health inspections carry the most weight. Staffing and quality scores can increase or decrease the final rating based on performance compared to state and national standards.
▼ 34.2% Below MD avg. ▼ 34.2% Below MD avg.MD average: 3.0Click the badge to see the full State ranking.Click here to see the full State ranking.
Health Inspection Info Based on the results of the facility's three most recent standard inspections and any complaint investigations. CMS reviews the number, scope, and severity of deficiencies, with more recent findings weighted more heavily.
▼ 29.0% Below MD avg. ▼ 29.0% Below MD avg.MD average: 2.8Click the badge to see the full State ranking.Click here to see the full State ranking.
Staffing Info Measures average nursing staff hours per resident per day, including Registered Nurses (RNs) and total nursing staff. Ratings are adjusted based on the level of care residents require and are compared to state and national benchmarks.
▼ 34.3% Below MD avg. ▼ 34.3% Below MD avg.MD average: 3.0Click the badge to see the full State ranking.Click here to see the full State ranking.
Quality Measures Info Based on clinical and physical health indicators reported to CMS, such as hospital readmissions, falls, pressure ulcers, and improvements in mobility. These measures reflect how well residents' health needs are being managed.
▲ 8.2% Above MD avg. ▲ 8.2% Above MD avg.MD average: 3.7Click the badge to see the full State ranking.Click here to see the full State ranking.

Staffing hours breakdown

Info Daily nursing hours per resident by staff type, reported to CMS. Higher is generally better — compare this facility to state and national averages to see where staffing stands.

Hours per resident per day — compared to Maryland state averages

Total nursing care / resident Info Total adjusted nursing hours per resident per day, combining RN, LPN, and aide time. CMS adjusts this for case-mix so facilities can be fairly compared.
2h 55m per day
This facility Maryland avg (3h 46m per day)
vs Maryland avg
-23%

3 of 6 metrics below state avg

Standout metric LPN / LVN is +24% above state avg
Staff typeHours / Day / Residentvs state avg
Registered Nurse (RN) Info RNs hold the highest nursing license and can assess residents, interpret test results, and direct care plans. More RN hours per day often signals stronger clinical oversight and faster response to health changes. 40m per day ▼ 21% State avg: 50m per day · National avg: 41m per day
LPN / LVN Info Licensed Practical Nurses (LPNs) or Licensed Vocational Nurses (LVNs) deliver routine hands-on care — medication administration, wound dressing, and monitoring vital signs. They work under RN supervision and make up a large share of daily bedside care. 1h 7m per day ▲ 24% State avg: 54m per day · National avg: 52m per day
Nurse Aide Info Certified Nurse Aides (CNAs) provide the most direct day-to-day assistance: bathing, dressing, feeding, and mobility. Nurse aide hours are typically the largest staffing category and directly affect residents' quality of life. 2h 20m per day ▲ 8% State avg: 2h 10m per day · National avg: 2h 21m per day
Weekend Total Nursing Info Combined nursing hours (RN + LPN + Nurse Aide) per resident per day on weekends. Staffing often drops on weekends — this figure reveals whether the facility maintains adequate coverage outside of weekday hours. 3h 28m per day ■ Avg State avg: 3h 29m per day · National avg: 3h 26m per day
Physical Therapist Info Hours per resident per day provided by licensed Physical Therapists (PTs) or PT Assistants. PT services help residents recover mobility after injury or illness and are especially important for post-acute (short-stay) rehabilitation. 4m per day ▼ 15% State avg: 5m per day · National avg: 4m per day
Weekend RN Info Registered nurse hours specifically on weekends. Facilities sometimes reduce RN presence on Saturdays and Sundays — a low weekend RN figure compared to weekday hours can indicate reduced clinical oversight when most administrative staff are absent. 19m per day ▼ 47% State avg: 37m per day · National avg: 29m per day

Capacity and availability

This home usually has limited availability

Higher occupancy than the Maryland average: 82.4%
Occupancy rate
92.6%
Avg. Length of Stay
93 days
Bed community size
160-bed community Rank #28 / 697Bed count — State benchmarkedThis home is ranked 28th out of 697 homes in Maryland. Shows this facility's certified or reported bed count compared to other Maryland facilities. Larger communities may offer more amenities, programs, and on-site services for residents and families.Rankings are based only on facilities in Maryland that report data for that category. Facilities without available data are excluded from the ranking.Click the rank badge to see the full State ranking.Click here to see the full State ranking.
A large-scale community that may provide a wide range of amenities, services, and structured programs.
Walk Score
Walk Score: 43 / 100 Rank #495 / 985Walk Score — State benchmarkedThis home is ranked 495th out of 985 homes in Maryland. Shows how walkable this facility's neighborhood is compared to the average Walk Score across Maryland facilities. Higher scores benefit residents, families, and staff.Rankings are based only on facilities in Maryland that report data for that category. Facilities without available data are excluded from the ranking.Click the rank badge to see the full State ranking.Click here to see the full State ranking.
Somewhat walkable. A few nearby services may be reachable on foot, but most trips require transportation.
BBB Rating
BBB Rating: A+ (Not Accredited)
An independent rating from the Better Business Bureau based on factors such as complaint history, transparency, and business practices.
How BBB ratings work

About this community

License Details

CMS Certification Number215092

Staffing

Key information about the people who lead and staff this community.

Leadership

ContactMs. Diana Pauciullo, Owner

Therapy & Rehabilitation

3 services
Rehabilitation Services
Respite Care
Short-Term Rehab

Additional Services

1 service
Subacute Rehab

Amenities & Lifestyle

Well-Appointed Patient Suites
Healthy Cuisine With A Variety Of Menu Selections
Outdoor Deck & Patios
Beautiful Landscaping
Great Room With Fireplace
Bright & Airy Lounges With Flat Screen Tvs
Complimentary Wifi & Cable
Housekeeping & Laundry
Beauty & Barber Services
Religious Services
Stimulating Recreation Activities
Local Trips & Outings
Specific ProgramsChronic Kidney Disease Management, Cardiopulmonary Rehabilitation, Urgent SNF™ Service, Journeys Memory Care, Care Navigation, Family Matters Program, LifeLoop
Religious Services

Dining & Nutrition

Food DescriptionHealthy cuisine with a variety of menu selections.

Contact Collingswood Rehabilitation & Healthcare Center

Inspection History

In Maryland, the Department of Health, Office of Health Care Quality is the state agency that conducts unannounced inspections and issues reports for all assisted living and nursing facilities.

Since 2019 · 7 years of data 52 citations

Inspection Scorecard Info This scorecard compares key inspection, citation, and complaint metrics at this facility against the Maryland state average. Metrics rated ≥15% worse than average are highlighted in red; those ≥15% better are highlighted in green.

Since 2019 vs. Maryland state average
Overall vs. MD average 2 Worse Metrics worse than Maryland average:
• Total citations (1200% above)
• Citations per year (1133% above)
0 Better No metrics in this bucket.
Latest Inspection August 8, 2025 Annual Inspection

Citations Info Citations are formal regulatory issues recorded during state inspections.

This FacilityMD Averagevs. MD Avg
Total citations Info Formal regulatory issues recorded by inspectors across all inspection types. 524 This facility has 1200% more total citations than a typical Maryland nursing home (52 vs. MD avg 4).↑ 1200% worse
Citations per year Info Average citations per year since 2019. 7.40.6 This facility has 1133% more citations per year than a typical Maryland nursing home (7.4 vs. MD avg 0.6).↑ 1133% worse

Inspection Reports Summary Info An editor-reviewed summary of the themes and findings across this facility's recent inspection reports.

  • August 8, 2025 annual inspection found 19 deficiencies including call bell delays, medication errors, infection control lapses, unsafe dementia unit supervision, and incomplete care plans.
  • May 15, 2025 complaint investigation identified 9 deficiencies including failure to provide wheelchairs, delayed abuse reporting, missed physician notifications, and inadequate care after falls.
  • August 23, 2022 complaint investigation revealed 14 deficiencies including unsafe environment, abuse protection failures, missing grievance reporting, inaccurate care plans, and medication administration errors.

Health Inspection History

Inspections since 2022
Total health inspections 5

Maryland average 3.9


Last Health inspection on Aug 2025

Total health citations
81 Rank #134 / 149Health citations — State benchmarkedThis home is ranked 134th out of 149 homes in Maryland. Shows this facility's total health deficiency citations benchmarked to the Maryland State average, with a ranking across all 149 MD facilities. Lower citation counts earn a better rank.Rankings are based only on facilities in Maryland that report data for that category. Facilities without available data are excluded from the ranking.Click the rank badge to see the full State ranking.Click here to see the full State ranking.

Maryland average 49.9

Citations per inspection
16.2

Maryland average 12.81


Health citations are formal notices following inspections when they fail to comply with safety and care standards.

62 of 81 citations resulted from standard inspections; and 19 of 81 resulted from complaint investigations.

Breakdown of citation severity (last 4 years)
Critical health citations
1
100% worse than Maryland average

Maryland average: 0.5


Serious health citations
0
100% better than Maryland average

Maryland average: 0.6

1 critical citation Maryland average: 0.5

0 serious citations Maryland average: 0.6

79 moderate citations Maryland average: 47.2

1 minor citation Maryland average: 1.7
Citations history (last 4 years)
Environmental moderate citation Aug 08, 2025
Corrected

Infection Control moderate citation Aug 08, 2025
Corrected

Infection Control moderate citation Aug 08, 2025
Corrected

Nursing Services moderate citation Aug 08, 2025
Corrected

Staffing Data

Reporting period: October 1 – December 31, 2025 (Q4 2025). Source: CMS Payroll-Based Journal report.

Total staff 224
Employees 198
Contractors 26
Staff to resident ratio 1.48 : 1
18% fewer staff per resident than Maryland average
Maryland average ratio: 1.81 : 1 Maryland average ratio: 1.81 : 1See full Maryland ranking
Avg staff/day 94
Average shift 7.8 hours
0% compared with Maryland average
Maryland average: 8 hours Maryland average shift: 8 hoursSee full Maryland ranking
Total staff hours (quarter) 67,194

Nursing staff breakdown

Q4 2025 · Oct 1 – Dec 31 More info This data comes from the CMS Payroll-Based Journal report covering October 1 – December 31, 2025.
Registered Nurse

Manages medical care and health needs.

RN Staff Info 29 total: 19 full-time employees and 10 contractors. 29
Average shift length Info Average shift length. Calculated as total hours divided by days worked and average staff per day. 7.7 hours
Licensed Practical Nurse

Assists with medical care and medications.

LPN Staff Info 37 total: 36 full-time employees and 1 contractor. 37
Average shift length Info Average shift length. Calculated as total hours divided by days worked and average staff per day. 8.4 hours
Certified Nursing Assistant

Helps with daily care and mobility.

CNA Staff Info All 88 CNA Staff are full-time employees. No contractors work on this role. 88
Average shift length Info Average shift length. Calculated as total hours divided by days worked and average staff per day. 7.3 hours

Contractor staffing

Q4 2025 · Oct 1 – Dec 31 More info This data comes from the CMS Payroll-Based Journal report covering October 1 – December 31, 2025.

Total hours from contractors

5.3%

3,592 contractor hours this quarter

Registered Nurse: 10 Respiratory Therapy Technician: 5 Physical Therapy Assistant: 4 Qualified Social Worker: 3 Physical Therapy Aide: 2 Licensed Practical Nurse: 1 Speech Language Pathologist: 1

Staff by category

Q4 2025 · Oct 1 – Dec 31 More info This data comes from the CMS Payroll-Based Journal report covering October 1 – December 31, 2025.
Certified Nursing Assistant8808827,75092100%7.3
Licensed Practical Nurse3613713,57392100%8.4
Registered Nurse1910295,03892100%7.7
Qualified Activities Professional220224,92292100%8.7
Medication Aide/Technician100103,88692100%8
Clinical Nurse Specialist8083,4448289%7.7
Other Dietary Services Staff5052,06592100%7.7
RN Director of Nursing3031,4806975%8
Respiratory Therapy Technician0559558087%7.6
Qualified Social Worker0337286975%8
Mental Health Service Worker4047156672%7.9
Physical Therapy Aide0226416470%7.5
Physical Therapy Assistant0445386571%7.7
Administrator1014645863%8
Speech Language Pathologist0114426166%7.2
Nurse Practitioner1014245358%8
Dietitian1011301718%7.6
88 Certified Nursing Assistant
% of Days 100%
37 Licensed Practical Nurse
% of Days 100%
29 Registered Nurse
% of Days 100%
22 Qualified Activities Professional
% of Days 100%
10 Medication Aide/Technician
% of Days 100%
8 Clinical Nurse Specialist
% of Days 89%
5 Other Dietary Services Staff
% of Days 100%
3 RN Director of Nursing
% of Days 75%
5 Respiratory Therapy Technician
% of Days 87%
3 Qualified Social Worker
% of Days 75%
4 Mental Health Service Worker
% of Days 72%
2 Physical Therapy Aide
% of Days 70%
4 Physical Therapy Assistant
% of Days 71%
1 Administrator
% of Days 63%
1 Speech Language Pathologist
% of Days 66%
1 Nurse Practitioner
% of Days 58%
1 Dietitian
% of Days 18%

Penalties and fines

Federal penalties imposed by CMS for regulatory violations, including civil money penalties (fines) and denials of payment for new Medicare/Medicaid admissions.

Source: CMS Penalties Database

No penalties in the past 3 years

No civil money penalties or payment denials were reported in the last 3 years.

Quality of care over time

These measures show how residents usually do over time at this home, based on health outcomes and preventive care.

High-risk clinical events score Info A composite score based on pressure ulcers, falls with injury, weight loss, walking ability decline, and activities of daily living decline. 19.8
53% worse than Maryland average

Maryland average: 12.9

Functional decline score Info A composite score based on activities of daily living decline, walking ability decline, and incontinence. 34.3
34% worse than Maryland average

Maryland average: 25.7

Long-stay resident measures
Average Maryland avg: 3.7 Info CMS star rating based on long-stay quality measure performance. 5 stars = significantly above average, 1 star = significantly below average.
Need for Help with Daily Activities Increased Info Percent of long-stay residents whose need for help with daily activities has increased 37.6%
59% worse than Maryland average

Maryland average: 23.7%

Walking Ability Worsened Info Percent of long-stay residents whose ability to move independently worsened 39.8%
44% worse than Maryland average

Maryland average: 27.7%

Low Risk Residents with Bowel/Bladder Incontinence Info Percent of low risk long-stay residents who lose control of their bowels or bladder 25.6%
In line with Maryland average

Maryland average: 25.9%

Falls with Major Injury Info Percent of long-stay residents experiencing one or more falls with major injury 4.6%
103% worse than Maryland average

Maryland average: 2.3%

High Risk Residents with Pressure Ulcers Info Percent of long-stay high risk residents with pressure ulcers 7.4%
14% worse than Maryland average

Maryland average: 6.5%

Urinary Tract Infection Info Percent of long-stay residents with a urinary tract infection 0.6%
61% better than Maryland average

Maryland average: 1.6%

Lost Too Much Weight Info Percent of long-stay residents who lose too much weight 9.3%
61% worse than Maryland average

Maryland average: 5.8%

Depressive Symptoms Info Percent of long-stay residents who have depressive symptoms 94.2%
366% worse than Maryland average

Maryland average: 20.2%

Antipsychotic Use Info Percent of long-stay residents who received an antipsychotic medication 2.8%
79% better than Maryland average

Maryland average: 12.9%

Pneumococcal Vaccine Info Percent of long-stay residents assessed and appropriately given the pneumococcal vaccine 93.6%
In line with Maryland average

Maryland average: 92.0%

Influenza Vaccine Info Percent of long-stay residents assessed and appropriately given the seasonal influenza vaccine 96.4%
In line with Maryland average

Maryland average: 96.6%

Hospitalizations per 1,000 days Info Number of hospitalizations per 1,000 long-stay resident days. 1.58
20% worse than Maryland average

Maryland average: 1.32

ED visits per 1,000 days Info Number of outpatient emergency department visits per 1,000 long-stay resident days. 1.00
17% better than Maryland average

Maryland average: 1.21

Short-stay resident measures
Average Maryland avg: 3.7 Info CMS star rating based on short-stay quality measure performance. 5 stars = much above average, 1 star = much below average.
Pneumococcal Vaccine Info Percent of short-stay residents assessed and appropriately given the pneumococcal vaccine 51.4%
35% worse than Maryland average

Maryland average: 78.4%

Antipsychotic medication increase Info Percent of short-stay residents who newly received an antipsychotic medication 0.6%
55% better than Maryland average

Maryland average: 1.4%

Influenza Vaccine Info Percent of short-stay residents assessed and appropriately given the seasonal influenza vaccine 48.3%
40% worse than Maryland average

Maryland average: 80.6%

Re-hospitalized after SNF stay Info Percentage of short-stay residents who were re-hospitalized after their nursing home admission. 20.8%
In line with Maryland average

Maryland average: 21.2%

Emergency department visits Info Percentage of short-stay residents who had an outpatient emergency department visit. 8.6%
13% better than Maryland average

Maryland average: 9.9%

Falls with major injury Info Percentage of SNF residents who experience falls with major injury during their stay. 1.6%
104% worse than Maryland average

Maryland average: 0.8%

Ability to care for self at discharge Info Percentage of residents at or above expected ability to care for themselves at discharge. 35.4%
34% worse than Maryland average

Maryland average: 53.7%

Successful return to home or community Info Rate of successful return to home or community from a skilled nursing facility. 55.4%
10% better than Maryland average

Maryland average: 50.6%

Breakdown by payment type

Medicare

55% of new residents, usually for short-term rehab.

Typical stay 1 - 2 months

Private pay

39% of new residents, often for short stays.

Typical stay 1 - 2 months

Medicaid

6% of new residents, often for long-term daily care.

Typical stay 2 - 3 years

Facility Characteristics

Source: CMS Long-Term Care Facility Characteristics (Data as of Jan 2026)

Total residents 151
Medicare
27
17.9% of residents
Medicaid
89
58.9% of residents
Private pay or other
35
23.2% of residents
Programs & Services
Residents Group

Residents meet regularly to discuss policies, care quality, and activities

Active Resident Council

Organized group of residents that meets regularly to discuss facility policies, quality of life, and activities.

Finances and operations

Based on CMS SNF Cost Report for fiscal year ending in 12/2023.

For-profit
Operated by a single business entity.
Net patient revenue Info Net patient revenue — what the home actually collects for resident care, after contractual allowances, bad debt and discounts are subtracted from its gross charges (CMS cost report, Worksheet G-3). It covers resident care only; money the home earns from other sources is shown separately as "Other income."
$23.1M
Net patient income Info Net patient income: net patient revenue minus the home's total operating expenses. A positive figure means it earns more from resident care than it spends to deliver it; a negative figure means the opposite. It excludes non-operating "other income."
-$775.1K
For-profit Operated by a single business entity.
Net patient revenue Info Net patient revenue — what the home actually collects for resident care, after contractual allowances, bad debt and discounts are subtracted from its gross charges (CMS cost report, Worksheet G-3). It covers resident care only; money the home earns from other sources is shown separately as "Other income."
$23.1M
Net patient income Info Net patient income: net patient revenue minus the home's total operating expenses. A positive figure means it earns more from resident care than it spends to deliver it; a negative figure means the opposite. It excludes non-operating "other income."
-$775.1K
Other income Info Money the home earns outside of resident care — such as investments, grants, rentals and other non-operating sources (CMS cost report, Worksheet G-3). It is tracked separately from net patient revenue: it is not part of that figure, and it is not included in net patient income.
$506.7K
Payroll costs Info Staff salaries plus wage-related costs — benefits such as payroll taxes, health insurance and retirement — from the home's own accounting records (CMS cost report, Worksheet A). Contract or agency labor is counted separately, under other operating costs.
$10.3M 44.7% of net patient revenue Info Payroll as a share of revenue: staff salaries and wage-related benefits divided by net patient revenue. A higher figure means more of each revenue dollar goes to staff pay. Rank #71 / 148Payroll % — State benchmarkedThis home is ranked 71st out of 148 homes in Maryland. Shows payroll as a percentage of revenue versus the Maryland average. Well-run Maryland facilities typically land around 49–57% — the top third Statewide. Below 25% may signal understaffing or heavy agency use — read with Staffing ratings.Rankings are based only on facilities in Maryland that report data for that category. Facilities without available data are excluded from the ranking.Click the rank badge to see the full State ranking.Click here to see the full State ranking.
Other operating costs Info Everything it costs to run the home apart from payroll — food, utilities, supplies, maintenance, contract labor and administration. Calculated as total operating expense minus payroll (staff salaries and wage-related benefits).
$13.5M
Total costs Info The home's total operating expense for the year — all the costs of running it, salaries included (CMS cost report, Worksheet G-3).
$23.8M

Who this home usually serves

TYPE OF STAY

Mostly short-term rehab stays

Most residents typically stay for a few weeks or months before returning home or moving on.

Most new residents arrive under Medicare (55% of admissions), and a typical Medicare stay runs around 1 - 2 months.

Admissions
581 total

Coverage residents most often arrive under.

Medicare 55%
Private pay 39%
Medicaid 6%
Discharges
584 total

Coverage residents most often leave under.

Medicare 42%
Private pay 42%
Medicaid 16%

Managed by Titania El Bey

Administrator

20 years of experience

Titania El Bey is the licensed nursing home administrator at Collingswood Rehabilitation & Healthcare Center. With 20 years of experience in long-term care and a Master of Science in Occupational Therapy, she is dedicated to improving residents’ quality of life and supporting clinical leaders. Titania focuses on enhancing customer service, professionalism, clinical outcomes, and addressing the cultural needs of the community.

Places of interest near Collingswood Rehabilitation & Healthcare Center

Address 1.5 miles from city center Info Estimated distance in miles from Rockville's city center to Collingswood Rehabilitation & Healthcare Center's address, calculated via Google Maps. — 1.23 miles to nearest hospital (Adventist HealthCare Shady Grove Medical Center)

Calculate Travel Distance to Collingswood Rehabilitation & Healthcare Center

Add your location

Address

Compare Nursing Homes around Rockville

The information below is reported by the Maryland Department of Health, Office of Health Care Quality.

5 facilities compared · CMS & MD Dept. of Health data

Tuckerman Rehabilitation & Healthcare Center
NH
NC
PC
RC
Rockville
41
Facility 41
MD AVG 43
Rank #238 / 697
83.2% +1%2.88 +43%-24%$0
23
Facility 23
MD AVG 49.9
Rank #21 / 149
4.6-37-
39
Facility 39
MD AVG 43
Rank #534 / 985
Calanthia Green$4.7M$2.0M
41.8%
Facility 41.8%
MD AVG 38.5%
Rank #88 / 148
215320
Ingleside at King Farm
NH
AL
IL
MC
Rockville (King Farm)
45
Facility 45
MD AVG 43
Rank #233 / 697
92.2% +12%6.36 +5%+68%$0168.0-33-
73
Facility 73
MD AVG 43
Rank #152 / 985
Westminster Ingleside King Farm Retirement Communities Inc$44.3M$14.8M33.4%215353
Revitz House
NH
AL
HC
IL
MC
Rockville
558
Facility 558
MD AVG 43
Rank #1 / 697
69.4% -16%3.91 -37%+4%$0
25
Facility 25
MD AVG 49.9
Rank #25 / 149
8.3-378-
81
Facility 81
MD AVG 43
Rank #86 / 985
Alison Baraf$57.8M$42.1M
72.9%
Facility 72.9%
MD AVG 38.5%
Rank #41 / 148
215071
Village at Rockville
NH
AL
HC
IL
MC
NC
RC
Rockville
57
Facility 57
MD AVG 43
Rank #213 / 697
77.3% -6%4.01 -5%+6%$17.3k
38
Facility 38
MD AVG 49.9
Rank #66 / 149
12.72131-
94
Facility 94
MD AVG 43
Rank #9 / 985
Kyle Hreben$35.0M$16.6M
47.4%
Facility 47.4%
MD AVG 38.5%
Rank #122 / 148
215125
Collingswood Rehabilitation & Healthcare Center
NH
HC
MC
PC
RC
Rockville (Hurley Avenue)
160
Facility 160
MD AVG 43
Rank #28 / 697
92.6% +12%2.92 -6%-23%$0
81
Facility 81
MD AVG 49.9
Rank #134 / 149
16.21147A+
43
Facility 43
MD AVG 43
Rank #495 / 985
Manufacturers & Traders Trust Company$23.1M$10.3M
44.7%
Facility 44.7%
MD AVG 38.5%
Rank #71 / 148
215092

Financial Assistance for
Nursing Home in Maryland

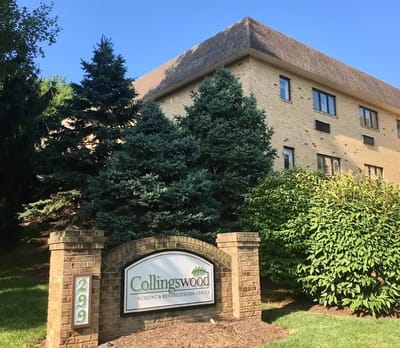
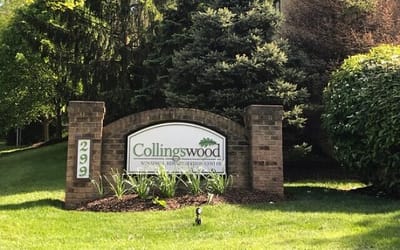
Collingswood Rehabilitation & Healthcare Center is located in Rockville, Maryland.
Here are the financial assistance programs available to residents in Maryland.

Get Financial aid guidance

Community Options Waiver

Maryland Medicaid Community Options Waiver

Age 65+ or disabled
General Maryland resident, Medicaid- eligible, nursing home-level care need.
Income Limits (2025) ~$2,829/month 300% FBR, individual
Asset Limits $2,000 (individual), $3,000 (couple) (excludes home, car).
MD

High urban demand; rural outreach efforts.

Benefits
Personal care (5-7 hours/day, e.g., bathing, dressing) Respite care (up to 240 hours/year) Adult day care ($70/day) Home modifications ($1,500 avg.)

Senior Care Program

Maryland Senior Care

Age 65+
General Maryland resident, at risk of nursing home placement.
Income Limits ~$2,000/month individual, varies by county
Asset Limits $11,000 individual
MD

Limited funding; waitlists common in high-demand areas.

Benefits
In-home care (3-5 hours/week) Respite care (up to 10 days/year) Meals (~$6/meal) Transportation (~5 trips/month) Case management

Maryland Nursing Home Medicaid

Maryland Medical Assistance (Medicaid) Nursing Home Program

Age 65+
General Maryland resident, Medicaid-eligible, requires nursing home-level care.
Income Limits (2025) $943/month (individual); most income applied to care costs.
Asset Limits $2,500 (individual), $3,000 (couple); spousal protections up to $155,356.
MD

Home equity limit $636,000; estate recovery applies post-55.

Benefits
24/7 nursing care Meals Therapy Medications (unlimited per medical need)

Senior Assisted Living Subsidy Program

Maryland Senior Assisted Living Group Home Subsidy

Age 62+
General Maryland resident, in or moving to approved assisted living, low/moderate income.
Income Limits (2025) ~$34,000/year individual, varies by county
Asset Limits Not strict; prioritizes low-income.
MD

Not available statewide; facility must be licensed by MDH.

Benefits
Personal care Meals 24-hour supervision (up to $1,500/month subsidy typical)

Veterans Aid and Attendance (A&A) Benefit

Maryland VA Aid and Attendance

Age
General Wartime veteran/spouse, age 65+ or disabled, needs ADL help, Maryland resident.
Income Limits (2025) Net income minus medical expenses < $1,984/month individual with A&A
Asset Limits $155,356 net worth limit
MD

High veteran population in suburban/rural areas.

Benefits
Cash benefit ($1,478-$2,471/month, varies by status) for care costs

Senior Prescription Drug Assistance Program (SPDAP)

Maryland Senior Prescription Drug Assistance Program

Age 65+
General Maryland resident (6+ months), Medicare Part D enrolled.
Income Limits (2025) $48,560/year individual, 300% FPL
Asset Limits None specified.
MD

Supplements Medicare Part D; annual enrollment required.

Benefits
Up to $40/month premium subsidy Reducing drug costs

Medicare Savings Programs (MSP)

Maryland Medicare Savings Programs

Age 65+
General Maryland resident, Medicare Part A/B enrollee.
Income Limits (2025) $2,014/month (QMB), $2,706/month (SLMB/QI, individual).
Asset Limits $9,090 (individual), $13,630 (couple).
MD

Includes QMB, SLMB, QI categories.

Benefits
Covers premiums (up to $174.70/month Part B) Co-pays Deductibles

Community Personal Assistance Services (CPAS)

Maryland Medicaid Community Personal Assistance Services

Age 65+
General Maryland resident, Medicaid-eligible, needs ADL assistance.
Income Limits (2025) $943/month (individual); spend-down available.
Asset Limits $2,500 (individual), $3,000 (couple).
MD

Consumer-directed option allows hiring family caregivers.

Benefits
Personal care (hours vary, typically 20-30/week) Chores Nurse supervision

Frequently Asked Questions about Collingswood Rehabilitation & Healthcare Center

What neighborhood is Collingswood Rehabilitation & Healthcare Center in?

Collingswood Rehabilitation & Healthcare Center is in the Hurley Avenue neighborhood of Rockville.

Is Collingswood Rehabilitation & Healthcare Center in a walkable area?

Collingswood Rehabilitation & Healthcare Center has a walk score of 43. Somewhat walkable. A few nearby services may be reachable on foot, but most trips require transportation.

What is the occupancy rate at Collingswood Rehabilitation & Healthcare Center?

Collingswood Rehabilitation & Healthcare Center's occupancy is 92.6%.

Does Collingswood Rehabilitation & Healthcare Center operate as a for-profit or non-profit?

Collingswood Rehabilitation & Healthcare Center is registered as a for-profit in MD.

Are there photos of Collingswood Rehabilitation & Healthcare Center?

Yes — there are 3 photos of Collingswood Rehabilitation & Healthcare Center in the photo gallery on this page.

What is the address of Collingswood Rehabilitation & Healthcare Center?

Collingswood Rehabilitation & Healthcare Center is located at 299 Hurley Ave, Rockville, MD 20850.

What is the phone number of Collingswood Rehabilitation & Healthcare Center?

(301) 762-8900 will put you in contact with the team at Collingswood Rehabilitation & Healthcare Center.

Guides for Better Senior Living

Care Cost Calculator: See Prices in Your Area

Nursing Home Data Explorer

Don’t Wait Too Long: 7 Red Flag Signs Your Parent Needs Assisted Living Now

The True Cost of Assisted Living in 2025 – And How Families Are Paying For It

Understanding Senior Living Costs: Pricing Models, Discounts & Financial Assistance