


Complete Care at Silverwoods
Assisted Living & Independent Living · Toms River, NJ

Complete Care at Silverwoods
Assisted Living & Independent Living · Toms River, NJ
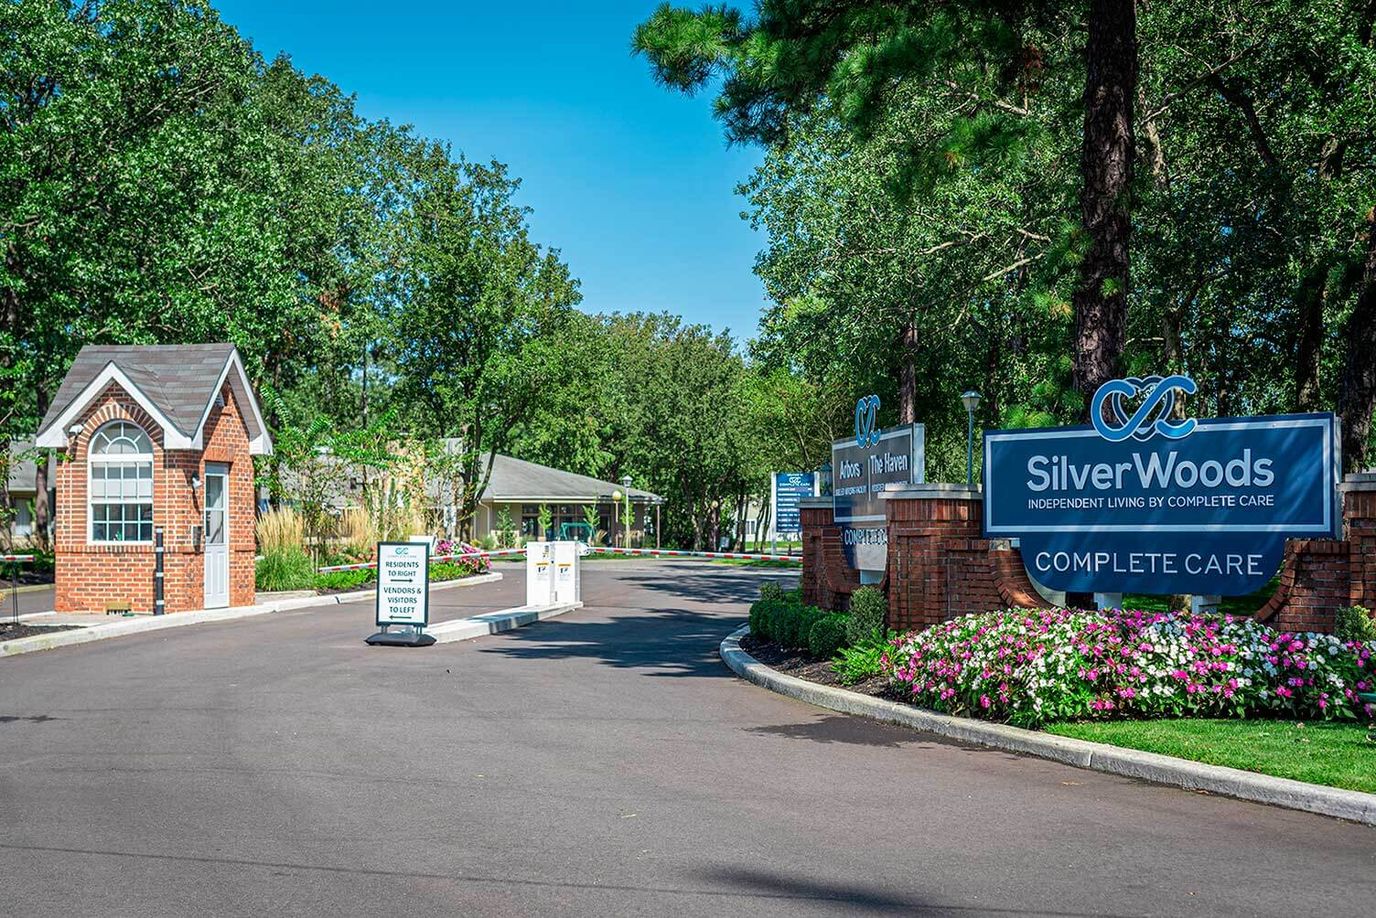
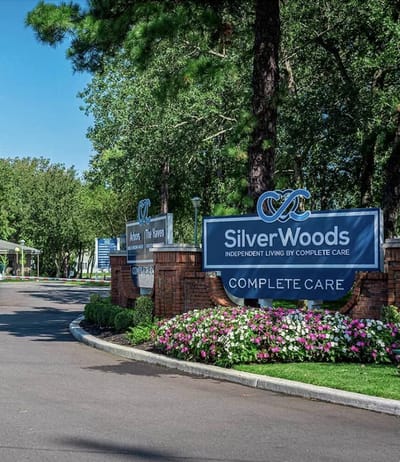
Complete Care at Silverwoods is located at 1700 NJ-37 W in the Pine Lake Park area of Toms River, about 8 miles out from the city center. It’s a 120-bed campus that mixes nursing home care with independent living. Right now, there are 109 residents, putting their occupancy at about 83.6%.
The average length of stay is 73 days, which suggests a steady stream of folks coming in for short-term rehab while others settle in longer-term. If you’re crunching the numbers on staffing, they provide 3 hours of total nursing care per resident, per day, with about 37 minutes of that coming from a registered nurse. That 3-hour total is on the lower end of the spectrum, so that’s worth factoring into any decision-making process.
The facility is CMS-certified and takes Medicare, Medicaid, and private pay. One thing that stands out from a structural perspective is the Active Resident Council; it gives people living there a real, formalized way to participate in decisions and raise concerns. The neighborhood has a Walk Score of 37, which is a pragmatic way of saying you’re definitely going to need a car or some form of arranged transport for errands.
Essentially, if you’re in Ocean County and evaluating options that combine skilled nursing, post-acute rehab, and independent living, and you need to utilize Medicare or Medicaid, this is a facility to keep on your radar as a functional, multi-service option.
Walk Score: 37 / 100 Rank #387 / 638Walk Score — State benchmarkedThis home is ranked 387th out of 638 homes in New Jersey for walk score. Shows how walkable this facility's neighborhood is compared to the average walk score across New Jersey facilities. Higher scores benefit residents, families, and staff.Facilities with the same value for a metric share the same rank. Rankings are based only on facilities in New Jersey that report data for that category. Facilities without available data are excluded from the ranking.Click the rank badge to see the full State ranking.Click here to see the full State ranking.
Somewhat walkable. A few nearby services may be reachable on foot, but most trips require transportation.
Matterport
Experience a digital walkthrough
Loading tour...
Places of interest near Complete Care at Silverwoods
![]() 4.9 miles from city center
4.9 miles from city center
![]() Estimated distance in miles from Toms River's city center to Complete Care at Silverwoods's address, calculated via Google Maps.
Estimated distance in miles from Toms River's city center to Complete Care at Silverwoods's address, calculated via Google Maps.
Calculate Travel Distance to Complete Care at Silverwoods
Add your location
Financial Assistance for
Assisted Living in New Jersey
Complete Care at Silverwoods is located in Toms River, New Jersey.
Here are the financial assistance programs available to residents in New Jersey.
Frequently Asked Questions about Complete Care at Silverwoods
What neighborhood is Complete Care at Silverwoods in?
Complete Care at Silverwoods is in the Pine Lake Park neighborhood of Toms River.
Is Complete Care at Silverwoods in a walkable area?
Complete Care at Silverwoods has a walk score of 37. Somewhat walkable. A few nearby services may be reachable on foot, but most trips require transportation.
Are pets allowed at Complete Care at Silverwoods?
No, Complete Care at Silverwoods has a no-pet policy.
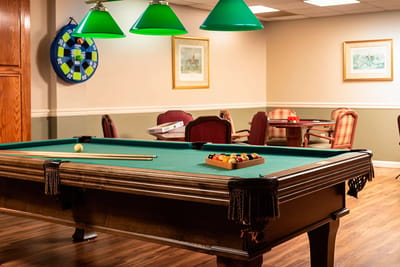
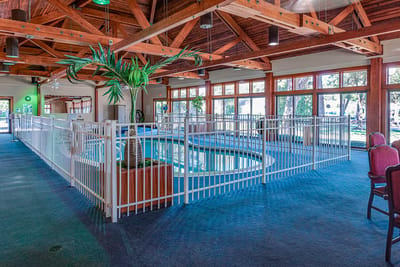
Are there photos of Complete Care at Silverwoods?
Yes — there are 6 photos of Complete Care at Silverwoods in the photo gallery on this page.
What is the address of Complete Care at Silverwoods?
Complete Care at Silverwoods is located at 1700 Nj 37 W, Toms River, NJ 08757.
What is the phone number of Complete Care at Silverwoods?
(732) 341-6630 will put you in contact with the team at Complete Care at Silverwoods.
Does Complete Care at Silverwoods provide medical or personal care assistance?
No — Complete Care at Silverwoods is an independent living community. Residents live on their own in private apartments with access to amenities, dining, and social activities.
Guides for Better Senior Living
Care Cost Calculator: See Prices in Your Area
Assisted Living Explorer
Don’t Wait Too Long: 7 Red Flag Signs Your Parent Needs Assisted Living Now
The True Cost of Assisted Living in 2025 – And How Families Are Paying For It
Understanding Senior Living Costs: Pricing Models, Discounts & Financial Assistance
Updated on
