Nursing Home

Conway Lakes Health & Rehabilitation

Nursing Home

Conway Lakes Health & Rehabilitation

5201 Curry Ford Rd, Orlando, FL 32812 View map
Overview of Conway Lakes Health & Rehabilitation

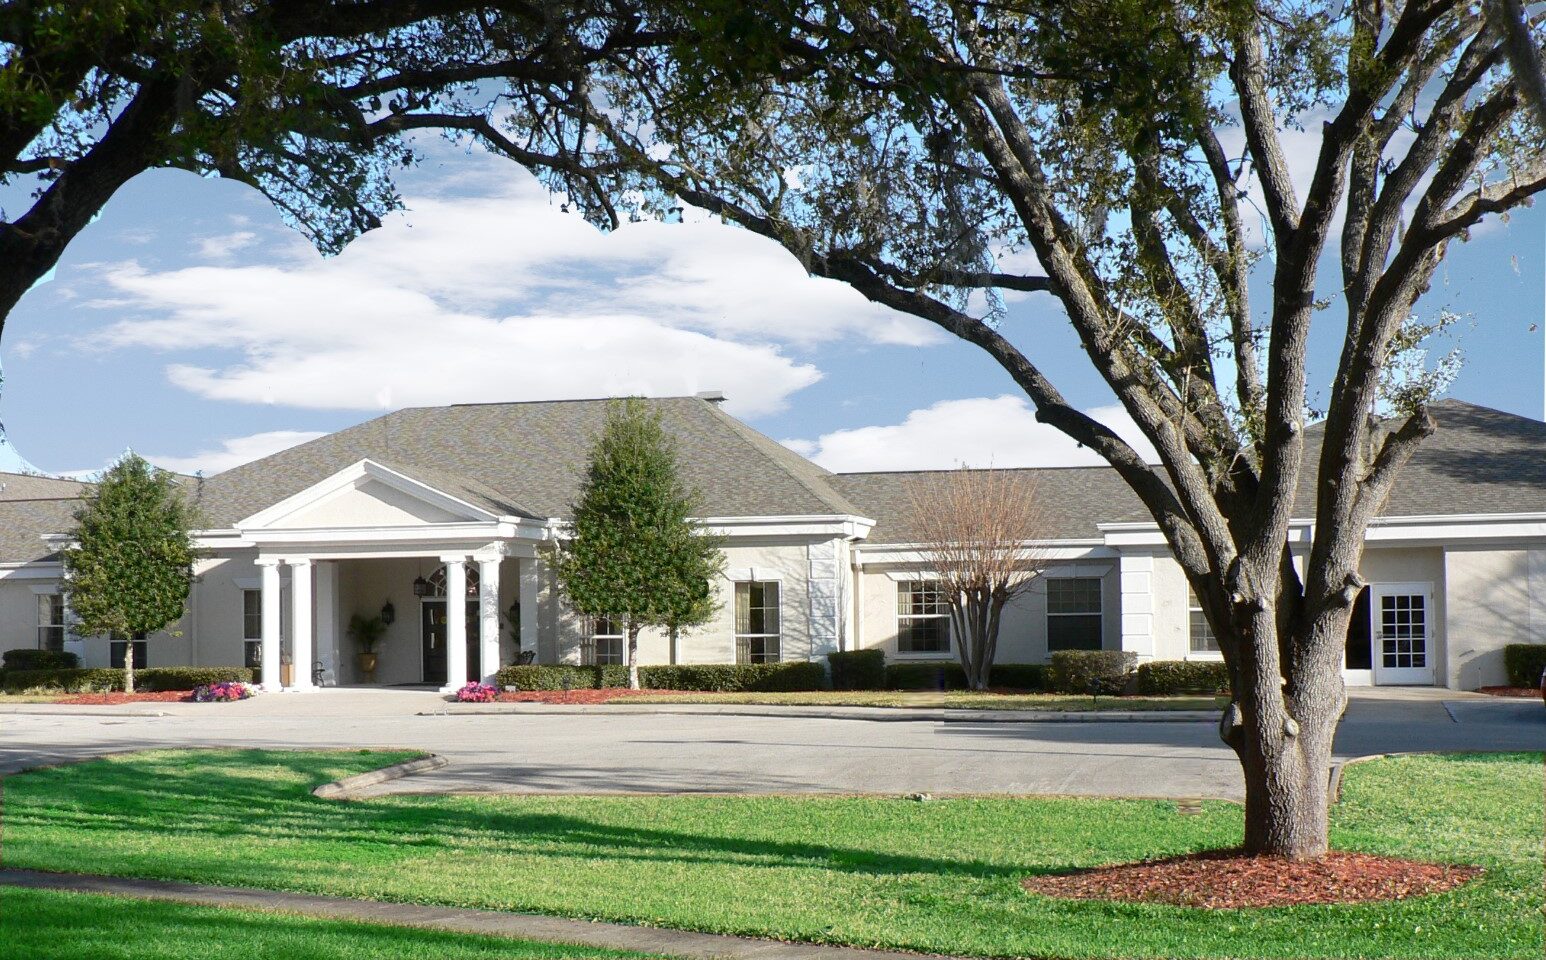
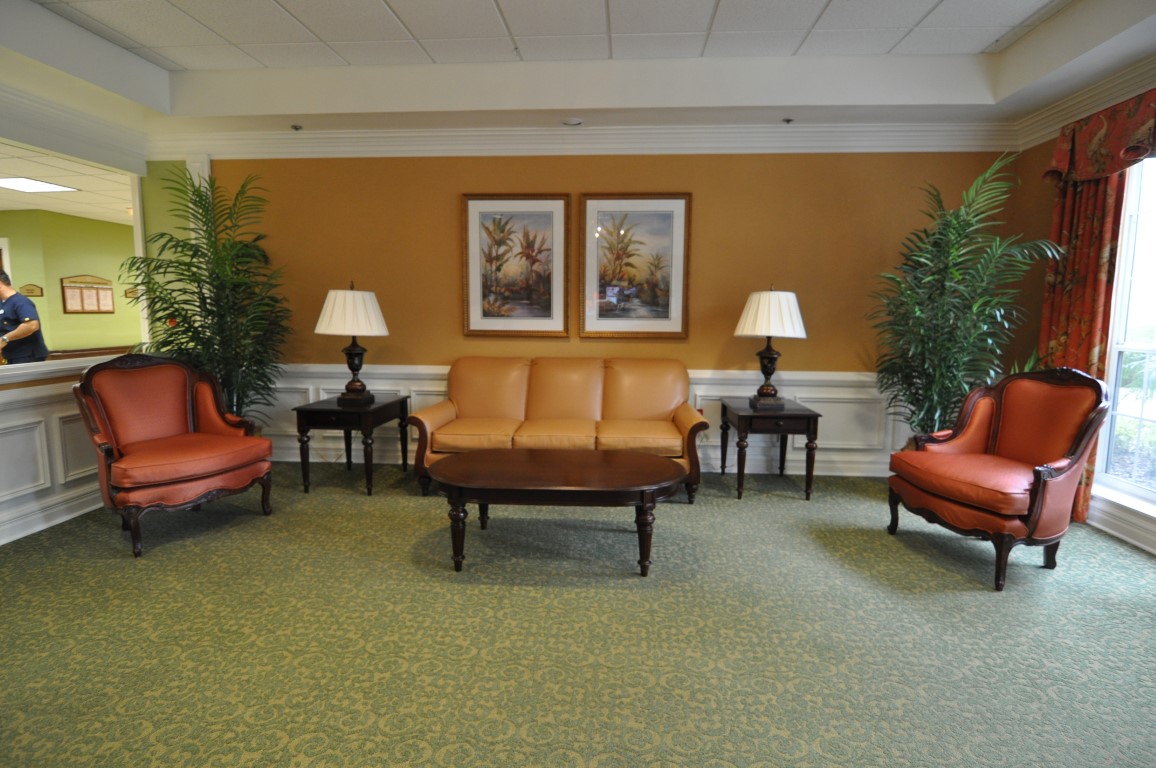
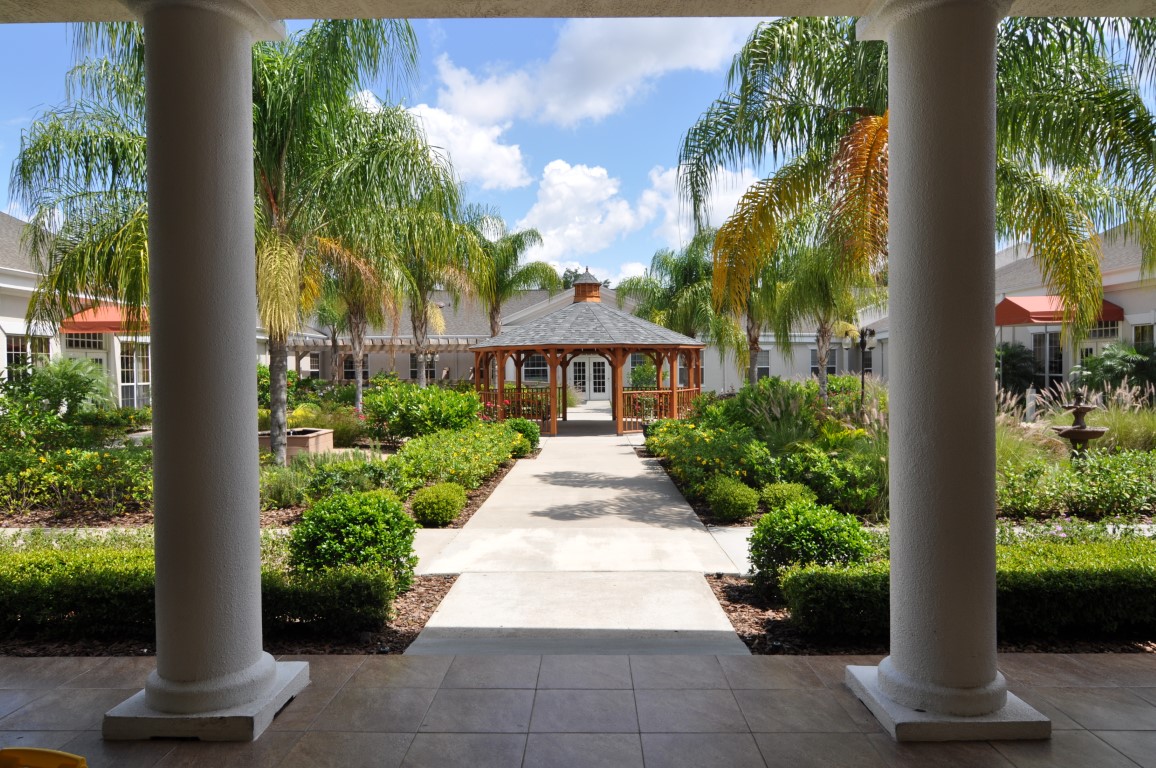
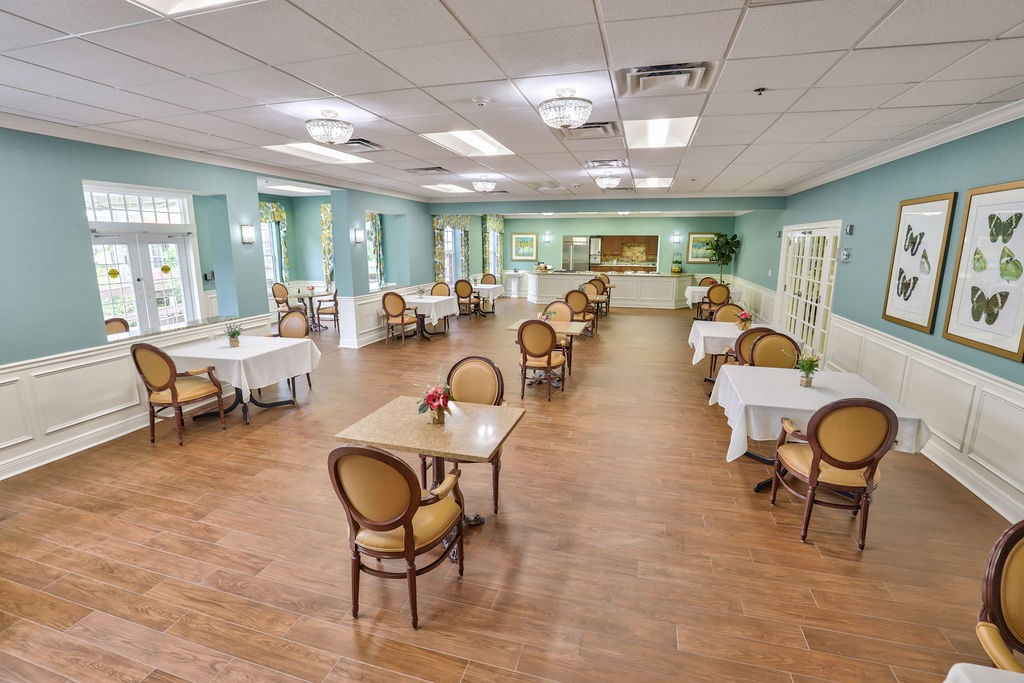
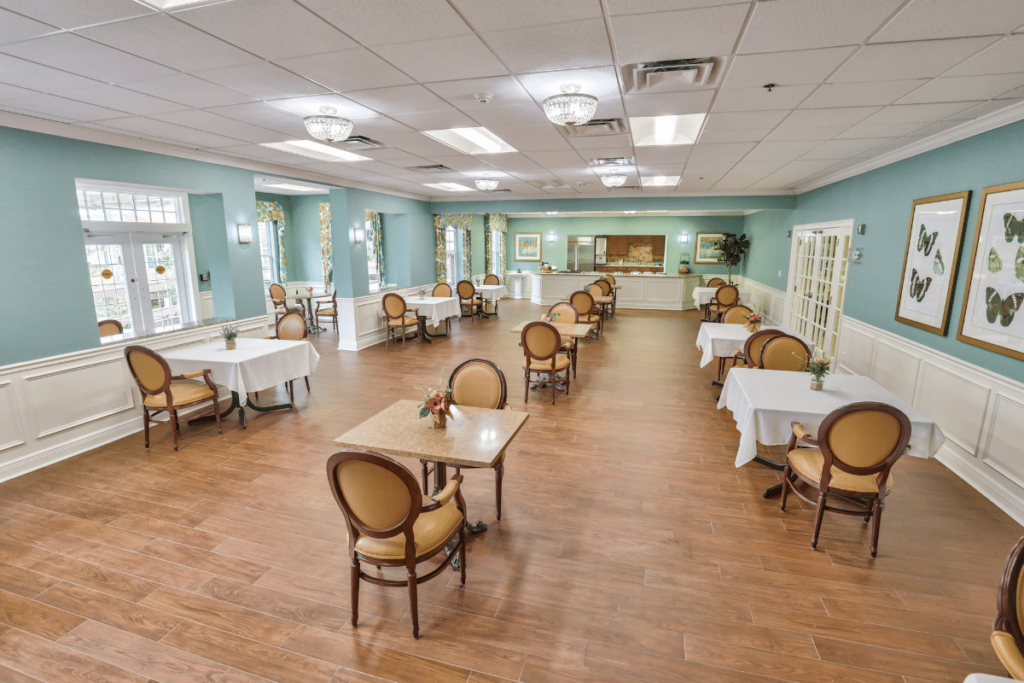
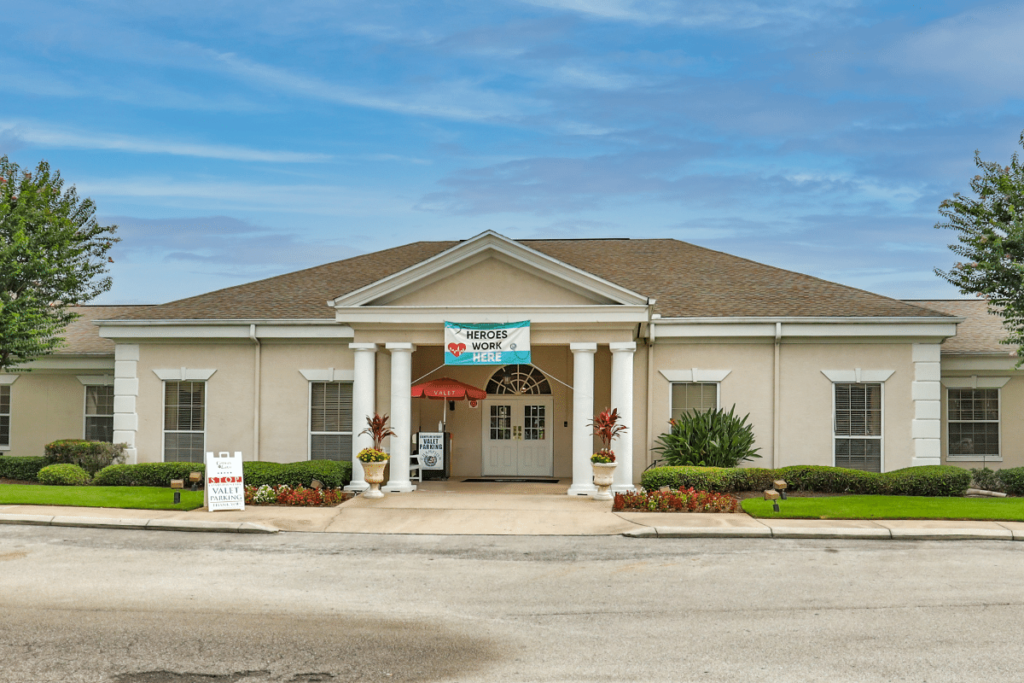
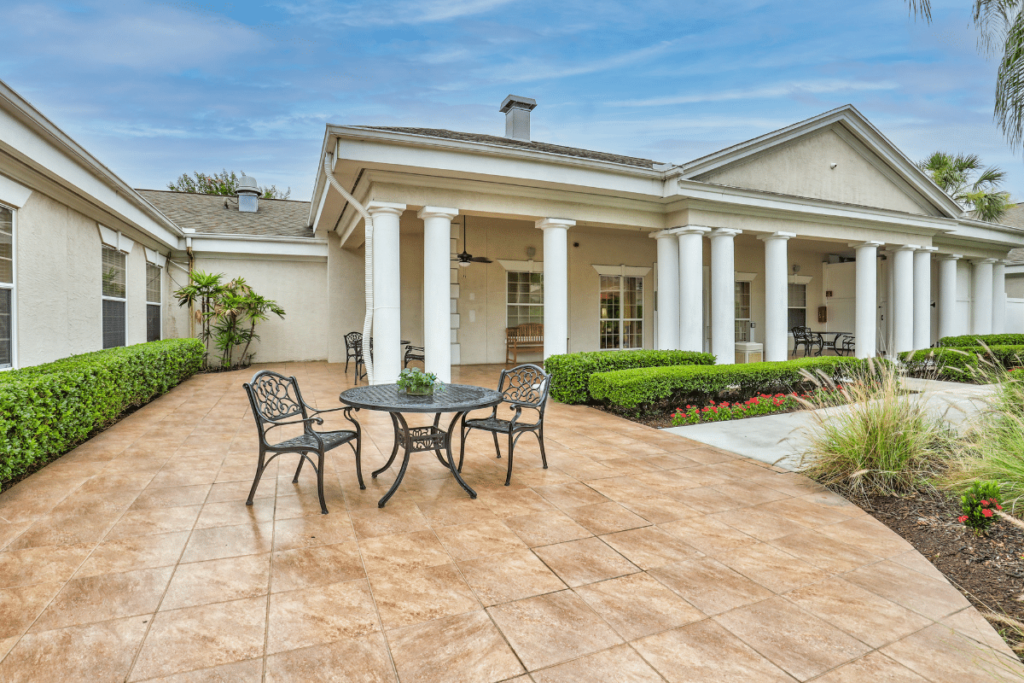
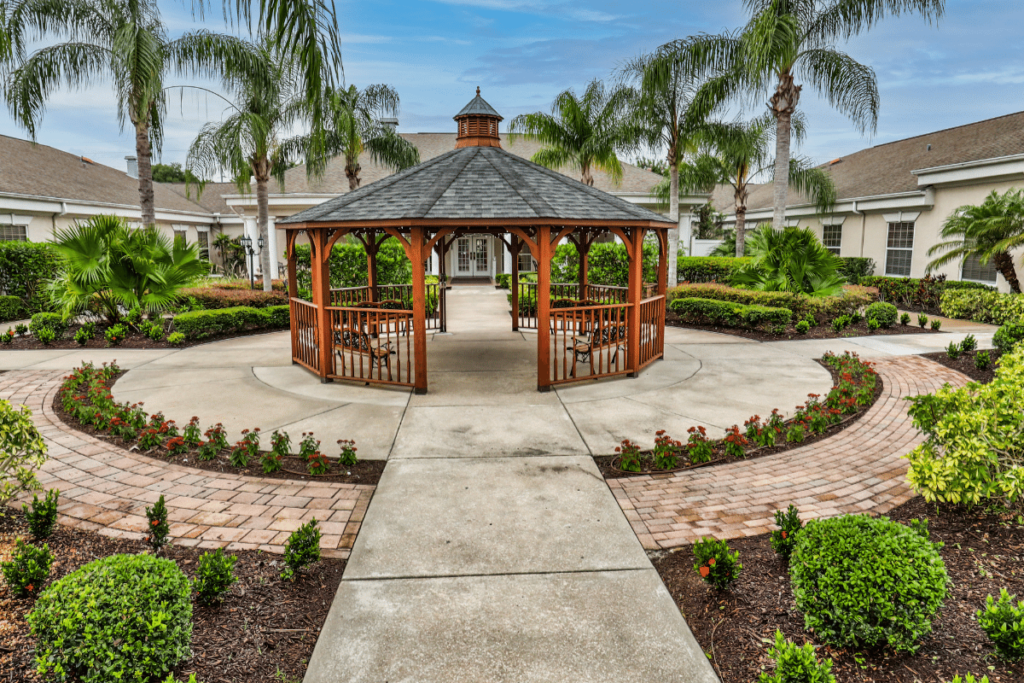
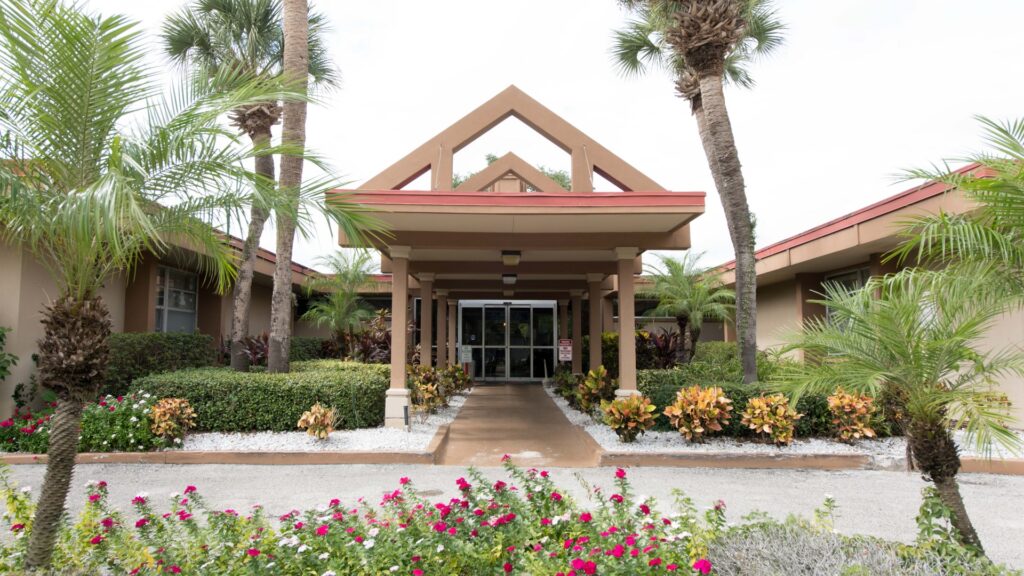
Start your healing journey with Conway Lakes Health and Rehabilitation, a distinct community nestled in the beautiful setting of Orlando, FL, offering skilled nursing and therapy. Dedicated to improving residents’ welfare, a friendly and well-trained team provides exceptional care around the clock to meet their needs. Residents here enjoy a vibrant lifestyle with the community’s purposely crafted accommodations and resort-style amenities.

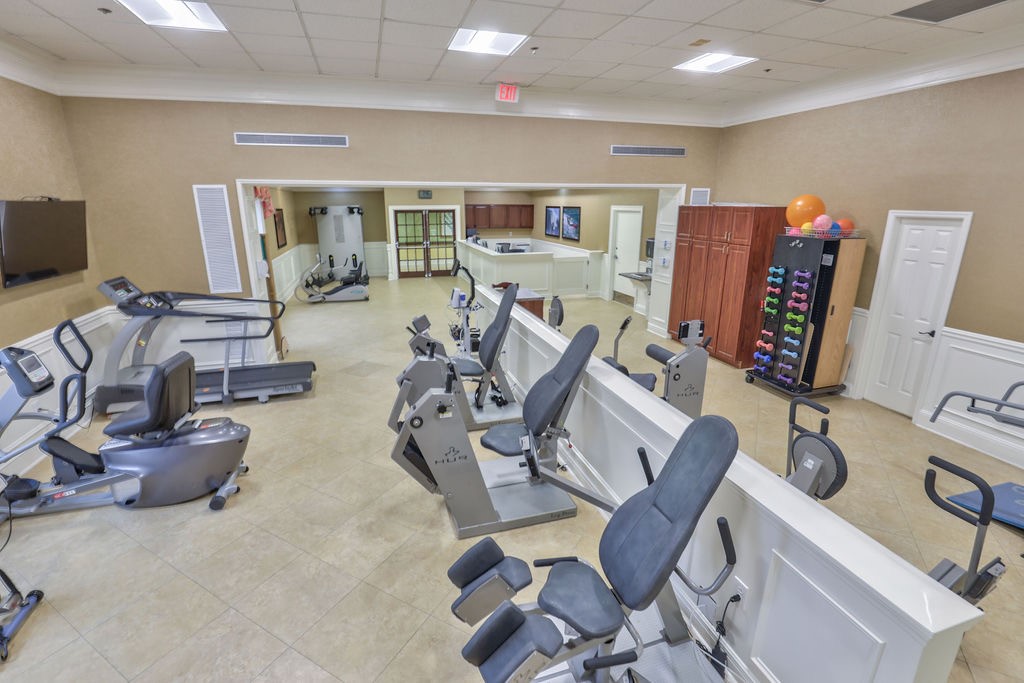
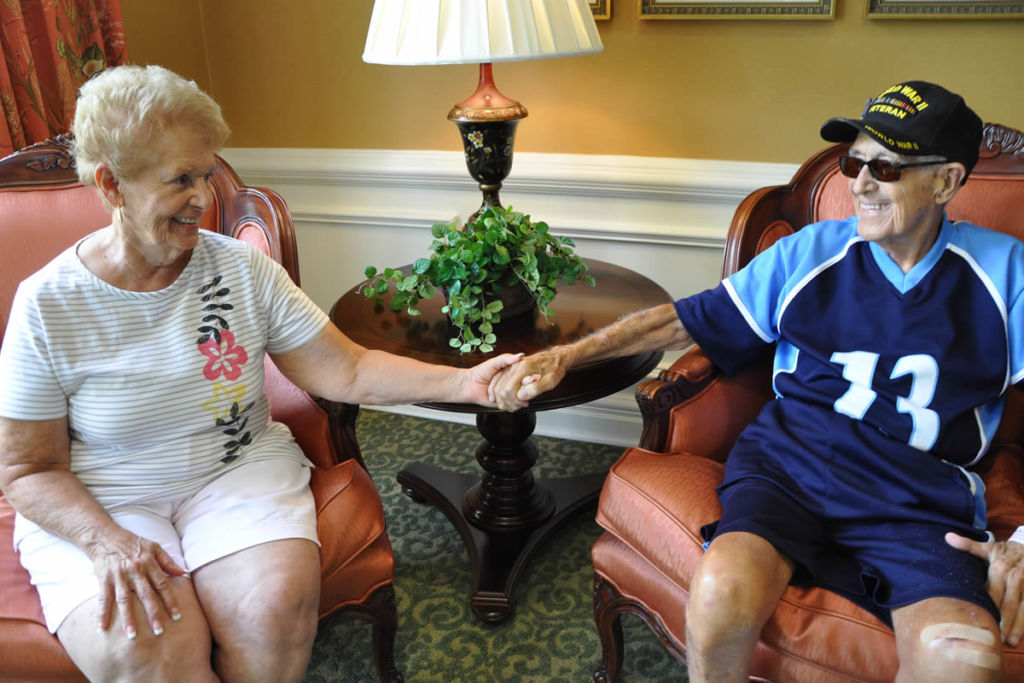
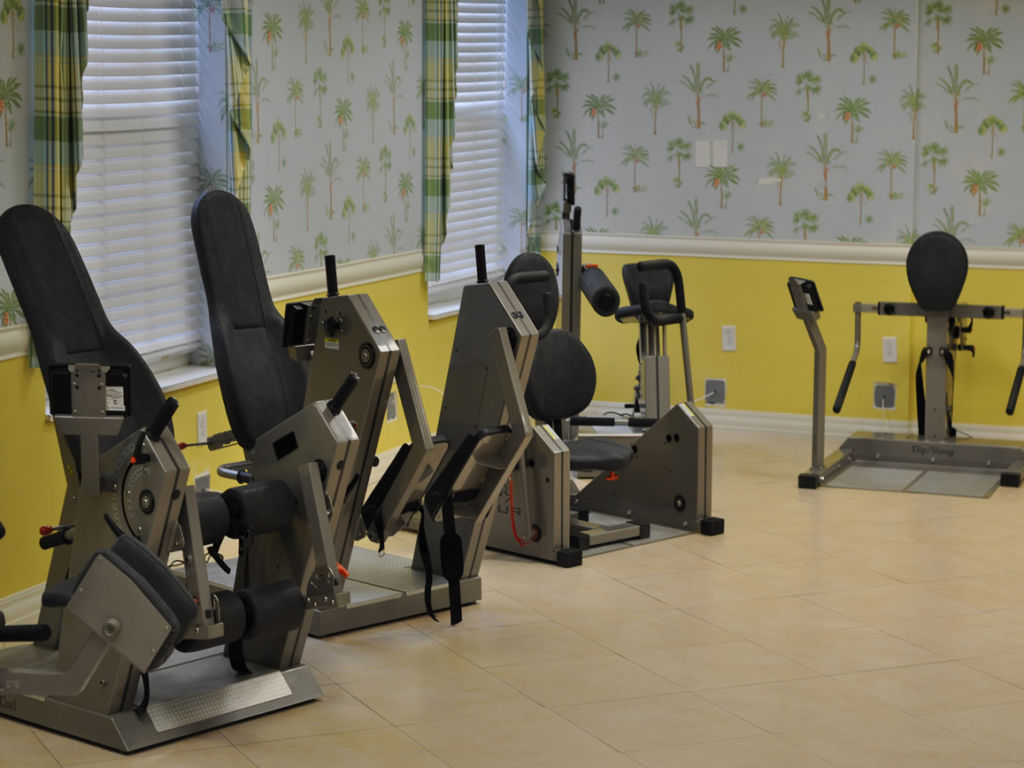
Aside from their healthcare needs, the community strives to keep residents happy and active with fun recreational activities and enriching programs. Therapy services, including physical, occupational, and speech therapy, are provided to enhance residents’ living experiences. With its nurturing and welcoming environment, residents will surely feel at ease during their stay. The community is 5-star rated by the Centers for Medicare and Medicaid Services, proving its exceptional quality.

(407) 384-8838

Quality ratings

Measured by Centers for Medicare & Medicaid Services (CMS)

Overall rating Info Official CMS rating based on health inspections, staffing and quality measures.
1/5
Florida average: 3.2/5
Health Inspection Info Official CMS rating based on deficiencies found during state health inspections.
1/5
Florida average: 2.8/5
Staffing Info Official CMS rating based on nurse staffing hours per resident per day.
4/5
Florida average: 3.4/5
Quality Measures Info Official CMS rating based on clinical outcomes for residents.
3/5
Florida average: 4.1/5

Nursing care per resident

Info Average daily nursing hours per resident (adjusted for acuity). Higher values indicate more nursing time per resident.
4h 13m per day

This home provides 4% more nursing time per resident than the Florida average.

Florida average: 4h 2m per day

Staffing hours breakdown

Info Hours of care per resident per day, broken down by staff type. Data from CMS Medicare.
Staff type Facility State avg National avg
Registered Nurse (RN) Info Registered nurse hours per resident per day. 45m per day 32m per day 29m per day

Capacity and availability

This home is often near full

That suggests steady demand, but availability may be limited.

Higher demand than most homes in Florida
Occupancy rate 95.5%
Residents per day (avg) 113
Occupancy rate
95.5%
Residents per day (avg)
113

Who this home usually serves

TYPE OF STAY

Mix of rehab and long-term care

This home supports both short-term rehab and long-term care, with residents staying for a wide range of durations.

Breakdown by payment type

Medicare

41% of new residents, usually for short-term rehab.

Typical stay 1 - 2 months

Private pay

57% of new residents, often for short stays.

Typical stay 1 months

Medicaid

3% of new residents, often for long-term daily care.

Typical stay 2 years

Finances and operations

Privately-owned community
Home revenue
$18.4M
Profit
$593.6K
Privately-owned community
Home revenue
$18,401,671.00
Profit
$593,632.00
Payroll costs Info The portion of the home's budget spent on staff, including nurses, caregivers, and other employees who support care and operations.
$7.8M
42.6% of revenue
Other operating costs Info All remaining costs needed to run the home, such as food, utilities, building maintenance, supplies and administrative expenses.
$10.0M
Total costs $17.8M
Walk Score
Walk Score: 10 / 100
Car-dependent. Most errands require a car, with limited nearby walkable options.

About this community

Additional licensing details

Accreditations: 5 Star facility by Centers for Medicare and Medicaid Services, Governor's Gold Seal, certified by the JCAHO Joint Commission on Accreditation for Health Care Organizations

Care Services

Accepts Medicare
Nursing Services
Rehabilitation Services
Respite Care
Skilled Nursing
Licensed Nurses/CNAs
24-Hour Staffing
Short-Term Rehab

All Levels of Care

Rehabilitation
Skilled Nursing

Amenities & Lifestyle

Upscale amenities
relaxing landscapes
elegant dining
modern equipment
rehabilitation facility

Programs & Activities

Specific Programs
Physical Therapy, Occupational Therapy, Speech Therapy, Orthopedic Rehab, Cardiac Rehab, Stroke Recovery, Pulmonary Therapy, Lymphedema Therapy, Mist Therapy, Wound Care Services, Urinary Incontinence, Pain Reduction, Vestibular Therapy, Balance Program
Operating Hours
Open 9am - 5pm

Dining & Nutrition

Food Description
Dining experience includes upscale amenities and a focus on fresh, healthy meals with daily specials.
Meals Included
Yes
Special Diets
Yes

What does this home offer?

Accepts Medicaid icon

Accept Medicaid: Yes

Total residents icon

Total Residents: 114 Residents

Housing options icon

Housing Options: Private / Semi-private Rooms

Building type icon
Building type icon

Building Type: Single-story

Dining services icon

Dining Services

Recreational activities icon

Recreational Activities

Health Programs icon

Health Programs

Types of Care at Conway Lakes Health & Rehabilitation

Nursing Home
Contact Conway Lakes Health & Rehabilitation

Health Inspection History

Inspections
Total health inspections 7

Florida average 4.3


Last Health inspection on Sep 2025

Total health citations 31
Citations per inspection
4.43

Health citations are formal notices following inspections when they fail to comply with safety and care standards.

17 of 31 citations resulted from standard inspections; and 14 of 31 resulted from complaint investigations.

Breakdown of citation severity (last 3 years)
Critical Health citations More info 2
150% worse than Florida average

Florida average: 0.8


Serious Health citations More info 1
150% worse than Florida average

Florida average: 0.4

2 critical citations More info Florida average: 0.8

1 serious citation More info Florida average: 0.4

28 moderate citations More info Florida average: 18.4

0 minor citations More info Florida average: 0.2
Citations history (last 3 years)
Infection Control moderate citation Sep 11, 2025
Corrected

Nutrition moderate citation Sep 11, 2025
Corrected

Pharmacy moderate citation Sep 11, 2025
Corrected

Care Planning moderate citation Sep 11, 2025
Corrected

Compare Nursing Homes around Orange County

The information below is reported by the Florida Agency for Health Care Administration (AHCA).
Tuskawilla Nursing and Rehab Center
SNF

Nursing Homes 24/7 care needed

RC

Respite Care

Winter Springs
98
A-
62
GALVIN, RODRICK
92.0%
$14,131,211.00
$5,410,587.00
38.3%
91.60
5/5
3.7691
4/5
4/5
5/5
3
9
1
-2%
-7%
+9%
Private / Semi-private Rooms
Winter Garden Rehabilitation and Nursing Center
SNF

Nursing Homes 24/7 care needed

Winter Garden
120
-
37
WG REHAB HOLDINGS, LLC
91.9%
$13,106,930.00
$5,718,644.00
43.6%
101.70
2/5
4.0056
2/5
4/5
4/5
1
25
1
-29%
-1%
+9%
Private / Semi-private Rooms
Lake Bennet Center for Rehabilitation and Healing
HC

Hospice Care

SNF

Nursing Homes 24/7 care needed

RC

Respite Care

Ocoee
120
-
40
LAKE BENNET SNF OPERATIONS HOLDINGS LLC
97.0%
$16,761,873.00
$7,236,567.00
43.2%
115.30
2/5
3.7580
1/5
3/5
5/5
1
16
2
-24%
-7%
+15%
Private / Semi-private Rooms
Conway Lakes Health & Rehabilitation
SNF

Nursing Homes 24/7 care needed

Orlando (Dover Manor)
120
-
10
DUMONT, BRITTNEY
95.5%
$18,401,299.00
$7,839,875.00
42.6%
113.20
1/5
4.2087
1/5
4/5
3/5
6
31
3
-7%
+4%
+13%
Private / Semi-private Rooms
South Orange Health and Rehabilitation Center
SNF

Nursing Homes 24/7 care needed

Orlando (Southeast Orlando)
108 Residents
-
60
-
-
-
-
-
-
-
-
-
-
-
-
-
-
-
-
-
Private / Semi-private Rooms

Places of interest near Conway Lakes Health & Rehabilitation

Address 4.5 miles from city center

Address 5201 Curry Ford Rd, Orlando, FL 32812

Calculate Travel Distance to Conway Lakes Health & Rehabilitation

Add your location

Address

Staffing Data

Source: CMS Payroll-Based Journal (Q2 2025)

191
Total Staff
190
Employees
1
Contractors
51,773
Total Hours (Quarter)
71
Avg Staff/Day
8
Avg Shift (hrs)
Nursing Staff Breakdown
Role Count Avg Shift (hrs) Uses Contractors?
Registered Nurse218.1 No
Licensed Practical Nurse268.3 No
Certified Nursing Assistant868.3 No
Staff by Category
Administration
2 staff
6.7hs shift avg
Nursing Staff
143 staff
8.2hs shift avg
Physicians & Practitioners
11 staff
7hs shift avg
Therapy Services
26 staff
7.1hs shift avg
Activities & Recreation
0 staff
0hs shift avg
Social Services
4 staff
7.4hs shift avg
Dietary Services
4 staff
7.8hs shift avg
Other Services
1 staff
8hs shift avg
Contractor Analysis
0.1%
of total hours from contractors
26 contractor hours this quarter
Medical Director: 1
Role Employees Contractors Total Staff Total Hours Days Worked % of Days Avg Shift (hrs)
Certified Nursing Assistant8608624,24191100%8.3
Licensed Practical Nurse260266,63491100%8.3
Registered Nurse210215,60391100%8.1
RN Director of Nursing100103,18791100%8.2
Speech Language Pathologist9092,4497886%7.6
Physical Therapy Aide8081,8608695%6.9
Clinical Nurse Specialist100101,6529099%6.8
Physical Therapy Assistant6061,2678088%6.2
Qualified Social Worker4041,2206470%7.4
Respiratory Therapy Technician3039198695%7.6
Other Dietary Services Staff3038908189%7.7
Administrator1015126470%8
Dietitian1014966268%8
Mental Health Service Worker1014886167%8
Nurse Practitioner1013284145%8
Medical Director011261618%1.6

Facility Characteristics

Source: CMS Long-Term Care Facility Characteristics (Data as of Jan 2026)

Total census
114 residents
Residents by payment source
Medicare
31 residents (27.2%)
Medicaid
48 residents (42.1%)
Private pay or other
35 residents (30.7%)
Programs & Services
Residents' Group

Residents meet regularly to discuss policies, care quality, and activities

Family Member Group

Family members meet regularly to discuss policies, care quality, and activities

Active Family Council

Organized group of family members that meets regularly to discuss facility policies, resident care, and activities.

Active Resident Council

Organized group of residents that meets regularly to discuss facility policies, quality of life, and activities.

Quality of care over time

These measures show how residents usually do over time at this home, based on health outcomes and preventive care.

High-risk clinical events score Info A composite score based on pressure ulcers, falls with injury, weight loss, walking ability decline, and activities of daily living decline. 13.1
76% worse than Florida average

Florida average: 7.4

Functional decline score Info A composite score based on activities of daily living decline, walking ability decline, and incontinence. 26.1
110% worse than Florida average

Florida average: 12.4

Long-stay resident measures
Below average Florida avg: 4.6 Info CMS star rating based on long-stay quality measure performance. 5 stars = significantly above average, 1 star = significantly below average.
Need for Help with Daily Activities Increased Info Percent of long-stay residents whose need for help with daily activities has increased 26.2%
150% worse than Florida average

Florida average: 10.5%

Walking Ability Worsened Info Percent of long-stay residents whose ability to move independently worsened 30.7%
137% worse than Florida average

Florida average: 12.9%

Low Risk Residents with Bowel/Bladder Incontinence Info Percent of low risk long-stay residents who lose control of their bowels or bladder 21.3%
58% worse than Florida average

Florida average: 13.5%

Falls with Major Injury Info Percent of long-stay residents experiencing one or more falls with major injury 2.8%
5% worse than Florida average

Florida average: 2.6%

High Risk Residents with Pressure Ulcers Info Percent of long-stay high risk residents with pressure ulcers 3.1%
42% better than Florida average

Florida average: 5.4%

Urinary Tract Infection Info Percent of long-stay residents with a urinary tract infection 1.1%
22% worse than Florida average

Florida average: 0.9%

Lost Too Much Weight Info Percent of long-stay residents who lose too much weight 2.5%
58% better than Florida average

Florida average: 6.0%

Depressive Symptoms Info Percent of long-stay residents who have depressive symptoms 0.0%
100% better than Florida average

Florida average: 3.3%

Antipsychotic Use Info Percent of long-stay residents who received an antipsychotic medication 13.2%
65% worse than Florida average

Florida average: 8.0%

Pneumococcal Vaccine Info Percent of long-stay residents assessed and appropriately given the pneumococcal vaccine 99.0%
In line with Florida average

Florida average: 97.7%

Influenza Vaccine Info Percent of long-stay residents assessed and appropriately given the seasonal influenza vaccine 100.0%
In line with Florida average

Florida average: 99.2%

Hospitalizations per 1,000 days Info Number of hospitalizations per 1,000 long-stay resident days. 2.23
6% worse than Florida average

Florida average: 2.10

ED visits per 1,000 days Info Number of outpatient emergency department visits per 1,000 long-stay resident days. 1.37
16% worse than Florida average

Florida average: 1.18

Short-stay resident measures
Average Florida avg: 2.9 Info CMS star rating based on short-stay quality measure performance. 5 stars = much above average, 1 star = much below average.
Pneumococcal Vaccine Info Percent of short-stay residents assessed and appropriately given the pneumococcal vaccine 97.7%
In line with Florida average

Florida average: 94.0%

Antipsychotic medication increase Info Percent of short-stay residents who newly received an antipsychotic medication 1.6%
9% worse than Florida average

Florida average: 1.5%

Influenza Vaccine Info Percent of short-stay residents assessed and appropriately given the seasonal influenza vaccine 97.9%
In line with Florida average

Florida average: 94.7%

Re-hospitalized after SNF stay Info Percentage of short-stay residents who were re-hospitalized after their nursing home admission. 33.5%
28% worse than Florida average

Florida average: 26.2%

Emergency department visits Info Percentage of short-stay residents who had an outpatient emergency department visit. 8.7%
6% better than Florida average

Florida average: 9.3%

Falls with major injury Info Percentage of SNF residents who experience falls with major injury during their stay. 1.8%
129% worse than Florida average

Florida average: 0.8%

Ability to care for self at discharge Info Percentage of residents at or above expected ability to care for themselves at discharge. 34.0%
37% worse than Florida average

Florida average: 53.7%

Successful return to home or community Info Rate of successful return to home or community from a skilled nursing facility. 51.1%
In line with Florida average

Florida average: 50.6%

Penalties and fines

Federal penalties imposed by CMS for regulatory violations, including civil money penalties (fines) and denials of payment for new Medicare/Medicaid admissions.

Source: CMS Penalties Database (Data as of Jan 2026)

Total fines amount $95K
31% higher than Florida average

Florida average: $72K

Number of fines 6
127% more fines than Florida average

Florida average: 2.6

Payment Denials Info Serious action where Medicare and/or Medicaid temporarily stops payments for new residents until issues are fixed. 0
100% fewer payment denials than Florida average

Florida average: 0.1

Fines amount comparison
This facility $95K
Florida average $72K
Penalty History

Penalties are imposed by CMS for violations of federal nursing home regulations.

Civil Money Penalty Info Fines imposed for noncompliance, which can be assessed per day or per instance of violation. Jun 10, 2025
$4K
Civil Money Penalty Info Fines imposed for noncompliance, which can be assessed per day or per instance of violation. Jun 10, 2025
$4K
Civil Money Penalty Info Fines imposed for noncompliance, which can be assessed per day or per instance of violation. Jun 10, 2025
$6K
Civil Money Penalty Info Fines imposed for noncompliance, which can be assessed per day or per instance of violation. Feb 1, 2025
$62K

Last updated: Jan 2026

Guides for Better Senior Living

Care Cost Calculator: See Prices in Your Area

Nursing Home Data Explorer

Don’t Wait Too Long: 7 Red Flag Signs Your Parent Needs Assisted Living Now

The True Cost of Assisted Living in 2025 – And How Families Are Paying For It

Understanding Senior Living Costs: Pricing Models, Discounts & Financial Assistance

Financial Aid for Florida Seniors

Get financial aid guidance

Long-Term Care Waiver

Florida Medicaid LTC Waiver

Age 65+ or 21+ disabled, Florida resident, Medicaid- eligible, nursing home-level care need.

~$2,829/month (300% FBR, individual).

$2,000 (individual), $3,000 (couple).

High demand; waitlists common.

Community Care for the Elderly (CCE)

Florida CCE

Age 60+, Florida resident, at risk of nursing home.

~$2,000/month (varies).

$5,000 (individual).

Limited funding; regional variation.

Home Care for the Elderly (HCE)

Florida Home Care for the Elderly

Age 60+, Florida resident, at risk of nursing home placement; caregiver must be approved.

~$2,829/month (individual, aligned with Medicaid thresholds).

~$2,000 (individual); varies by case manager discretion.

Limited funding (~3,500 served annually); prioritizes low-income frail seniors.

Program of All-Inclusive Care for the Elderly (PACE)

Florida Medicaid PACE

Age 55+, Florida resident, nursing home-level care need, safe with PACE support.

~$2,829/month (300% FBR).

$2,000 (individual), $3,000 (couple).

Limited to specific counties (e.g., Hillsborough, Miami-Dade); ~10 sites statewide.

Optional State Supplementation (OSS)

Florida Optional State Supplementation

Age 65+ or disabled, Florida resident, living in approved facility, receiving SSI or low-income.

~$1,004/month (individual, including SSI).

$2,000 (individual), $3,000 (couple).

Limited to specific facility types; ~$78.40/month max supplement.

Senior Community Service Employment Program (SCSEP)

Florida SCSEP (federally funded, state-administered)

Age 55+, unemployed, low-income, Florida resident.

~$1,983/month (125% FPL, individual).

Not specified; income-focused.

Priority for veterans, rural residents; ~1,000 slots/year.