


Total staff
177
Employees
175
Contractors
2
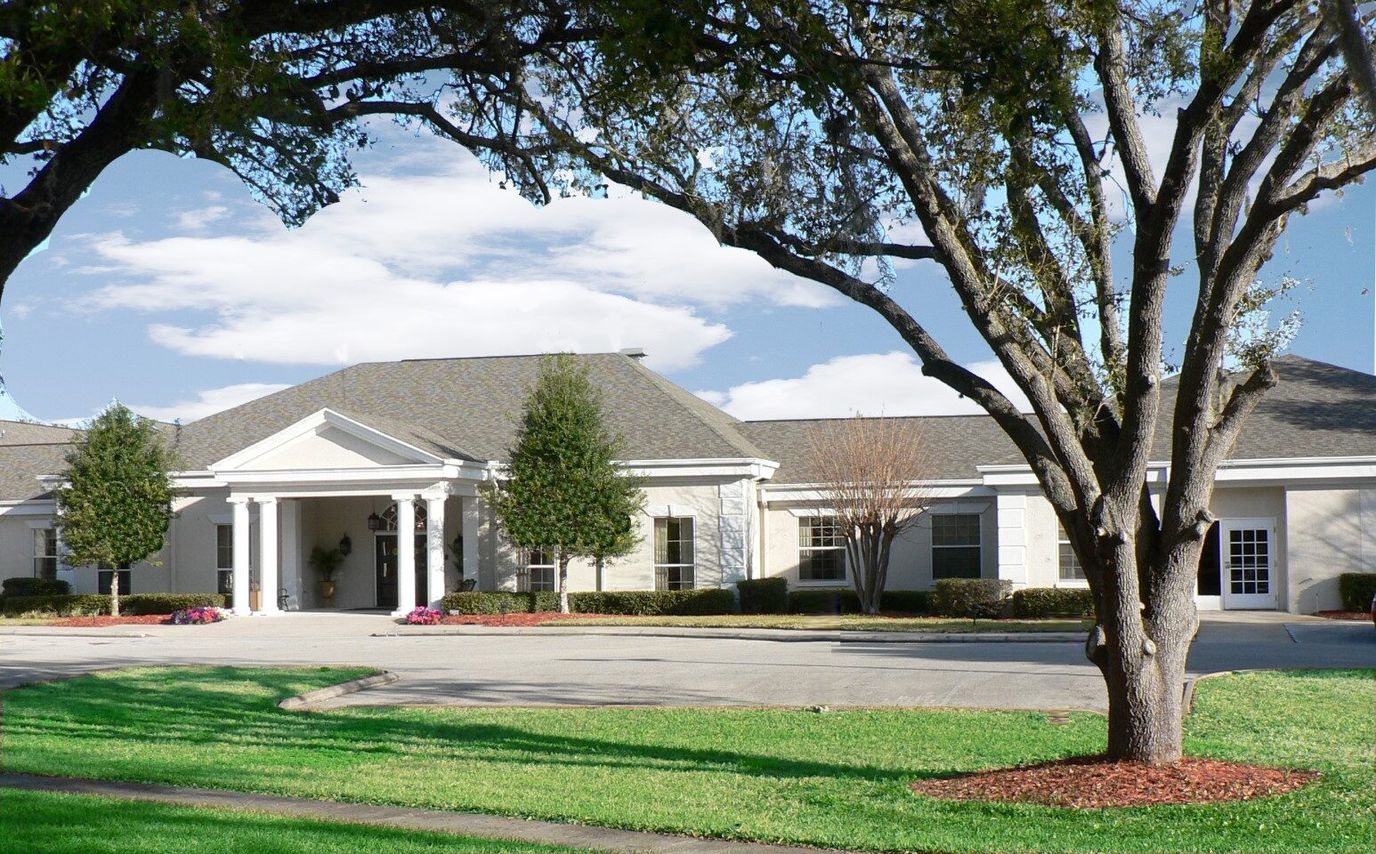
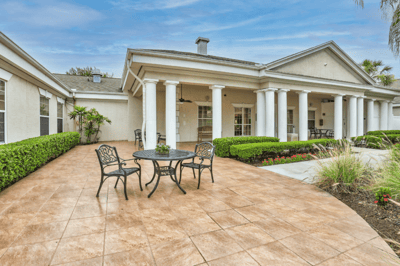
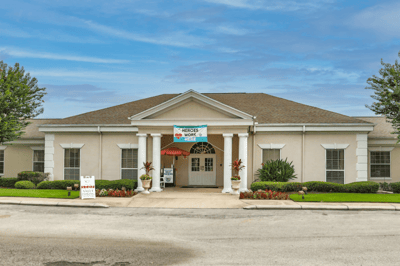
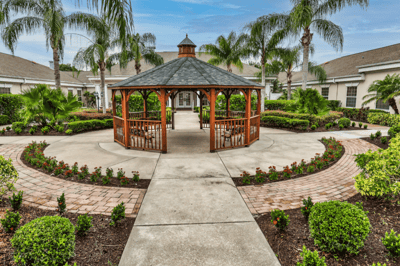
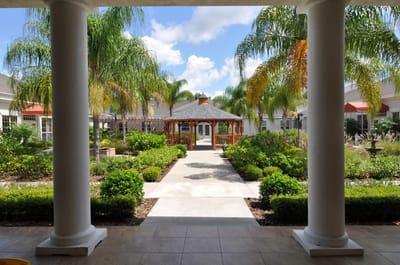
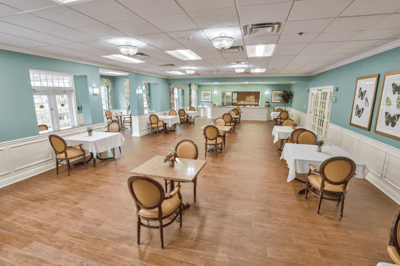
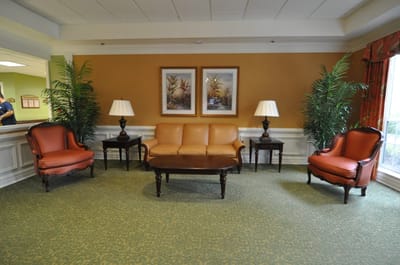
Start your healing journey with Conway Lakes Health and Rehabilitation, a distinct community nestled in the beautiful setting of Orlando, FL, offering skilled nursing and therapy. Dedicated to improving residents’ welfare, a friendly and well-trained team provides exceptional care around the clock to meet their needs. Residents here enjoy a vibrant lifestyle with the community’s purposely crafted accommodations and resort-style amenities.
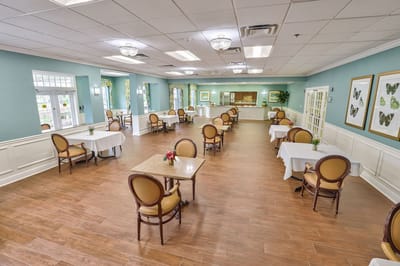
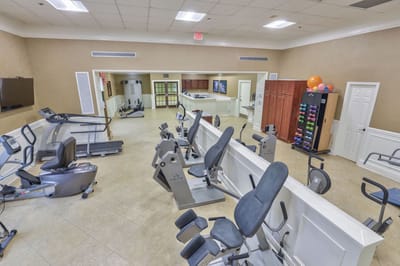
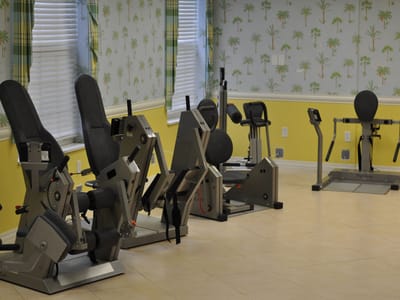
Aside from their healthcare needs, the community strives to keep residents happy and active with fun recreational activities and enriching programs. Therapy services, including physical, occupational, and speech therapy, are provided to enhance residents’ living experiences. With its nurturing and welcoming environment, residents will surely feel at ease during their stay. The community is 5-star rated by the Centers for Medicare and Medicaid Services, proving its exceptional quality.
| Staff type | Hours / Day / Resident | vs state avg |
|---|---|---|
|
Registered Nurse (RN)
| 42m per day | ▼ 4% State avg: 44m per day · National avg: 41m per day |
|
LPN / LVN
| 55m per day | ▲ 17% State avg: 47m per day · National avg: 52m per day |
|
Nurse Aide
| 2h 25m per day | ▲ 3% State avg: 2h 20m per day · National avg: 2h 21m per day |
|
Weekend Total Nursing
| 3h 42m per day | ▲ 5% State avg: 3h 31m per day · National avg: 3h 26m per day |
|
Physical Therapist
| 7m per day | ▲ 31% State avg: 5m per day · National avg: 4m per day |
|
Weekend RN
| 41m per day | ▲ 27% State avg: 32m per day · National avg: 29m per day |
Reporting period: October 1 – December 31, 2025 (Q4 2025). Source: CMS Payroll-Based Journal report.
Manages medical care and health needs.
Assists with medical care and medications.
Helps with daily care and mobility.
Total hours from contractors
32 contractor hours this quarter
| Certified Nursing Assistant | 82 | 0 | 82 | 25,503 | 92 | 100% | 8.2 |
| Registered Nurse | 19 | 0 | 19 | 5,929 | 92 | 100% | 8.2 |
| Licensed Practical Nurse | 16 | 0 | 16 | 5,709 | 92 | 100% | 8.4 |
| RN Director of Nursing | 9 | 0 | 9 | 3,964 | 92 | 100% | 8.3 |
| Speech Language Pathologist | 9 | 0 | 9 | 2,940 | 85 | 92% | 7.5 |
| Physical Therapy Aide | 9 | 0 | 9 | 1,834 | 86 | 93% | 6.8 |
| Other Dietary Services Staff | 6 | 0 | 6 | 1,501 | 89 | 97% | 7.6 |
| Respiratory Therapy Technician | 5 | 0 | 5 | 1,156 | 90 | 98% | 7.4 |
| Clinical Nurse Specialist | 7 | 1 | 8 | 1,037 | 70 | 76% | 7.7 |
| Physical Therapy Assistant | 5 | 0 | 5 | 980 | 80 | 87% | 6.1 |
| Qualified Social Worker | 3 | 0 | 3 | 867 | 64 | 70% | 7.1 |
| Mental Health Service Worker | 2 | 0 | 2 | 856 | 66 | 72% | 8 |
| Administrator | 1 | 0 | 1 | 512 | 64 | 70% | 8 |
| Nurse Practitioner | 1 | 0 | 1 | 488 | 63 | 68% | 7.7 |
| Dietitian | 1 | 0 | 1 | 464 | 58 | 63% | 8 |
| Medical Director | 0 | 1 | 1 | 24 | 12 | 13% | 2 |
Includes penalties issued in 2024-2025
Federal penalties imposed by CMS for regulatory violations, including civil money penalties (fines) and denials of payment for new Medicare/Medicaid admissions.
Source: CMS Penalties Database (Data as of Jan 2026)
Florida average: $72K
Florida average: 2.6
Florida average: 0.1
Penalties are imposed by CMS for violations of federal nursing home regulations.
6 penalties in the past 3 years
Multiple penalties were reported in the last 3 years.
Last updated: Jan 2026
These measures show how residents usually do over time at this home, based on health outcomes and preventive care.
Florida average: 7.4
Florida average: 12.4
Florida average: 10.5%
Florida average: 12.9%
Florida average: 13.5%
Florida average: 2.6%
Florida average: 5.4%
Florida average: 0.9%
Florida average: 6.0%
Florida average: 3.3%
Florida average: 8.0%
Florida average: 97.7%
Florida average: 99.2%
Florida average: 2.10
Florida average: 1.18
Florida average: 94.0%
Florida average: 1.5%
Florida average: 94.7%
Florida average: 26.2%
Florida average: 9.3%
Florida average: 0.8%
Florida average: 53.7%
Florida average: 50.6%
Quality measures are calculated from Minimum Data Set (MDS) assessments. For most measures, lower percentages indicate better care quality.
41% of new residents, usually for short-term rehab.
57% of new residents, often for short stays.
3% of new residents, often for long-term daily care.
Source: CMS Long-Term Care Facility Characteristics (Data as of Jan 2026)
Residents meet regularly to discuss policies, care quality, and activities
Family members meet regularly to discuss policies, care quality, and activities
Organized group of family members that meets regularly to discuss facility policies, resident care, and activities.
Organized group of residents that meets regularly to discuss facility policies, quality of life, and activities.
Data sourced from CMS Long-Term Care Facility Characteristics quarterly report. Payer mix reflects the current resident census by primary payment source.
Historical financial and operational data for Conway Lakes Health & Rehabilitation from 2011–2023, based on CMS SNF Cost Reports.
Key figures below are for fiscal year ending in 12/2023.
Based on CMS SNF Cost Report for fiscal year ending in 12/2023.
No pets allowed
Housing Options: Private / Semi-private Rooms
Building Type: Single-story
Recreational Activities

Health Programs
This home supports both short-term rehab and long-term care, with residents staying for a wide range of durations.
Most new residents arrive under private pay (57% of admissions), and a typical private pay stay runs around 1 months.
Coverage residents most often arrive under.
Coverage residents most often leave under.
![]() 4.5 miles from city center
4.5 miles from city center
![]() Estimated distance in miles from Orlando's city center to Conway Lakes Health & Rehabilitation's address, calculated via Google Maps.
Estimated distance in miles from Orlando's city center to Conway Lakes Health & Rehabilitation's address, calculated via Google Maps.
Add your location
Info below is compiled from CMS reports & the FL Agency for Health Care Administration (AHCA), senior community websites & trusted data sources such as Walk Score & BBB.
Communities are listed from highest to lowest based on our ranking methodology.
| Westminster Baldwin Park | NH AL IL MC SNF | Orlando (Northeast Orlando) | 24
Facility
24
FL AVG
88
Rank
#858 / 1058 | - | - | 4.90
Facility
4.90
FL AVG
4.04
Rank
#26 / 181 | +80% | +21% | $0
Facility
$0
FL AVG
$78.9k
Rank
#1 / 185 | - | 15
Facility
15
FL AVG
19.7
Rank
#68 / 181 | 5.0
Facility
5.0
FL AVG
4.5
Rank
#118 / 181 | - | 18 | - |
26
Facility
26
FL AVG
40
Rank
#977 / 1487 | Presbyterian Retirement Communities, Inc | $4.7MFiscal year ending 03/2024
Facility
$4.7MFiscal year ending 03/2024
FL AVG
$15.7M
Rank
#163 / 184 | $3.5MFiscal year ending 03/2024
Facility
$3.5MFiscal year ending 03/2024
FL AVG
$6.1M
Rank
#172 / 184 | 73.9%Fiscal year ending 03/2024
Facility
73.9%Fiscal year ending 03/2024
FL AVG
39.8%
Rank
#151 / 184 | 106118 | ||||
| South Orange Health and Rehabilitation Center | NH HOS RC SNF | Orlando (Southeast Orlando) | 115
Facility
115
FL AVG
88
Rank
#340 / 1058 |
92.0%
Facility
92.0%
FL AVG
84.4
Rank
#56 / 125 | +9% | 4.82
Facility
4.82
FL AVG
4.04
Rank
#31 / 181 | -7% | +19% | $14.4k
Facility
$14.4k
FL AVG
$78.9k
Rank
#132 / 185 | - | 15
Facility
15
FL AVG
19.7
Rank
#68 / 181 | 3.0
Facility
3.0
FL AVG
4.5
Rank
#39 / 181 | - | 106 | - |
60
Facility
60
FL AVG
40
Rank
#351 / 1487 | Orlando Fl Holdco LLC | $8.7M*Fiscal year ending 12/2022These figures are from this home's most recent complete cost report — an older period than most facilities report. Compare with that in mind.
Facility
$8.7M*Fiscal year ending 12/2022These figures are from this home's most recent complete cost report — an older period than most facilities report. Compare with that in mind.
FL AVG
$15.7M
Rank
#170 / 184 | $4.7M*Fiscal year ending 12/2022These figures are from this home's most recent complete cost report — an older period than most facilities report. Compare with that in mind.
Facility
$4.7M*Fiscal year ending 12/2022These figures are from this home's most recent complete cost report — an older period than most facilities report. Compare with that in mind.
FL AVG
$6.1M
Rank
#145 / 184 | 54.5%*Fiscal year ending 12/2022These figures are from this home's most recent complete cost report — an older period than most facilities report. Compare with that in mind.
Facility
54.5%*Fiscal year ending 12/2022These figures are from this home's most recent complete cost report — an older period than most facilities report. Compare with that in mind.
FL AVG
39.8%
Rank
#4 / 184 | 105546 | ||||
| The Towers Orlando | NH AL IL SNF | Orlando (Central Business District) | 168
Facility
168
FL AVG
88
Rank
#96 / 1058 |
88.0%
Facility
88.0%
FL AVG
84.4
Rank
#77 / 125 | +4% | 4.09
Facility
4.09
FL AVG
4.04
Rank
#76 / 181 | +71% | +1% | $0
Facility
$0
FL AVG
$78.9k
Rank
#1 / 185 | - | 11
Facility
11
FL AVG
19.7
Rank
#42 / 181 | 2.8
Facility
2.8
FL AVG
4.5
Rank
#34 / 181 | - | 148 | - |
96
Facility
96
FL AVG
40
Rank
#11 / 1487 | Orlando Lutheran Towers, Inc | $15.9MFiscal year ending 12/2023
Facility
$15.9MFiscal year ending 12/2023
FL AVG
$15.7M
Rank
#73 / 184 | $11.1MFiscal year ending 12/2023
Facility
$11.1MFiscal year ending 12/2023
FL AVG
$6.1M
Rank
#46 / 184 | 70%Fiscal year ending 12/2023
Facility
70%Fiscal year ending 12/2023
FL AVG
39.8%
Rank
#57 / 184 | 105731 | ||||
| Solaris Healthcare Celebration | NH SNF | Kissimmee (Green Project) | 120
Facility
120
FL AVG
88
Rank
#253 / 1058 |
95.0%
Facility
95.0%
FL AVG
84.4
Rank
#17 / 125 | +13% | 3.88
Facility
3.88
FL AVG
4.04
Rank
#104 / 181 | +44% | -4% | $0
Facility
$0
FL AVG
$78.9k
Rank
#1 / 185 | - | 16
Facility
16
FL AVG
19.7
Rank
#78 / 181 | 5.3
Facility
5.3
FL AVG
4.5
Rank
#127 / 181 | - | 114 | - |
13
Facility
13
FL AVG
40
Rank
#1204 / 1487 | Celebration Snf Operations Holdings LLC | $16.1M*Fiscal year ending 12/2022These figures are from this home's most recent complete cost report — an older period than most facilities report. Compare with that in mind.
Facility
$16.1M*Fiscal year ending 12/2022These figures are from this home's most recent complete cost report — an older period than most facilities report. Compare with that in mind.
FL AVG
$15.7M
Rank
#94 / 184 | $8.7M*Fiscal year ending 12/2022These figures are from this home's most recent complete cost report — an older period than most facilities report. Compare with that in mind.
Facility
$8.7M*Fiscal year ending 12/2022These figures are from this home's most recent complete cost report — an older period than most facilities report. Compare with that in mind.
FL AVG
$6.1M
Rank
#88 / 184 | 54.2%*Fiscal year ending 12/2022These figures are from this home's most recent complete cost report — an older period than most facilities report. Compare with that in mind.
Facility
54.2%*Fiscal year ending 12/2022These figures are from this home's most recent complete cost report — an older period than most facilities report. Compare with that in mind.
FL AVG
39.8%
Rank
#84 / 184 | 106127 | ||||
| Conway Lakes Health & Rehabilitation | NH SNF | Orlando (Dover Manor) | 120
Facility
120
FL AVG
88
Rank
#253 / 1058 |
95.7%
Facility
95.7%
FL AVG
84.4
Rank
#10 / 125 | +13% | 4.21
Facility
4.21
FL AVG
4.04
Rank
#60 / 181 | -11% | +4% | $94.7k
Facility
$94.7k
FL AVG
$78.9k
Rank
#168 / 185 | - | 31
Facility
31
FL AVG
19.7
Rank
#156 / 181 | 4.4
Facility
4.4
FL AVG
4.5
Rank
#97 / 181 | 3 | 115 | - |
10
Facility
10
FL AVG
40
Rank
#1264 / 1487 | Brittney Dumont | $16.3MFiscal year ending 12/2023
Facility
$16.3MFiscal year ending 12/2023
FL AVG
$15.7M
Rank
#106 / 184 | $9.0MFiscal year ending 12/2023
Facility
$9.0MFiscal year ending 12/2023
FL AVG
$6.1M
Rank
#81 / 184 | 55.2%Fiscal year ending 12/2023
Facility
55.2%Fiscal year ending 12/2023
FL AVG
39.8%
Rank
#58 / 184 | 105754 |
Conway Lakes Health & Rehabilitation is located in Orlando, Florida.
Here are the financial assistance programs available to residents in Florida.
Conway Lakes Health & Rehabilitation is in the Dover Manor neighborhood.
Conway Lakes Health & Rehabilitation has a walk score of 10. Car-dependent. Most errands require a car, with limited nearby walkable options.
Conway Lakes Health & Rehabilitation's occupancy is 95.5%.
No, Conway Lakes Health & Rehabilitation has a no-pet policy.
Conway Lakes Health & Rehabilitation is registered as a for-profit.
Yes — there are 10 photos of Conway Lakes Health & Rehabilitation in the photo gallery on this page.
Conway Lakes Health & Rehabilitation is located at 5201 Curry Ford Rd, Orlando, FL 32812.
Care Cost Calculator: See Prices in Your Area
Nursing Home Data Explorer
Don’t Wait Too Long: 7 Red Flag Signs Your Parent Needs Assisted Living Now
The True Cost of Assisted Living in 2025 – And How Families Are Paying For It
Understanding Senior Living Costs: Pricing Models, Discounts & Financial Assistance


