Total health inspections
8
California average 12.5
Last Health inspection on Jun 2025

We arrange tours, appointments, and even moving support so you don’t have to
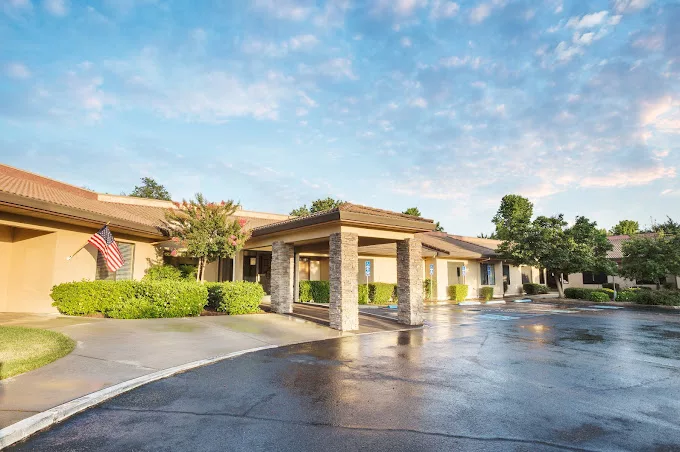
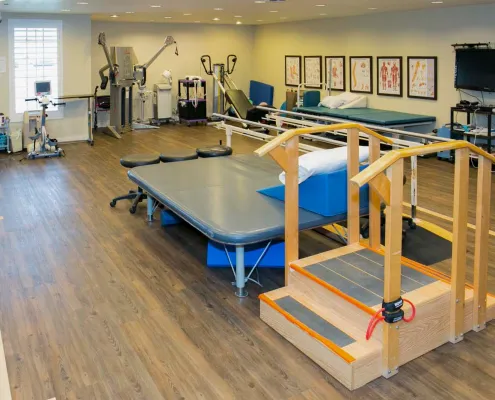
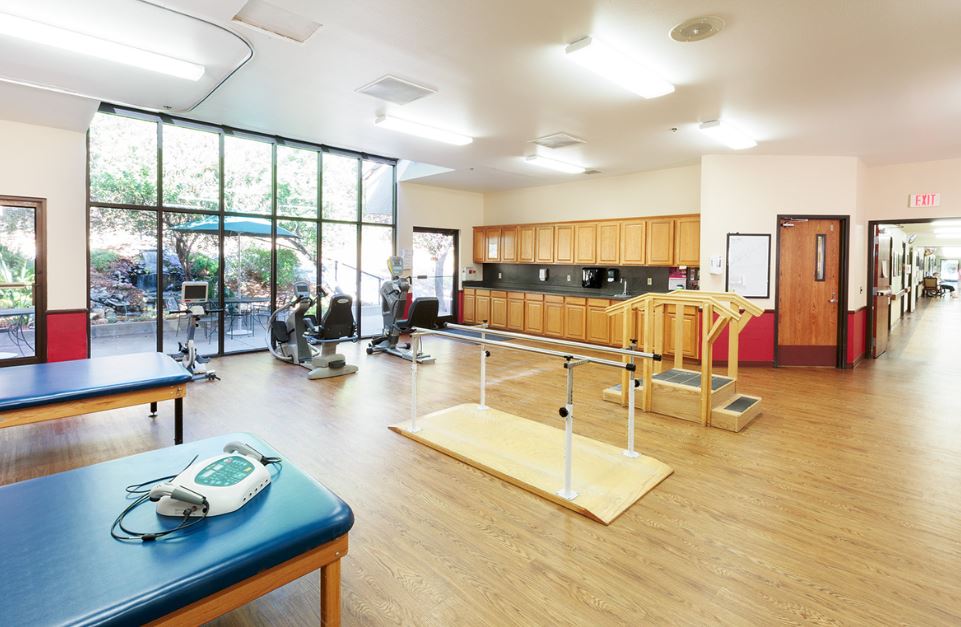
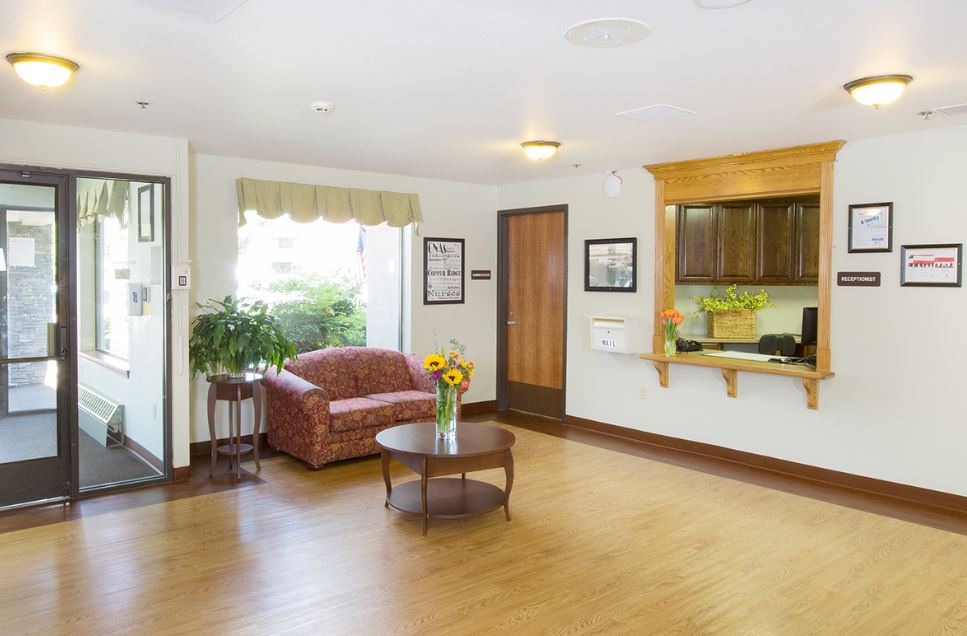
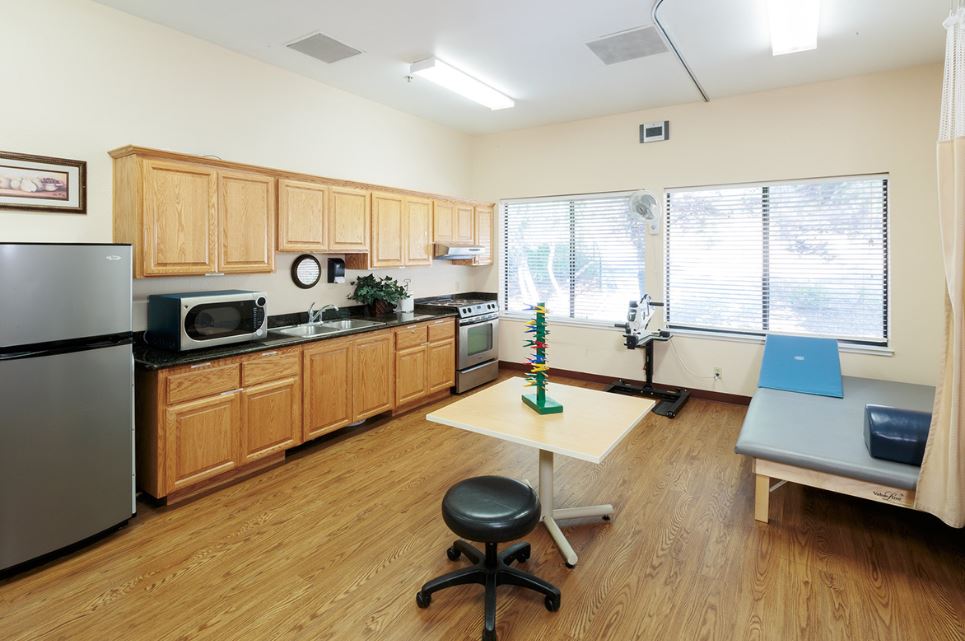
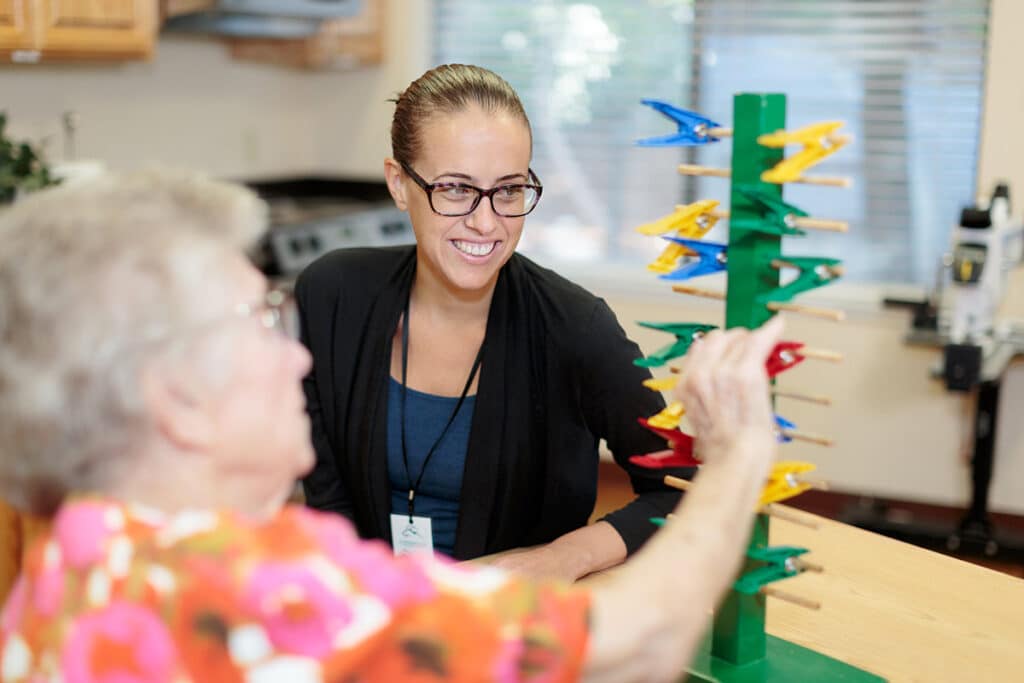
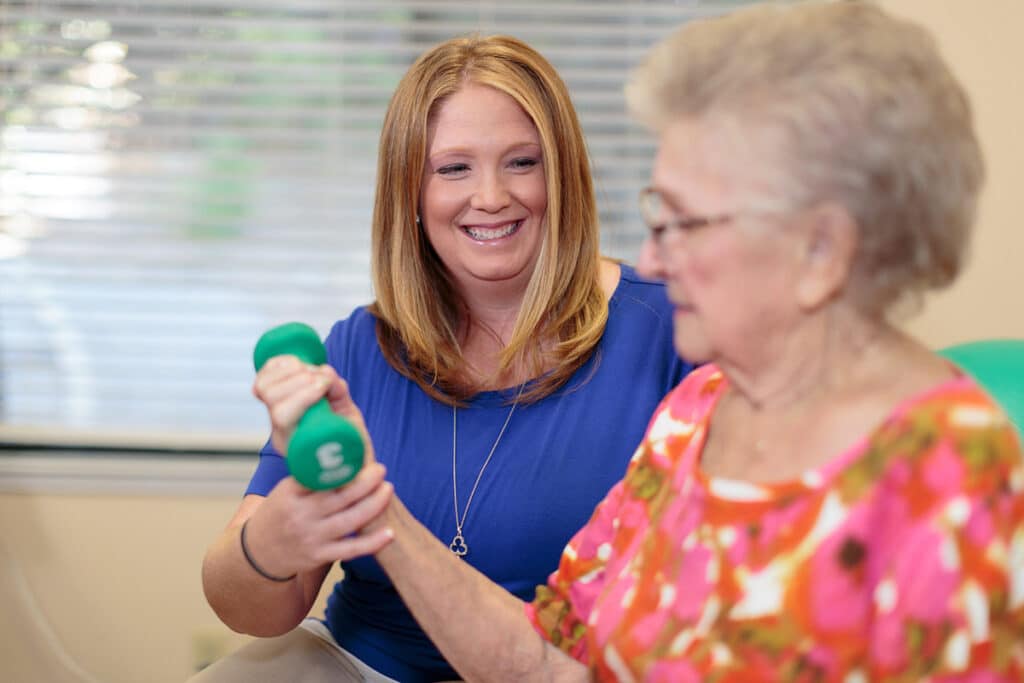


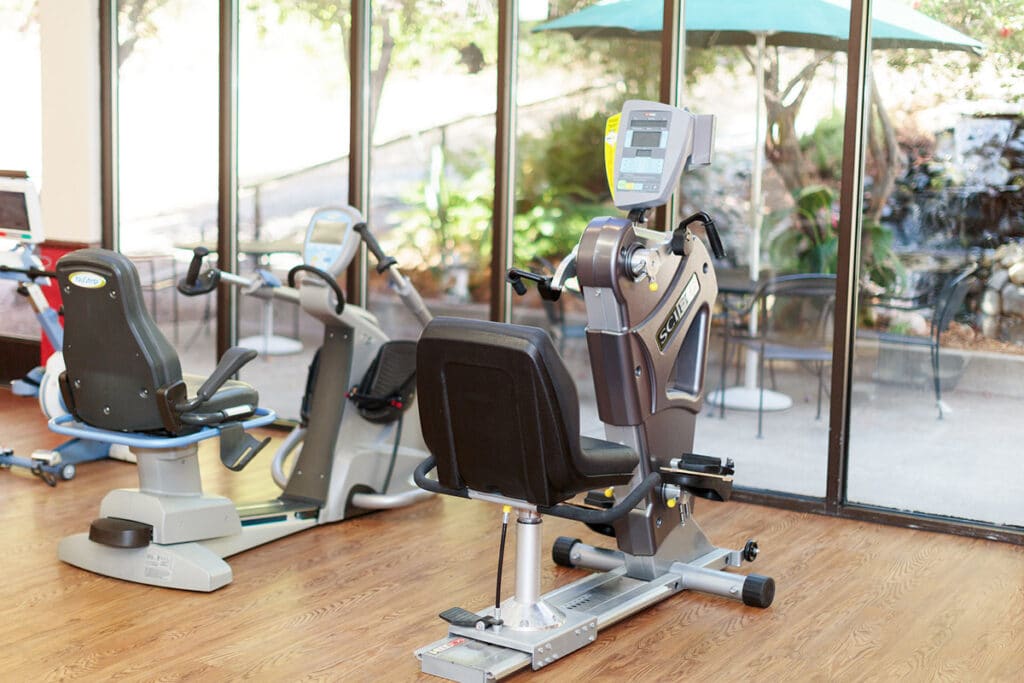
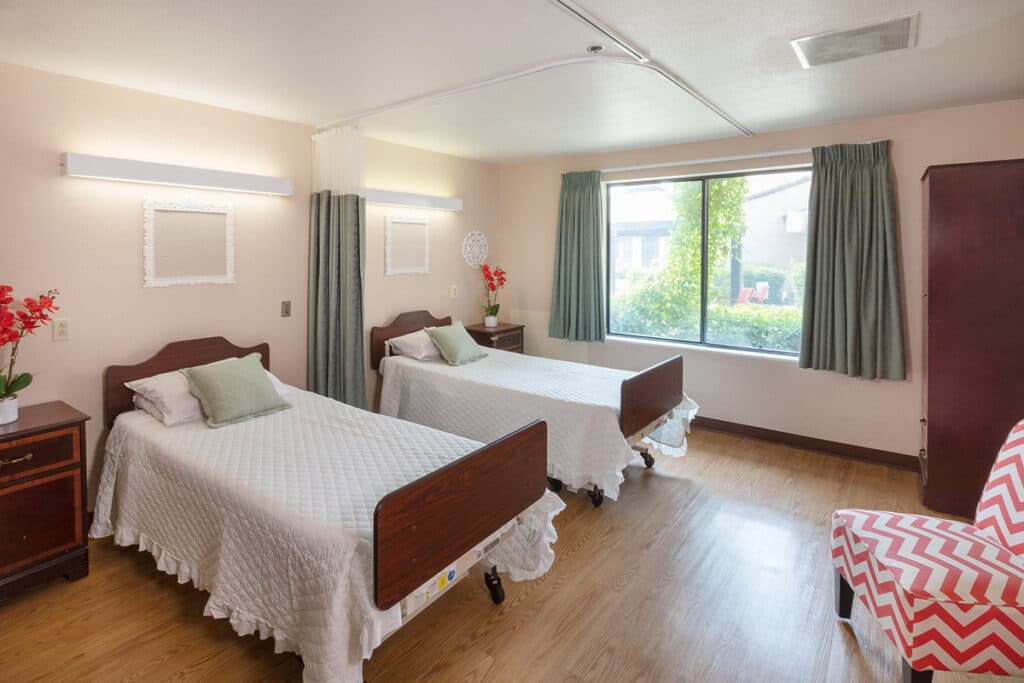
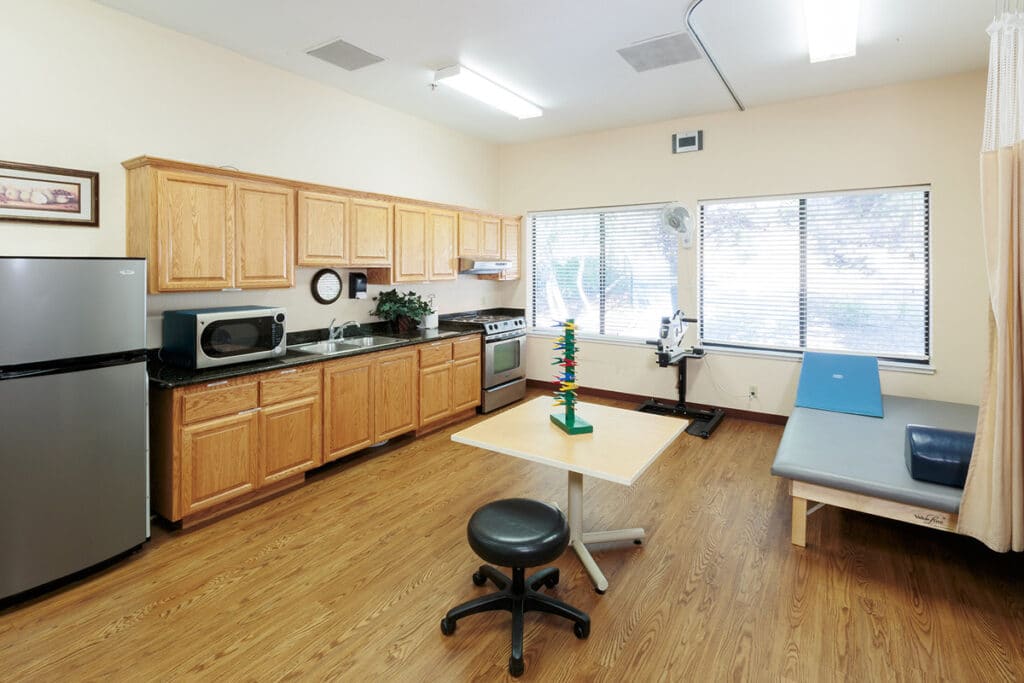
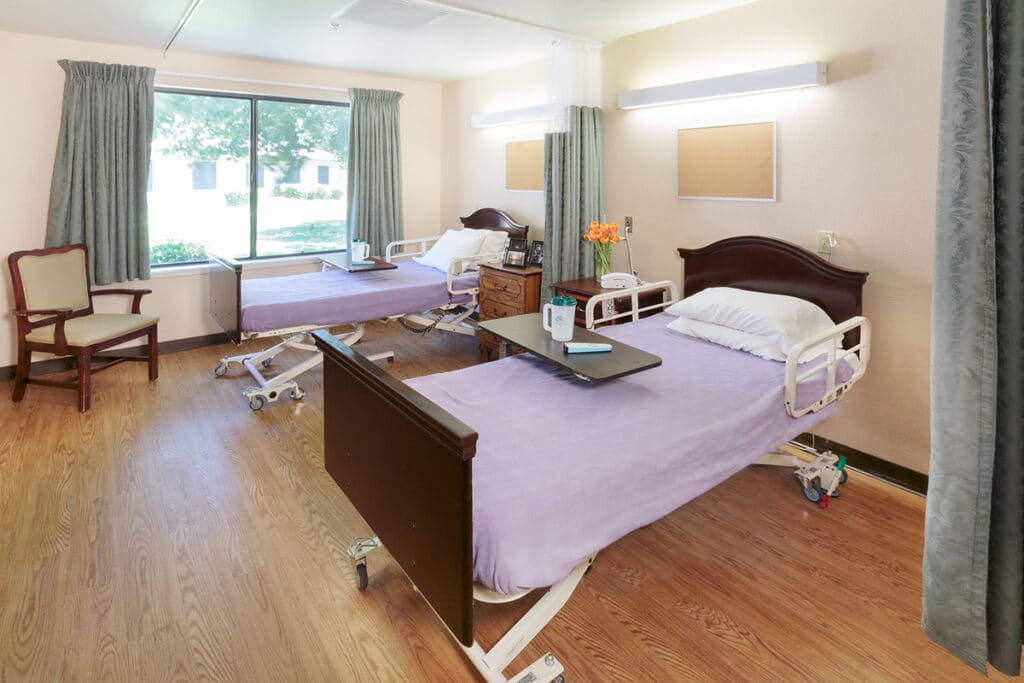
Tucked in Redding, California, Copper Ridge Care Center stands out for its exceptional nursing home physical therapy services, offering skilled nursing and post-acute rehab that goes beyond the ordinary. Their commitment to holistic care extends to occupational and speech therapy, emphasizing safety and wellness. This award-winning, five-star-rated Medicare facility reflects their dedication to seniors’ well-being, providing a trustworthy environment for rehabilitation and skilled nursing care.
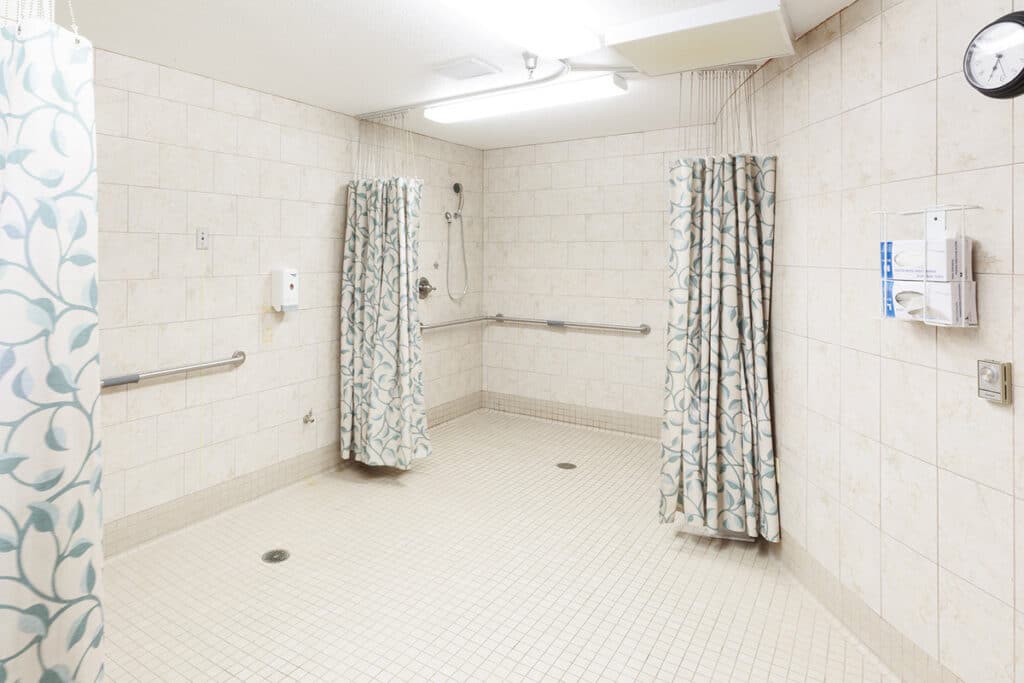
Conveniently located just off the 299 and 5 freeways, Copper Ridge Care Center offers seniors not only state-of-the-art rehab gyms and spacious courtyards but also top-notch 24/7 nursing care.
 Official CMS rating based on health inspections, staffing and quality measures.
Official CMS rating based on deficiencies found during state health inspections.
Official CMS rating based on nurse staffing hours per resident per day.
Official CMS rating based on clinical outcomes for residents.
Average daily nursing hours per resident (adjusted for acuity). Higher values indicate more nursing time per resident.
Hours of care per resident per day, broken down by staff type. Data from CMS Medicare.
Registered nurse hours per resident per day.
Official CMS rating based on health inspections, staffing and quality measures.
Official CMS rating based on deficiencies found during state health inspections.
Official CMS rating based on nurse staffing hours per resident per day.
Official CMS rating based on clinical outcomes for residents.
Average daily nursing hours per resident (adjusted for acuity). Higher values indicate more nursing time per resident.
Hours of care per resident per day, broken down by staff type. Data from CMS Medicare.
Registered nurse hours per resident per day.
Offers a balance of services and community atmosphere.
Occupancy is moderate, suggesting balanced demand.
Most residents typically stay for a few weeks or months before returning home or moving on.
72% of new residents, usually for short-term rehab.
27% of new residents, often for short stays.
1% of new residents, often for long-term daily care.
The portion of the home's budget spent on staff, including nurses, caregivers, and other employees who support care and operations.
All remaining costs needed to run the home, such as food, utilities, building maintenance, supplies and administrative expenses.
California average 12.5
Last Health inspection on Jun 2025
Health citations are formal notices following inspections when they fail to comply with safety and care standards.
12 of 19 citations resulted from standard inspections; and 7 of 19 resulted from complaint investigations.
California average: 0.4
California average: 1
Data sourced from CMS Health Deficiencies reports. Citation severity codes range from A (least serious) to L (most serious). Immediate Jeopardy (J-L) citations indicate situations where the facility's noncompliance has placed residents at risk of death or serious harm.
Assisted Living For seniors needing help with daily tasks but not full-time nursing.
Nursing Homes 24/7 care needed
Assisted Living For seniors needing help with daily tasks but not full-time nursing.
Nursing Homes 24/7 care needed
Nursing Home 24/7 care needed
Assisted Living For seniors needing help with daily tasks but not full-time nursing.
Copper Ridge Care Center 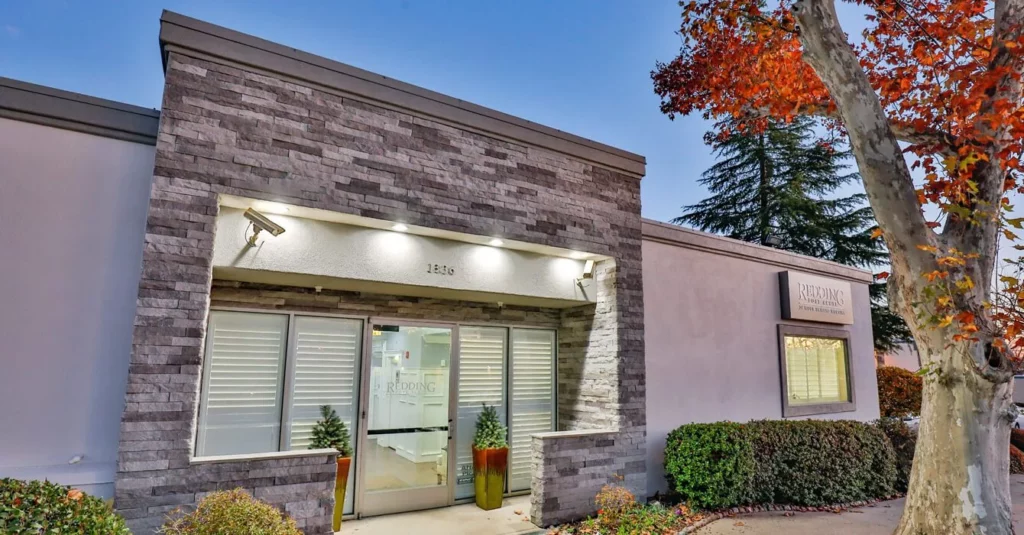 Redding Post Acute
![]() 2.2 miles from city center — 0.5 miles to nearest hospital (TLC Dermatology Medical Center Inc.)
2.2 miles from city center — 0.5 miles to nearest hospital (TLC Dermatology Medical Center Inc.)
![]() 201 Hartnell Ave, Redding, CA 96002
201 Hartnell Ave, Redding, CA 96002
Add your location
Source: CMS Payroll-Based Journal (Q2 2025)
| Role ⓘ | Count ⓘ | Avg Shift (hrs) ⓘ | Uses Contractors? ⓘ |
|---|---|---|---|
| Registered Nurse | 11 | 9.7 | No |
| Licensed Practical Nurse | 42 | 10 | No |
| Certified Nursing Assistant | 44 | 10.2 | No |
| Role ⓘ | Employees ⓘ | Contractors ⓘ | Total Staff ⓘ | Total Hours ⓘ | Days Worked ⓘ | % of Days ⓘ | Avg Shift (hrs) ⓘ |
|---|---|---|---|---|---|---|---|
| Licensed Practical Nurse | 42 | 0 | 42 | 16,703 | 91 | 100% | 10 |
| Certified Nursing Assistant | 44 | 0 | 44 | 15,994 | 91 | 100% | 10.2 |
| Registered Nurse | 11 | 0 | 11 | 2,910 | 88 | 97% | 9.7 |
| RN Director of Nursing | 5 | 0 | 5 | 2,357 | 82 | 90% | 7.5 |
| Dental Services Staff | 4 | 0 | 4 | 2,011 | 79 | 87% | 7.9 |
| Nurse Aide in Training | 11 | 0 | 11 | 1,579 | 76 | 84% | 7.5 |
| Other Dietary Services Staff | 4 | 0 | 4 | 988 | 82 | 90% | 7.4 |
| Dietitian | 1 | 0 | 1 | 625 | 70 | 77% | 8.9 |
| Occupational Therapy Aide | 1 | 0 | 1 | 599 | 83 | 91% | 7.2 |
| Administrator | 1 | 0 | 1 | 512 | 64 | 70% | 8 |
| Nurse Practitioner | 1 | 0 | 1 | 512 | 64 | 70% | 8 |
| Qualified Activities Professional | 1 | 0 | 1 | 465 | 58 | 64% | 8 |
| Clinical Nurse Specialist | 1 | 0 | 1 | 373 | 54 | 59% | 6.9 |
Source: CMS Long-Term Care Facility Characteristics (Data as of Jan 2026)
Residents meet regularly to discuss policies, care quality, and activities
State-approved Nurse Aide Training and Competency Evaluation Program on-site
Organized group of residents that meets regularly to discuss facility policies, quality of life, and activities.
Data sourced from CMS Long-Term Care Facility Characteristics quarterly report. Payer mix reflects the current resident census by primary payment source.
These measures show how residents usually do over time at this home, based on health outcomes and preventive care.
California average: 6.6
California average: 11.3
California average: 11.1%
California average: 12.0%
California average: 11.3%
California average: 1.7%
California average: 5.0%
California average: 1.2%
California average: 4.2%
California average: 6.7%
California average: 10.1%
California average: 98.5%
California average: 98.2%
California average: 2.25
California average: 1.59
California average: 94.0%
California average: 1.5%
California average: 93.2%
California average: 23.2%
California average: 11.2%
California average: 0.8%
California average: 53.7%
California average: 50.6%
Quality measures are calculated from Minimum Data Set (MDS) assessments. For most measures, lower percentages indicate better care quality.
Historical financial and operational data for Copper Ridge Care Center based on CMS SNF Cost Reports.
Loading trend charts...
Care Cost Calculator: See Prices in Your Area
Nursing Home Data Explorer
Don’t Wait Too Long: 7 Red Flag Signs Your Parent Needs Assisted Living Now
The True Cost of Assisted Living in 2025 – And How Families Are Paying For It
Understanding Senior Living Costs: Pricing Models, Discounts & Financial Assistance

Touring a community? Use this expert-backed checklist to stay organized, ask the right questions, and find the perfect fit.
We'll send you a PDF version of the touring checklist.