Redding Post Acute
Nursing Home & Skilled Nursing · Redding, CA
CMS overall rating Info The Overall CMS Rating is scored from 1 to 5 stars and combines results from health inspections, staffing levels, and quality measures. Health inspections carry the most weight. Staffing and quality scores can increase or decrease the final rating based on performance compared to state and national standards.

Redding Post Acute

Nursing Home & Skilled Nursing · Redding, CA
CMS overall rating Info The Overall CMS Rating is scored from 1 to 5 stars and combines results from health inspections, staffing levels, and quality measures. Health inspections carry the most weight. Staffing and quality scores can increase or decrease the final rating based on performance compared to state and national standards.
Calculator: See prices in your area
Redding Post Acute accepts Medicare, Medicaid, and private pay.

Overview of Redding Post Acute

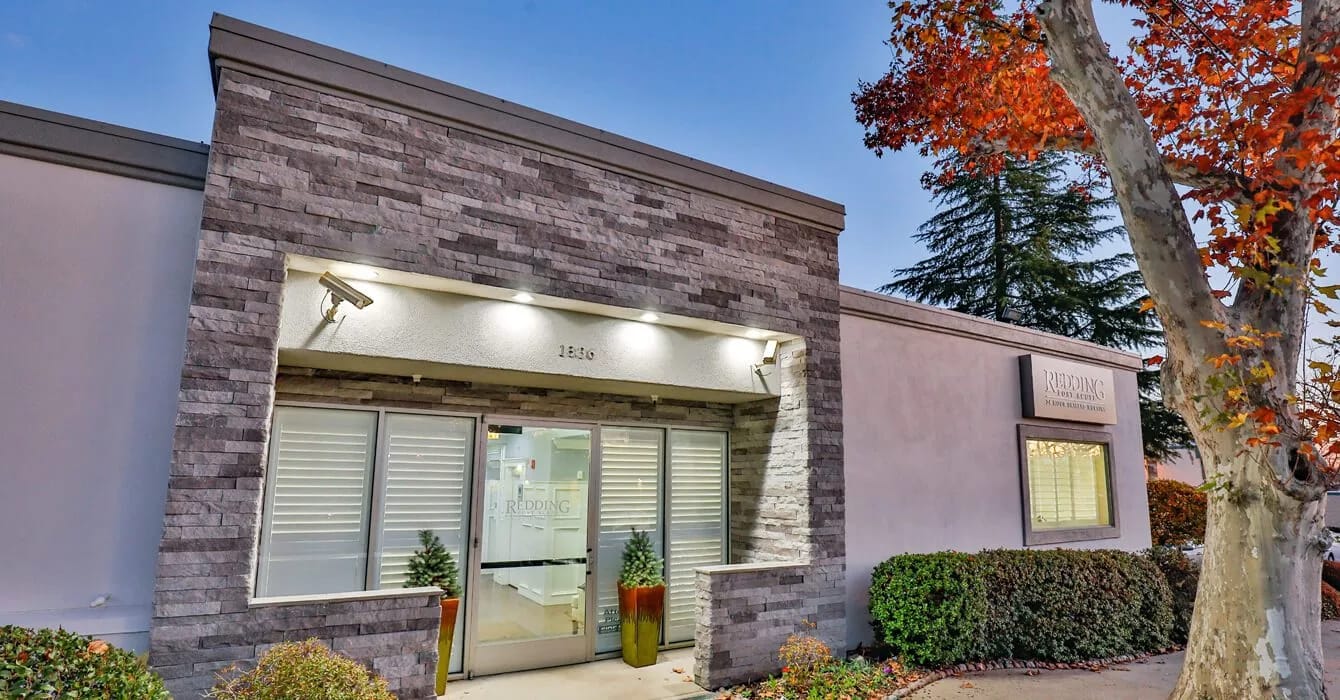
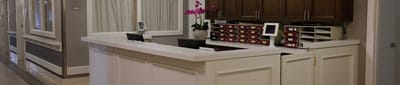
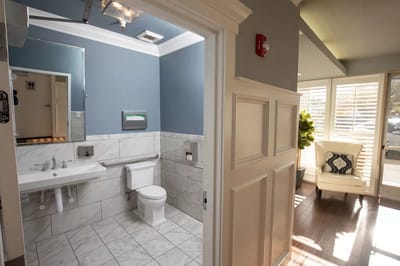
In the heart of California, Redding Post Acute offers a comprehensive range of services catering to seniors, including nursing services, rehabilitation, and post-acute care. Having undergone recent renovations in 2016, this facility has been repurposed to serve as a state-of-the-art short-term rehabilitation center, reflecting its commitment to modern and top-tier care. With a prestigious five-star rating, Redding Post Acute stands out as a trusted facility in the region, providing unparalleled 24-hour skilled nursing that includes specialized services like infection prevention, catheter care, wound care, IV therapy, and more.

Beyond medical care, Redding Post Acute believes in enhancing the overall well-being of its residents by offering engaging programs and activities. From respite stays to various tailored initiatives, this facility goes beyond the conventional, ensuring a vibrant community that fosters both health and happiness. Redding Post Acute sets the standard for nursing home activities, senior living, and nursing home qualifications.

(530) 241-6756

Quality ratings

Measured by Centers for Medicare & Medicaid Services (CMS)

Overall rating Info The Overall CMS Rating combines results from health inspections, staffing levels and quality measures. Health inspections carry the most weight. Staffing and quality scores can increase or decrease the final rating based on performance compared to state and national standards.
▲ 38.9% Above CA avg. ▲ 38.9% Above CA avg.Click the badge to see the full State ranking.Click here to see the full State ranking.
Health Inspection Info Based on the results of the facility's three most recent standard inspections and any complaint investigations. CMS reviews the number, scope, and severity of deficiencies, with more recent findings weighted more heavily.
▲ 27.0% Above CA avg. ▲ 27.0% Above CA avg.Click the badge to see the full State ranking.Click here to see the full State ranking.
Staffing Info Measures average nursing staff hours per resident per day, including Registered Nurses (RNs) and total nursing staff. Ratings are adjusted based on the level of care residents require and are compared to state and national benchmarks.
▼ 42.0% Below CA avg. ▼ 42.0% Below CA avg.Click the badge to see the full State ranking.Click here to see the full State ranking.
Quality Measures Info Based on clinical and physical health indicators reported to CMS, such as hospital readmissions, falls, pressure ulcers, and improvements in mobility. These measures reflect how well residents' health needs are being managed.
▲ 17.4% Above CA avg. ▲ 17.4% Above CA avg.Click the badge to see the full State ranking.Click here to see the full State ranking.

Staffing hours breakdown

Info Daily nursing hours per resident by staff type, reported to CMS. Higher is generally better — compare this facility to state and national averages to see where staffing stands.

Hours per resident per day — compared to California state averages

Total nursing care / resident Info This home is ranked 158th out of 346 homes in California. Total adjusted nursing hours per resident per day, combining RN, LPN, and aide time. CMS adjusts this for case-mix so facilities can be fairly compared.
4h 6m per day
Rank #158 / 346Nurse hours — State benchmarkedThis home is ranked 158th out of 346 homes in California. Shows adjusted nurse hours per resident per day benchmarked to the California average, with a ranking across 346 California SNFs. More hours mean more direct care. The national average is about 3.5 hrs; below 3.0 is a red flag.Click the rank badge to see the full State ranking.Click here to see the full State ranking.
This facility California avg (4h 23m per day)
vs California avg
-6%

3 of 6 metrics below state avg

Standout metric LPN / LVN is +22% above state avg
Staff typeHours / Day / Residentvs state avg
Registered Nurse (RN) Info RNs hold the highest nursing license and can assess residents, interpret test results, and direct care plans. More RN hours per day often signals stronger clinical oversight and faster response to health changes. 18m per day ▼ 54% State avg: 39m per day · National avg: 41m per day
LPN / LVN Info Licensed Practical Nurses (LPNs) or Licensed Vocational Nurses (LVNs) deliver routine hands-on care — medication administration, wound dressing, and monitoring vital signs. They work under RN supervision and make up a large share of daily bedside care. 1h 29m per day ▲ 22% State avg: 1h 13m per day · National avg: 52m per day
Nurse Aide Info Certified Nurse Aides (CNAs) provide the most direct day-to-day assistance: bathing, dressing, feeding, and mobility. Nurse aide hours are typically the largest staffing category and directly affect residents' quality of life. 2h 42m per day ■ Avg State avg: 2h 39m per day · National avg: 2h 21m per day
Total Nursing (Weekend) Info Combined nursing hours (RN + LPN + Nurse Aide) per resident per day on weekends. Staffing often drops on weekends — this figure reveals whether the facility maintains adequate coverage outside of weekday hours. 3h 59m per day ■ Avg State avg: 4h 5m per day · National avg: 3h 26m per day
Physical Therapist Info Hours per resident per day provided by licensed Physical Therapists (PTs) or PT Assistants. PT services help residents recover mobility after injury or illness and are especially important for post-acute (short-stay) rehabilitation. 2m per day ▼ 60% State avg: 5m per day · National avg: 4m per day
RN (Weekend) Info Registered nurse hours specifically on weekends. Facilities sometimes reduce RN presence on Saturdays and Sundays — a low weekend RN figure compared to weekday hours can indicate reduced clinical oversight when most administrative staff are absent. 9m per day ▼ 70% State avg: 30m per day · National avg: 29m per day

Types of Care at Redding Post Acute

Skilled Nursing

Capacity and availability

This home usually has availability

Occupancy lower than 85% suggests more openings may be available.

Lower occupancy than the California average: 84.7%
Occupancy rate 60.7% Rank #308 / 351Occupancy rate — State benchmarkedThis home is ranked 308th out of 351 homes in California. Shows this facility's occupancy rate versus the California average, with its Statewide rank out of 351. Higher occupancy signals strong local demand and financial stability.Click the rank badge to see the full State ranking.Click here to see the full State ranking.
Avg. Length of Stay 122 days
Occupancy rate
60.7% Rank #308 / 351Occupancy rate — State benchmarkedThis home is ranked 308th out of 351 homes in California. Shows this facility's occupancy rate versus the California average, with its Statewide rank out of 351. Higher occupancy signals strong local demand and financial stability.Click the rank badge to see the full State ranking.Click here to see the full State ranking.
Avg. Length of Stay
122 days
Walk Score
Walk Score: 86 / 100 Rank #58 / 359Walk Score — State benchmarkedThis home is ranked 58th out of 359 homes in California. Shows how walkable this facility's neighborhood is compared to the average Walk Score across California SNFs. Higher scores benefit residents, families, and staff.Click the rank badge to see the full State ranking.Click here to see the full State ranking.
Very walkable. Most errands can be accomplished on foot, and many essentials are within a short walk.
BBB Rating
BBB Rating: A+ (Not Accredited)
An independent rating from the Better Business Bureau based on factors such as complaint history, transparency, and business practices.
How BBB ratings work

About this community

License Details

CMS Certification Number55510

Therapy & Rehabilitation

1 service
Rehabilitation Services

Staffing & Medical

1 service
24-Hour Staffing

Amenities & Lifestyle

Specific ProgramsPost-Acute Care, Activities Program
Operating HoursOpen 24/7

Contact Redding Post Acute

Inspection History

In California, the Department of Social Services (for assisted living facilities) and the Department of Public Health (for nursing homes) conduct inspections to ensure resident safety and regulatory compliance.

Since 2019 · 7 years of data 13 citations 0 complaint visits

Inspection Scorecard Info This scorecard compares key inspection, citation, and complaint metrics at this facility against the California state average. Metrics rated ≥15% worse than average are highlighted in red; those ≥15% better are highlighted in green.

Since 2019 vs. California state average
Overall vs. CA average 2 Worse Metrics worse than California average:
• Total citations (30% above)
• Citations per year (36% above)
3 Better Metrics better than California average:
• Total visits (100% below)
• Complaint visits (100% below)
• Other visits (100% below)
Latest Inspection March 6, 2025 Routine

Citations Info Citations are formal regulatory issues recorded during state inspections.

This FacilityCA Averagevs. CA Avg
Total citations Info Formal regulatory issues recorded by inspectors across all inspection types. 1310 This facility has 30% more total citations than a typical California nursing home (13 vs. CA avg 10).↑ 30% worse
Citations per year Info Average citations per year since 2019. 1.91.4 This facility has 36% more citations per year than a typical California nursing home (1.9 vs. CA avg 1.4).↑ 36% worse

Inspections & Visits Info State inspections evaluate whether the facility meets health and safety standards.

This FacilityCA Averagevs. CA Avg
Total visits Info Combined count of complaint visits, other regulatory visits, and official scheduled inspections. 016 This facility has 100% fewer total visits than a typical California nursing home (0 vs. CA avg 16).↓ 100% better
Complaint visits Info On-site visits triggered by formal complaints filed by residents, families, or staff. 013 This facility has 100% fewer complaint visits than a typical California nursing home (0 vs. CA avg 13).↓ 100% better
Other visits Info Regulatory visits that are neither routine inspections nor complaint investigations — administrative check-ins, follow-up reviews, licensing-related visits. 07 This facility has 100% fewer other visits than a typical California nursing home (0 vs. CA avg 7).↓ 100% better

Inspection Reports Summary Info An editor-reviewed summary of the themes and findings across this facility's recent inspection reports.

This facility’s inspection record is mixed, with repeated failures in resident care, documentation, and procedural follow-through. The most recent inspection on March 6, 2025, cited one deficiency for delayed x-ray result reporting that caused unnecessary severe pain. Earlier investigations substantiated neglect in continence and feeding care, missed written notice for a room change, and inaccurate assessments of mental health screenings, showing inconsistent compliance over time.

Read the full inspection reports for this facility, including detailed findings and corrective actions.

Show Inspection Reports

Health Inspection History

Inspections Since 2019
Total health inspections 8

California average 12.5


Last Health inspection on Mar 2025

Total health citations
20 Rank #39 / 354Health citations — State benchmarkedThis home is ranked 39th out of 354 homes in California. Shows this facility's total health deficiency citations benchmarked to the California State average, with a ranking across all 354 CA SNFs. Lower citation counts earn a better rank.Click the rank badge to see the full State ranking.Click here to see the full State ranking.

California average 50.2

Citations per inspection
2.5 Rank #30 / 354Citations per inspection — State benchmarkedThis home is ranked 30th out of 354 homes in California. Shows average deficiency citations per CMS inspection for this facility versus the California mean across 354 SNFs with citation data. Lower is better.Click the rank badge to see the full State ranking.Click here to see the full State ranking.

California average 4.65


Health citations are formal notices following inspections when they fail to comply with safety and care standards.

10 of 20 citations resulted from standard inspections; and 10 of 20 resulted from complaint investigations.

Breakdown of citation severity (last 7 years)
Critical Health citations
0
100% better than California average

California average: 0.4


Serious Health citations
0
100% better than California average

California average: 1

0 critical citations California average: 0.4

0 serious citations California average: 1

20 moderate citations California average: 47.2

0 minor citations California average: 1.5
Citations history (last 7 years)
Quality of Care moderate citation Mar 06, 2025
Corrected

Resident Rights moderate citation Jan 17, 2025
Corrected

Care Planning moderate citation Nov 21, 2024
Corrected

Care Planning moderate citation Nov 21, 2024
Corrected

Staffing Data

Reporting period: October 1 – December 31, 2025 (Q4 2025). Source: CMS Payroll-Based Journal report.

Total staff 213
Employees 116
Contractors 97
Staff to resident ratio 2.54:1
2535614% better than California average
California average ratio: 0.00:1 California average ratio: 0.00:1See full California ranking
Avg staff/day 51
Average shift 8.7 hours
13% better than California average
California average: 7.7 hours California average shift: 7.7 hoursSee full California ranking
Total staff hours (quarter) 41,045

Nursing staff breakdown

Q4 2025 · Oct 1 – Dec 31 More info This data comes from the CMS Payroll-Based Journal report covering October 1 – December 31, 2025.
Registered Nurse

Manages medical care and health needs.

Total count 4
Average shift length Info Average shift length. Calculated as total hours divided by days worked and average staff per day. 10.6 hours

No contractors work on this role.

Licensed Practical Nurse

Assists with medical care and medications.

Total count 52
Average shift length Info Average shift length. Calculated as total hours divided by days worked and average staff per day. 9.2 hours

This role is partially covered by contractors.

Certified Nursing Assistant

Helps with daily care and mobility.

Total count 116
Average shift length Info Average shift length. Calculated as total hours divided by days worked and average staff per day. 9.5 hours

This role is partially covered by contractors.

Contractor staffing

Q4 2025 · Oct 1 – Dec 31 More info This data comes from the CMS Payroll-Based Journal report covering October 1 – December 31, 2025.

Total hours from contractors

15%

6,152 contractor hours this quarter

Certified Nursing Assistant: 41 Licensed Practical Nurse: 31 Physical Therapy Aide: 6 Speech Language Pathologist: 6 Physical Therapy Assistant: 6 Qualified Social Worker: 2 Respiratory Therapy Technician: 2 Occupational Therapy Aide: 1 Medical Director: 1 Occupational Therapy Assistant: 1

Staff by category

Q4 2025 · Oct 1 – Dec 31 More info This data comes from the CMS Payroll-Based Journal report covering October 1 – December 31, 2025.
Certified Nursing Assistant754111620,83092100%9.5
Licensed Practical Nurse2131529,12092100%9.2
RN Director of Nursing4041,9446470%8
Other Dietary Services Staff6061,5949199%7.9
Speech Language Pathologist0661,3607582%6.5
Physical Therapy Aide0661,2306975%7.5
Registered Nurse4041,1028795%10.6
Qualified Activities Professional3031,0339199%6.6
Nurse Practitioner1015607076%8
Mental Health Service Worker1015126470%8
Administrator1014565762%8
Qualified Social Worker0224166065%6.9
Respiratory Therapy Technician0222956166%4.4
Physical Therapy Assistant0661975964%3
Occupational Therapy Aide0111893033%6.3
Medical Director0111402628%5.4
Occupational Therapy Assistant011671314%5.1
116 Certified Nursing Assistant
% of Days 100%
52 Licensed Practical Nurse
% of Days 100%
4 RN Director of Nursing
% of Days 70%
6 Other Dietary Services Staff
% of Days 99%
6 Speech Language Pathologist
% of Days 82%
6 Physical Therapy Aide
% of Days 75%
4 Registered Nurse
% of Days 95%
3 Qualified Activities Professional
% of Days 99%
1 Nurse Practitioner
% of Days 76%
1 Mental Health Service Worker
% of Days 70%
1 Administrator
% of Days 62%
2 Qualified Social Worker
% of Days 65%
2 Respiratory Therapy Technician
% of Days 66%
6 Physical Therapy Assistant
% of Days 64%
1 Occupational Therapy Aide
% of Days 33%
1 Medical Director
% of Days 28%
1 Occupational Therapy Assistant
% of Days 14%

Penalties and fines

Federal penalties imposed by CMS for regulatory violations, including civil money penalties (fines) and denials of payment for new Medicare/Medicaid admissions.

Source: CMS Penalties Database

No penalties in the past 3 years

No civil money penalties or payment denials were reported in the last 3 years.

Quality of care over time

These measures show how residents usually do over time at this home, based on health outcomes and preventive care.

High-risk clinical events score Info A composite score based on pressure ulcers, falls with injury, weight loss, walking ability decline, and activities of daily living decline. 9.2
39% worse than California average

California average: 6.6

Functional decline score Info A composite score based on activities of daily living decline, walking ability decline, and incontinence. 17.5
55% worse than California average

California average: 11.3

Long-stay resident measures
Significantly above average California avg: 4.2 Info CMS star rating based on long-stay quality measure performance. 5 stars = significantly above average, 1 star = significantly below average.
Need for Help with Daily Activities Increased Info Percent of long-stay residents whose need for help with daily activities has increased 9.3%
16% better than California average

California average: 11.1%

Walking Ability Worsened Info Percent of long-stay residents whose ability to move independently worsened 25.4%
112% worse than California average

California average: 12.0%

Low Risk Residents with Bowel/Bladder Incontinence Info Percent of low risk long-stay residents who lose control of their bowels or bladder 17.9%
59% worse than California average

California average: 11.3%

Falls with Major Injury Info Percent of long-stay residents experiencing one or more falls with major injury 4.1%
146% worse than California average

California average: 1.7%

High Risk Residents with Pressure Ulcers Info Percent of long-stay high risk residents with pressure ulcers 3.8%
24% better than California average

California average: 5.0%

Urinary Tract Infection Info Percent of long-stay residents with a urinary tract infection 1.0%
21% better than California average

California average: 1.2%

Lost Too Much Weight Info Percent of long-stay residents who lose too much weight 3.5%
18% better than California average

California average: 4.2%

Depressive Symptoms Info Percent of long-stay residents who have depressive symptoms 0.5%
92% better than California average

California average: 6.7%

Antipsychotic Use Info Percent of long-stay residents who received an antipsychotic medication 7.8%
23% better than California average

California average: 10.1%

Pneumococcal Vaccine Info Percent of long-stay residents assessed and appropriately given the pneumococcal vaccine 100.0%
In line with California average

California average: 98.5%

Influenza Vaccine Info Percent of long-stay residents assessed and appropriately given the seasonal influenza vaccine 100.0%
In line with California average

California average: 98.2%

Hospitalizations per 1,000 days Info Number of hospitalizations per 1,000 long-stay resident days. 1.10
51% better than California average

California average: 2.25

ED visits per 1,000 days Info Number of outpatient emergency department visits per 1,000 long-stay resident days. 0.65
59% better than California average

California average: 1.59

Short-stay resident measures
Above average California avg: 3.5 Info CMS star rating based on short-stay quality measure performance. 5 stars = much above average, 1 star = much below average.
Pneumococcal Vaccine Info Percent of short-stay residents assessed and appropriately given the pneumococcal vaccine 100.0%
6% better than California average

California average: 94.0%

Antipsychotic medication increase Info Percent of short-stay residents who newly received an antipsychotic medication 0.5%
66% better than California average

California average: 1.5%

Influenza Vaccine Info Percent of short-stay residents assessed and appropriately given the seasonal influenza vaccine 100.0%
7% better than California average

California average: 93.2%

Re-hospitalized after SNF stay Info Percentage of short-stay residents who were re-hospitalized after their nursing home admission. 18.1%
22% better than California average

California average: 23.2%

Emergency department visits Info Percentage of short-stay residents who had an outpatient emergency department visit. 15.3%
37% worse than California average

California average: 11.2%

Falls with major injury Info Percentage of SNF residents who experience falls with major injury during their stay. 1.5%
94% worse than California average

California average: 0.8%

Ability to care for self at discharge Info Percentage of residents at or above expected ability to care for themselves at discharge. 53.3%
In line with California average

California average: 53.7%

Successful return to home or community Info Rate of successful return to home or community from a skilled nursing facility. 61.0%
21% better than California average

California average: 50.6%

Breakdown by payment type

Medicare

68% of new residents, usually for short-term rehab.

Typical stay 1 - 2 months

Private pay

25% of new residents, often for short stays.

Typical stay 18 days

Medicaid

7% of new residents, often for long-term daily care.

Typical stay 3 - 4 years

Facility Characteristics

Source: CMS Long-Term Care Facility Characteristics (Data as of Jan 2026)

Total residents 84
Medicare
30
35.7% of residents
Medicaid
53
63.1% of residents
Private pay or other
1
1.2% of residents
Programs & Services
Residents Group

Residents meet regularly to discuss policies, care quality, and activities

Active Resident Council

Organized group of residents that meets regularly to discuss facility policies, quality of life, and activities.

Finances and operations

Privately-owned community
Operated by a business corporation.
Home revenue
$11.7M
Profit
$485.4K
Privately-owned community Operated by a business corporation.
Home revenue
$11.7M Rank #257 / 347Revenue — State benchmarkedThis home is ranked 257th out of 347 homes in California. Shows this facility's annual revenue compared to the California SNF average. Higher revenue generally means more resources for staffing and capital — read alongside Payroll %.Click the rank badge to see the full State ranking.Click here to see the full State ranking.
Profit
$485.4K
Payroll costs Info The portion of the home's budget spent on staff, including nurses, caregivers, and other employees who support care and operations. Rank #236 / 347Payroll — State benchmarkedThis home is ranked 236th out of 347 homes in California. Shows total annual staff payroll benchmarked to the California average. Higher payroll investment relative to peers often signals better staffing and less reliance on cheaper contract labor.Click the rank badge to see the full State ranking.Click here to see the full State ranking.
$6.7M
56.8% of revenue Rank #101 / 347Payroll % — State benchmarkedThis home is ranked 101st out of 347 homes in California. Shows payroll as a percentage of revenue versus the California average. Well-run California SNFs typically land around 56–67% — the top third Statewide. Below 25% may signal understaffing or heavy agency use — read with Staffing ratings.Click the rank badge to see the full State ranking.Click here to see the full State ranking.
Other operating costs Info All remaining costs needed to run the home, such as food, utilities, building maintenance, supplies and administrative expenses.
$4.6M
Total costs $11.2M

Who this home usually serves

TYPE OF STAY

Mostly short-term rehab stays

Most residents typically stay for a few weeks or months before returning home or moving on.

Places of interest near Redding Post Acute

Address 0.9 miles from city center Info Estimated distance in miles from Redding's city center to Redding Post Acute's address, calculated via Google Maps. — 0.06 miles to nearest hospital (Dignity Health Advanced Imaging - North State)

Calculate Travel Distance to Redding Post Acute

Add your location

Address

Financial Assistance for
Nursing Home in California

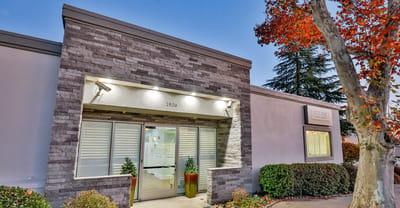
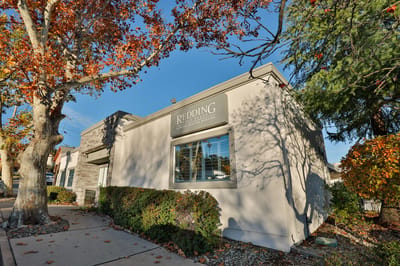
Redding Post Acute is located in Redding, California.
Here are the financial assistance programs available to residents in California.

Get Financial aid guidance

Multipurpose Senior Services Program

MSSP (Medi-Cal Waiver)

Age 65+
General California resident, Medi-Cal eligible, nursing home risk.
Income Limits (2025) ~$2,829/month 300% FBR, individual
Asset Limits $2,000 (individual), $3,000 (couple).
CA

County-managed; waitlists possible.

Benefits
In-home support (4-6 hours/day) Respite care (14 days/year) Meals (~$6/meal) Transportation (8 trips/month) Care management

In-Home Supportive Services (IHSS)

California IHSS

Age 65+
General California resident, Medicaid-eligible or low-income.
Income Limits ~$1,732/month individual, Medi-Cal threshold
Asset Limits $2,000 individual
CA

Can hire family as caregivers.

Benefits
Personal care (up to 283 hours/month) Homemaker services Respite (varies)

Multipurpose Senior Services Program (MSSP)

CA MSSP

Age 65+
General California resident, Medi-Cal-eligible, nursing home-eligible but community-capable.
Income Limits ~$2,829/month 300% FBR, individual
Asset Limits $2,000 individual
CA

Available in 38 counties; waitlists common.

Benefits
Case management Respite care (up to 10 days/year) Minor home mods (avg. $500) Adult day care (~$50/day)

Property Tax Postponement Program (PTP)

CA PTP

Age 62+
General California resident, own and live in home, 40% equity.
Income Limits (2025) ~$51,500/year household, adjusted annually
Asset Limits Equity-based; no strict asset cap.
CA

Deferred taxes accrue interest (5% as of 2024); repaid upon sale/death.

Benefits
Property tax deferral (avg. $1,000-$3,000/year, varies by county)

Assisted Living Waiver (ALW)

CA ALW

Age 65+ or disabled
General California resident, Medi-Cal-eligible, nursing home-eligible.
Income Limits ~$2,829/month 300% FBR, individual
Asset Limits $2,000 individual
CA

Available in 15 counties (e.g., LA, Sacramento); waitlists common.

Benefits
Personal care in ALFs (5-7 hours/day) Medication management Social services

California CARES Program

CA CARES

Age
General Caregivers of California residents 60+ needing help with 3+ daily activities; no caregiver age limit.
Income Limits No strict limit; cost-sharing above ~$2,500/month threshold.
Asset Limits Not applicable; need-based.
CA

High demand in urban areas; complements IHSS respite.

Benefits
Respite care (up to 10 days/year) Counseling (4-6 sessions/year) Training (2-3 workshops/year) Supplies (~$200/year)

Compare Nursing Home around Redding

The information below is reported by the California Department of Social Services and Department of Public Health.

2 facilities compared · CMS & CA Dept. of Health data

Filter by care type
Copper Ridge Care Center
NH

Nursing Home Licensed facility providing 24/7 skilled nursing care for residents with complex, ongoing medical needs. Staffed by RNs, LPNs, and CNAs. Inspected and star-rated annually by CMS. Accepts Medicare (short-term rehab) and Medicaid (long-term care).

AL

Assisted Living A licensed, long-term care setting for seniors or individuals with disabilities who need help with daily activities — like bathing, dressing, and medication management — but not 24-hour skilled nursing. Offers housing, meals, and around-the-clock support while aiming to maximize resident independence.

Redding (Bechelli)125 89.4% +6%3.47 -23%-18%$0192.41116- 59 Darrell Thompson$26.7M$11.1M41.4%555316
Redding Post Acute
NH

Nursing Home Licensed facility providing 24/7 skilled nursing care for residents with complex, ongoing medical needs. Staffed by RNs, LPNs, and CNAs. Inspected and star-rated annually by CMS. Accepts Medicare (short-term rehab) and Medicaid (long-term care).

AL

Assisted Living A licensed, long-term care setting for seniors or individuals with disabilities who need help with daily activities — like bathing, dressing, and medication management — but not 24-hour skilled nursing. Offers housing, meals, and around-the-clock support while aiming to maximize resident independence.

Redding (Downtown)89 78.1% -8%4.10 -78%-3%$3.3k202.5-82A+ 86 Valley Capital Investments LLC$11.7M$6.7M56.8%55510

Frequently Asked Questions about Redding Post Acute

What neighborhood is Redding Post Acute in?

Redding Post Acute is in the Downtown neighborhood of Redding.

Is Redding Post Acute in a walkable area?

Redding Post Acute has a walk score of 86. Very walkable. Most errands can be accomplished on foot, and many essentials are within a short walk.

What is the occupancy rate at Redding Post Acute?

Redding Post Acute's occupancy is 78.1%.

Are there photos of Redding Post Acute?

Yes — there are 5 photos of Redding Post Acute in the photo gallery on this page.

What is the phone number of Redding Post Acute?

(530) 241-6756 will put you in contact with the team at Redding Post Acute.

Is Redding Post Acute Medicare or Medicaid certified?

Yes — Redding Post Acute is a CMS-certified provider of Medicare and Medicaid.

Guides for Better Senior Living

Care Cost Calculator: See Prices in Your Area

Nursing Home Data Explorer

Don’t Wait Too Long: 7 Red Flag Signs Your Parent Needs Assisted Living Now

The True Cost of Assisted Living in 2025 – And How Families Are Paying For It

Understanding Senior Living Costs: Pricing Models, Discounts & Financial Assistance

Explore Open Rooms
1 Contact details
2 What type of senior care service are you looking for?
3 What budget do you have in mind for senior care?
4 How soon do you need to find care?
5 Additional details

Thank you for your interest!

Our team will be in touch shortly to help with next steps.