Occupancy rate
52%
California average: 73%

We arrange tours, appointments, and even moving support so you don’t have to
Thank you for your interest!
Our team will be in touch shortly to help with next steps.


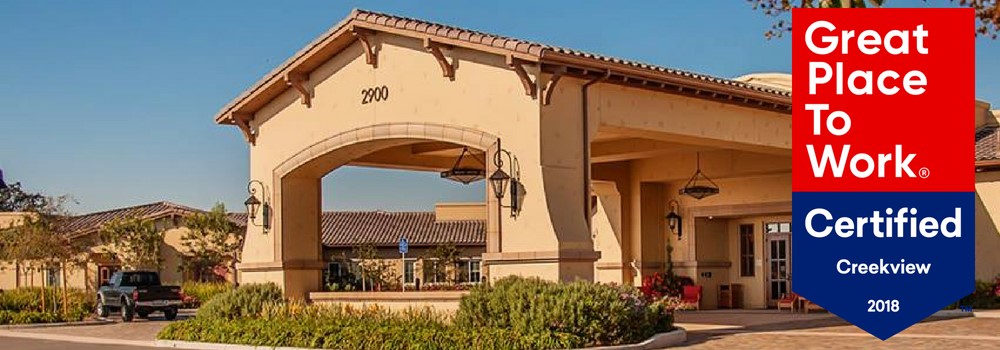
Located in Contra Costa County, Pleasanton, CA, Creekview Health Center is a dedicated senior living community that aims to provide the highest level of senior care and comforts for senior living through their wide range of services. Offering assisted living, memory care, skilled nursing, and rehabilitation, the community warrants a smooth transition should residents’ needs change. Recognized by the U.S News and World Report as Best Short-Term Rehabilitation and Best Long-Term Care, the community guarantees nothing but the finest in senior care and living.
Each day is filled with vibrant activities that match residents interest, passions and energy levels that day. Various assistance, including help with activities of daily living, medication management, weekly housekeeping and personal laundry services, are provided to ensure residents can live comfortably and conveniently. 24/7 security and emergency response guarantees residents are staying in a safe and secure environment with convenient access to response during emergencies.
Offers a balance of services and community atmosphere.
Lower occupancy suggests more openings may be available.
Most residents typically stay for a few weeks or months before returning home or moving on.
73% of new residents, usually for short-term rehab.
27% of new residents, often for short stays.
California average: 73%
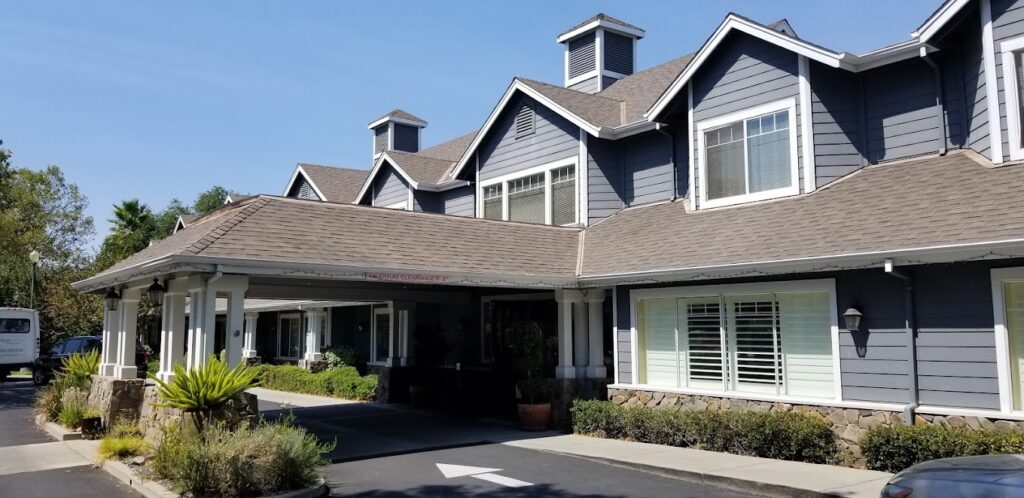
Building Type: Two-story
In California, the Department of Social Services (for assisted living facilities) and the Department of Public Health (for nursing homes) conduct inspections to ensure resident safety and regulatory compliance.
California average: 16 visits
3 total complaint visits
3 other visits
![]() Other visits include regulatory visits that are not routine inspections or complaint investigations, such as administrative check-ins, follow-up reviews, or licensing-related visits.
Other visits include regulatory visits that are not routine inspections or complaint investigations, such as administrative check-ins, follow-up reviews, or licensing-related visits.
13 total complaint visits
7 other visits
Investigations can have many visits.
California average: 10 complaint investigations
California average: 4 official inspections
A violation that poses an immediate risk to resident health or safety, or represents a substantial failure to comply with licensing requirements.
California average: 3 serious citations
A violation that does not pose an immediate risk to resident health or safety but requires correction to remain in compliance.
California average: 4 moderate citations
California average 12.5
Last Health inspection on Feb 2025
California average 50.2
California average 4.65
Health citations are formal notices following inspections when they fail to comply with safety and care standards.
All 13 citations resulted from standard inspections.
California average: 0.4
California average: 1
Data sourced from CMS Health Deficiencies reports. Citation severity codes range from A (least serious) to L (most serious). Immediate Jeopardy (J-L) citations indicate situations where the facility's noncompliance has placed residents at risk of death or serious harm.
Nursing Home Licensed facility providing 24/7 skilled nursing care for residents with complex, ongoing medical needs. Staffed by RNs, LPNs, and CNAs. Inspected and star-rated annually by CMS. Accepts Medicare (short-term rehab) and Medicaid (long-term care).
Assisted Living A licensed, long-term care setting for seniors or individuals with disabilities who need help with daily activities — like bathing, dressing, and medication management — but not 24-hour skilled nursing. Offers housing, meals, and around-the-clock support while aiming to maximize resident independence.
Assisted Living A licensed, long-term care setting for seniors or individuals with disabilities who need help with daily activities — like bathing, dressing, and medication management — but not 24-hour skilled nursing. Offers housing, meals, and around-the-clock support while aiming to maximize resident independence.
Assisted Living A licensed, long-term care setting for seniors or individuals with disabilities who need help with daily activities — like bathing, dressing, and medication management — but not 24-hour skilled nursing. Offers housing, meals, and around-the-clock support while aiming to maximize resident independence.
Assisted Living A licensed, long-term care setting for seniors or individuals with disabilities who need help with daily activities — like bathing, dressing, and medication management — but not 24-hour skilled nursing. Offers housing, meals, and around-the-clock support while aiming to maximize resident independence.
Assisted Living A licensed, long-term care setting for seniors or individuals with disabilities who need help with daily activities — like bathing, dressing, and medication management — but not 24-hour skilled nursing. Offers housing, meals, and around-the-clock support while aiming to maximize resident independence.
![]() 3.5 miles from city center
3.5 miles from city center
![]() 2900 Stoneridge Dr, Pleasanton, CA 94588
2900 Stoneridge Dr, Pleasanton, CA 94588
Add your location
This data corresponds to Q2 2025 and is based on CMS Payroll-Based Journal.
California average ratio: 0.00:1
California average: 7.7 hours
Manages medical care and health needs.
No contractors work on this role.
Assists with medical care and medications.
No contractors work on this role.
Helps with daily care and mobility.
This role is partially covered by contractors.
Total hours from contractors
3,297 contractor hours this quarter
| Certified Nursing Assistant | 37 | 29 | 66 | 13,119 | 91 | 100% | 7.9 |
| Licensed Practical Nurse | 12 | 0 | 12 | 5,079 | 91 | 100% | 7.8 |
| Registered Nurse | 9 | 0 | 9 | 3,064 | 91 | 100% | 8.3 |
| Other Dietary Services Staff | 7 | 0 | 7 | 1,776 | 91 | 100% | 7.7 |
| Physical Therapy Assistant | 0 | 4 | 4 | 807 | 68 | 75% | 6.1 |
| Speech Language Pathologist | 0 | 2 | 2 | 601 | 66 | 73% | 5.1 |
| Clinical Nurse Specialist | 2 | 0 | 2 | 524 | 67 | 74% | 7.3 |
| Administrator | 1 | 0 | 1 | 464 | 58 | 64% | 8 |
| Respiratory Therapy Technician | 0 | 2 | 2 | 454 | 70 | 77% | 5.9 |
| Physical Therapy Aide | 0 | 3 | 3 | 451 | 66 | 73% | 5.5 |
| Nurse Practitioner | 1 | 0 | 1 | 440 | 55 | 60% | 8 |
| Dietitian | 1 | 0 | 1 | 424 | 53 | 58% | 8 |
| Mental Health Service Worker | 1 | 0 | 1 | 416 | 52 | 57% | 8 |
| RN Director of Nursing | 1 | 0 | 1 | 260 | 35 | 38% | 7.4 |
| Qualified Social Worker | 0 | 2 | 2 | 207 | 65 | 71% | 2.6 |
| Occupational Therapy Aide | 0 | 1 | 1 | 153 | 20 | 22% | 7.6 |
| Therapeutic Recreation Specialist | 0 | 2 | 2 | 141 | 37 | 41% | 3.7 |
| Occupational Therapy Assistant | 0 | 2 | 2 | 43 | 5 | 5% | 8.5 |
| Medical Director | 0 | 1 | 1 | 3 | 2 | 2% | 1.3 |
Source: CMS Long-Term Care Facility Characteristics (Data as of Jan 2026)
Residents meet regularly to discuss policies, care quality, and activities
State-approved Nurse Aide Training and Competency Evaluation Program on-site
Part of a Continuing Care Retirement Community offering multiple care levels
Organized group of residents that meets regularly to discuss facility policies, quality of life, and activities.
Data sourced from CMS Long-Term Care Facility Characteristics quarterly report. Payer mix reflects the current resident census by primary payment source.
These measures show how residents usually do over time at this home, based on health outcomes and preventive care.
California average: 6.6
California average: 11.3
California average: 11.1%
California average: 11.3%
California average: 1.7%
California average: 5.0%
California average: 1.2%
California average: 4.2%
California average: 6.7%
California average: 10.1%
California average: 98.5%
California average: 98.2%
California average: 94.0%
California average: 1.5%
California average: 93.2%
Quality measures are calculated from Minimum Data Set (MDS) assessments. For most measures, lower percentages indicate better care quality.
Historical financial and operational data for Creekview Health Center based on CMS SNF Cost Reports.
Loading trend charts...
Care Cost Calculator: See Prices in Your Area
Nursing Home Data Explorer
Don’t Wait Too Long: 7 Red Flag Signs Your Parent Needs Assisted Living Now
The True Cost of Assisted Living in 2025 – And How Families Are Paying For It
Understanding Senior Living Costs: Pricing Models, Discounts & Financial Assistance

Touring a community? Use this expert-backed checklist to stay organized, ask the right questions, and find the perfect fit.
We'll send you a PDF version of the touring checklist.