Total health inspections
11
California average 12.5
Last Health inspection on Jul 2025

We arrange tours, appointments, and even moving support so you don’t have to
Thank you for your interest!
Our team will be in touch shortly to help with next steps.
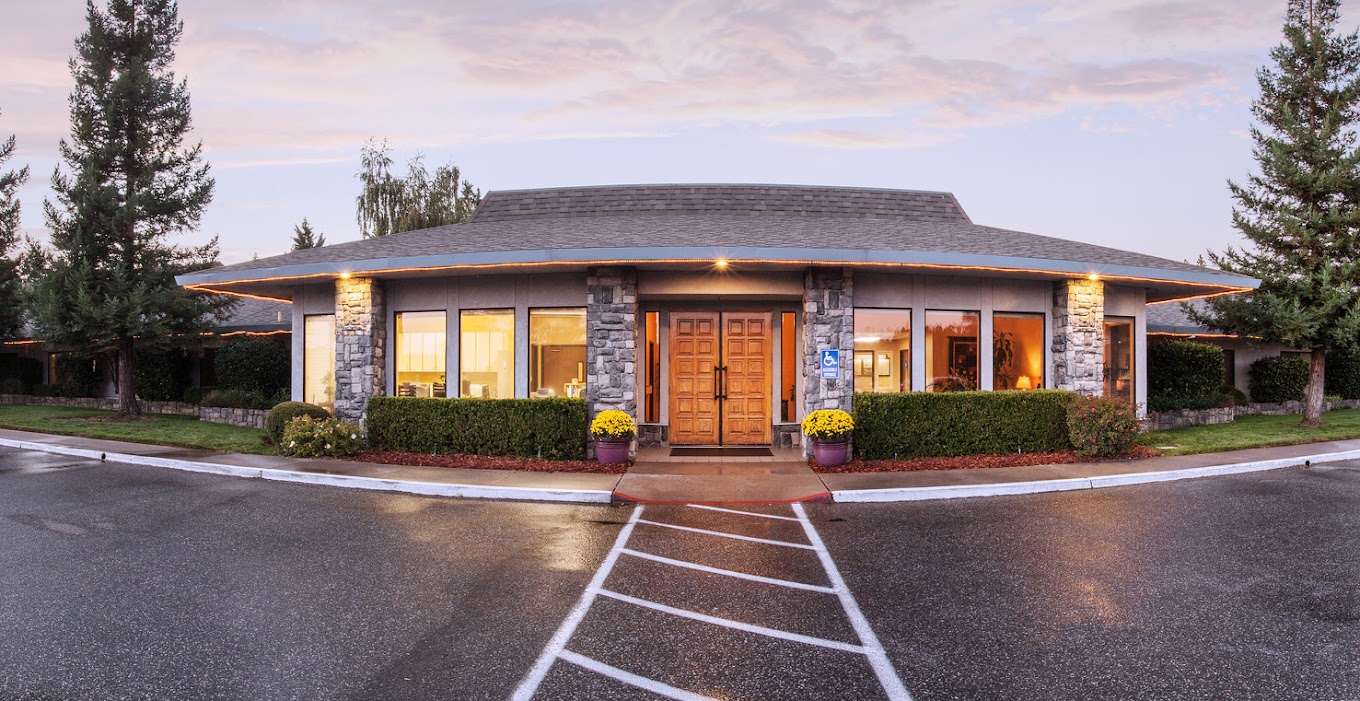
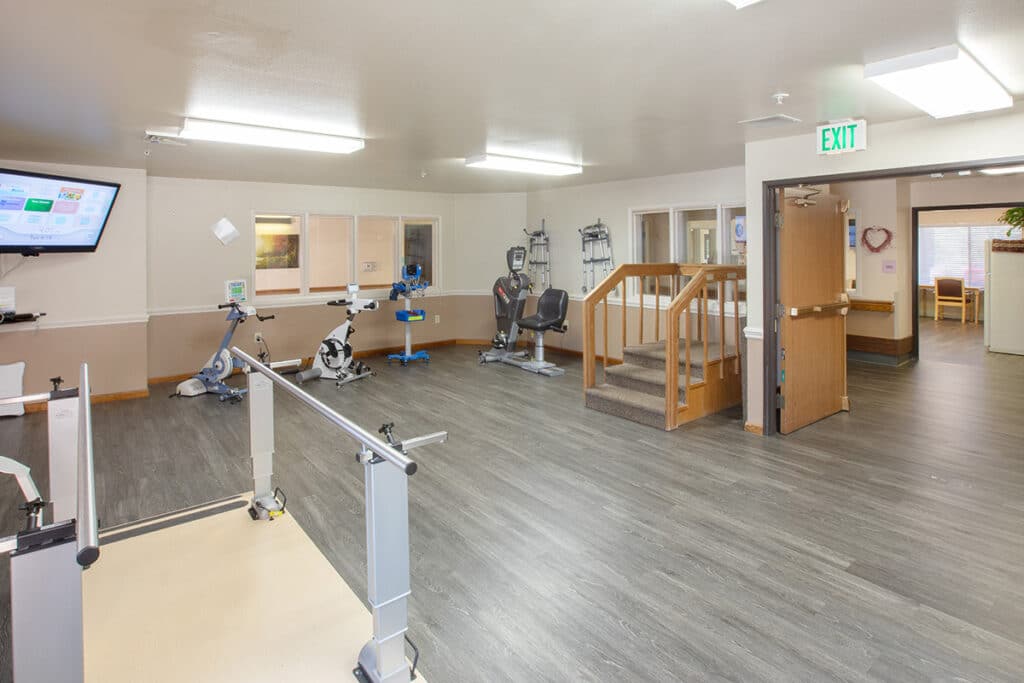
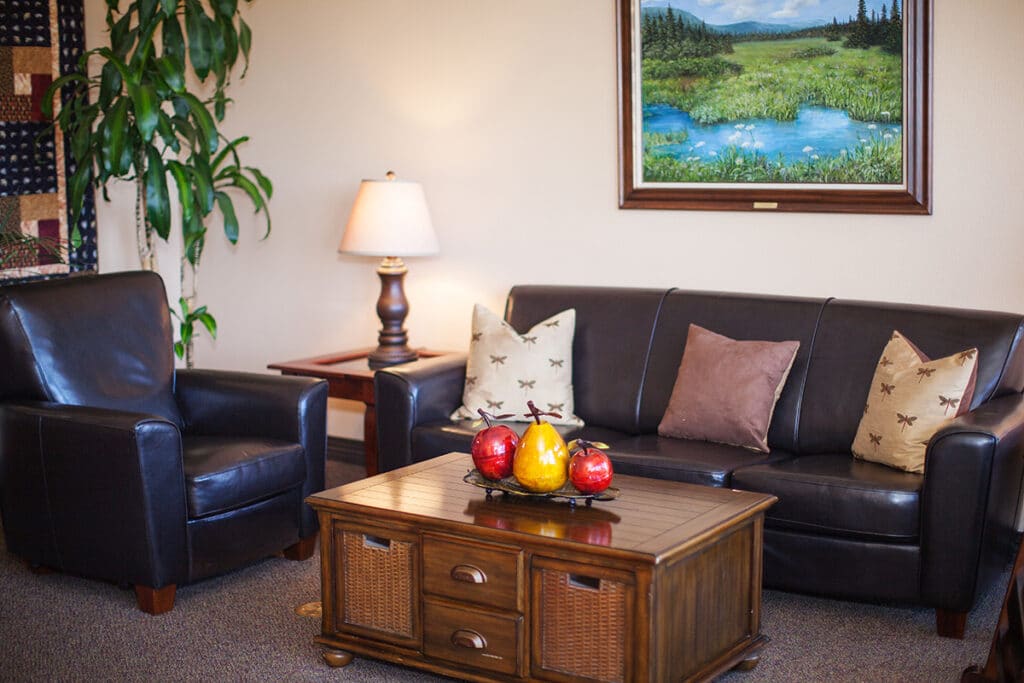
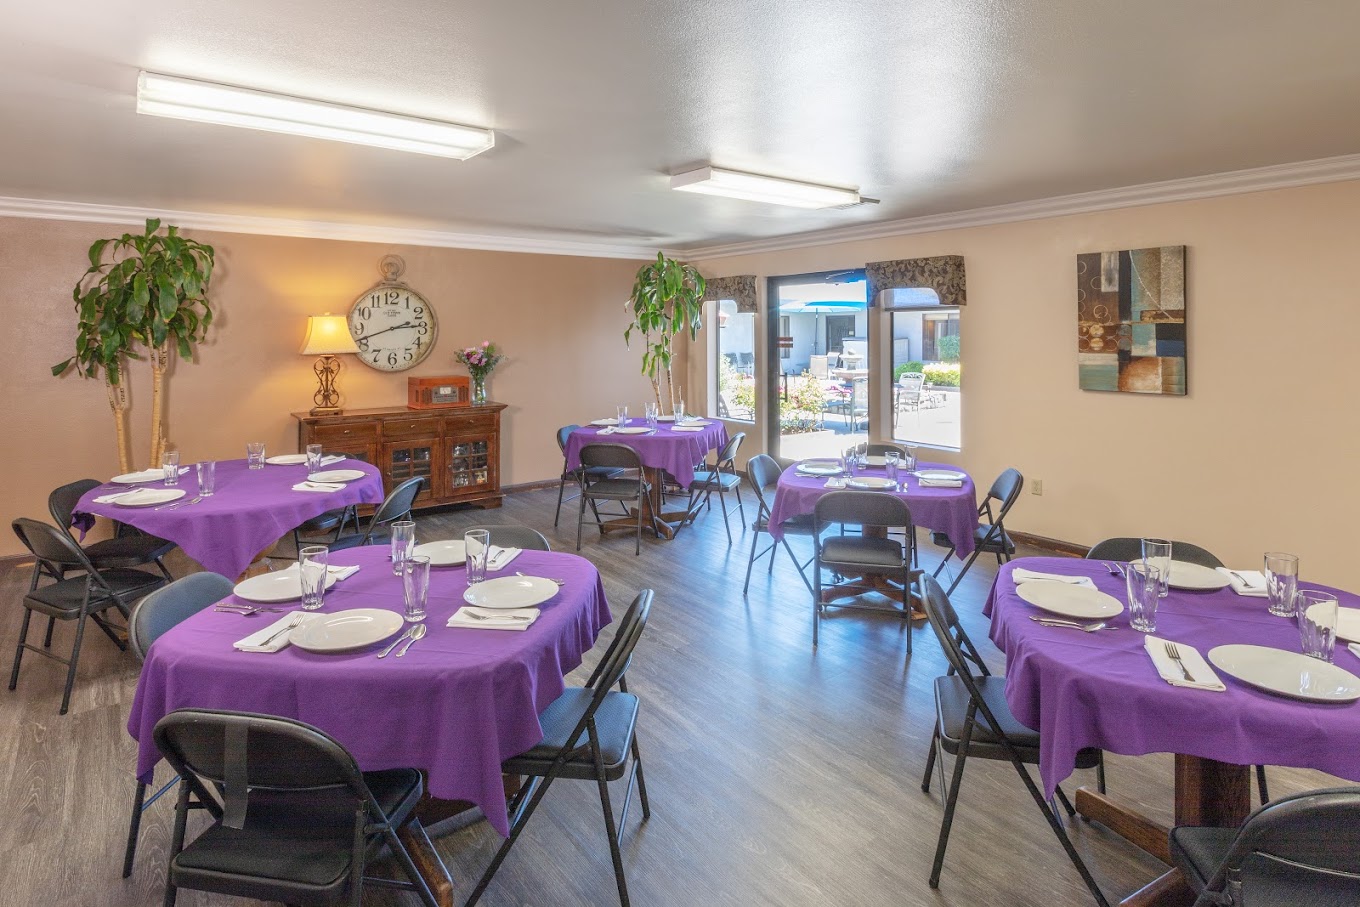


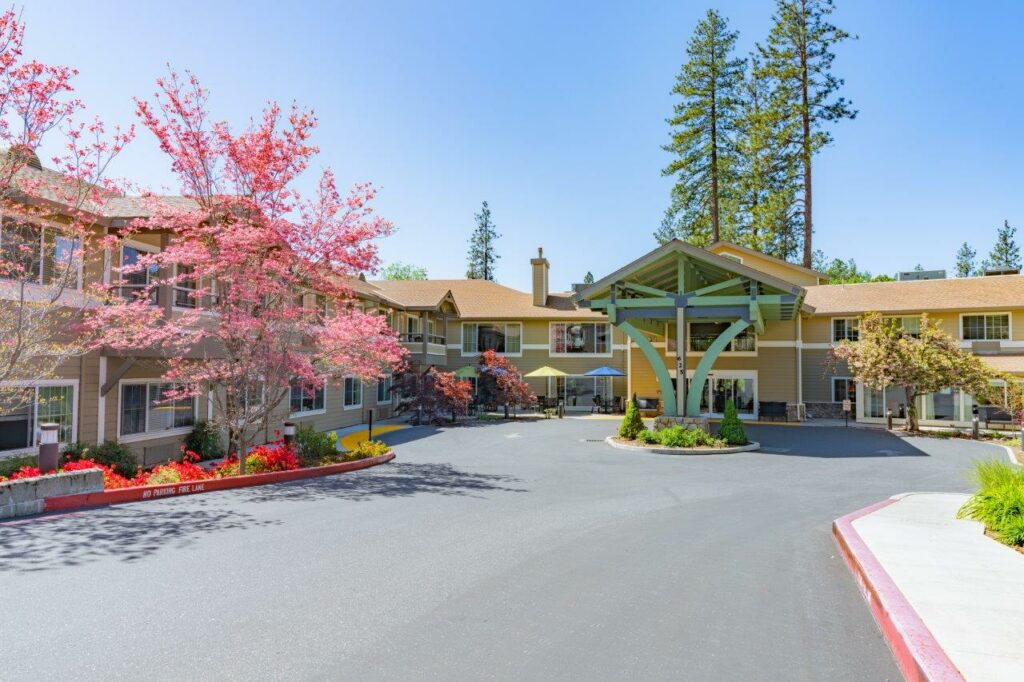
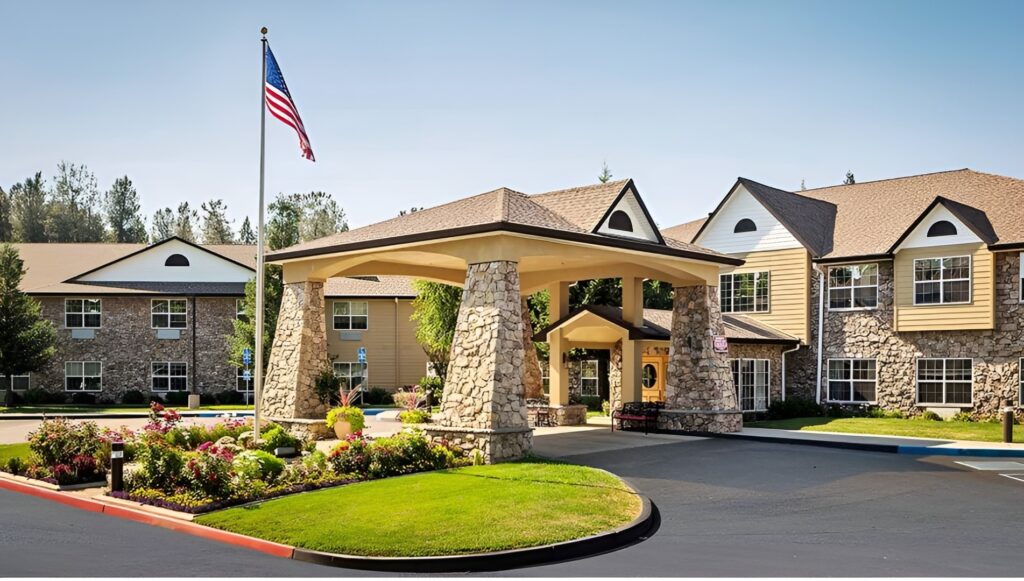
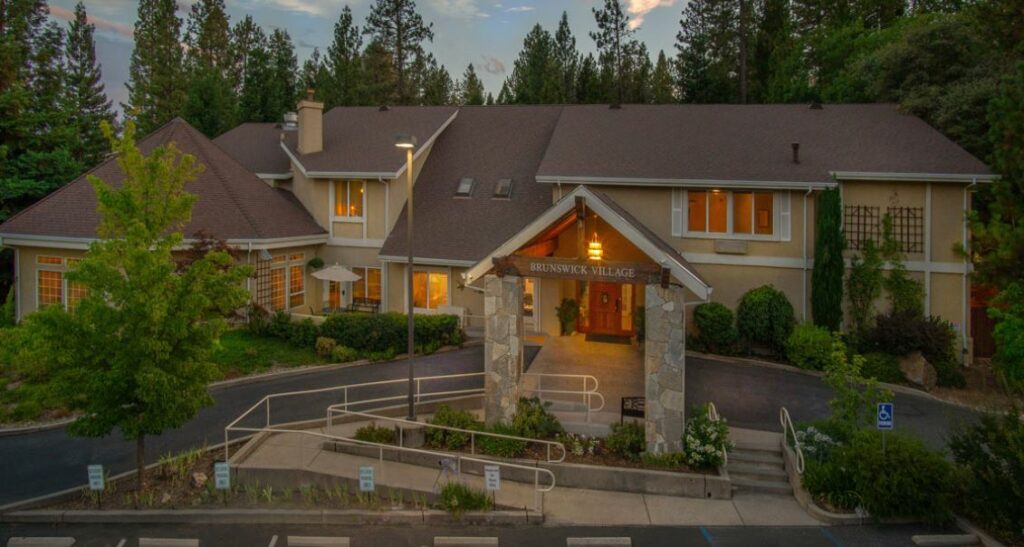
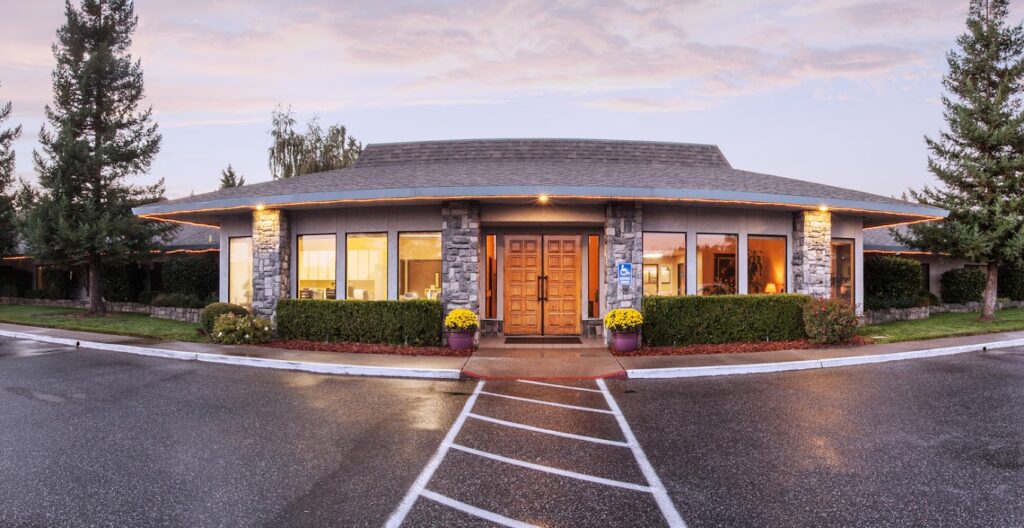
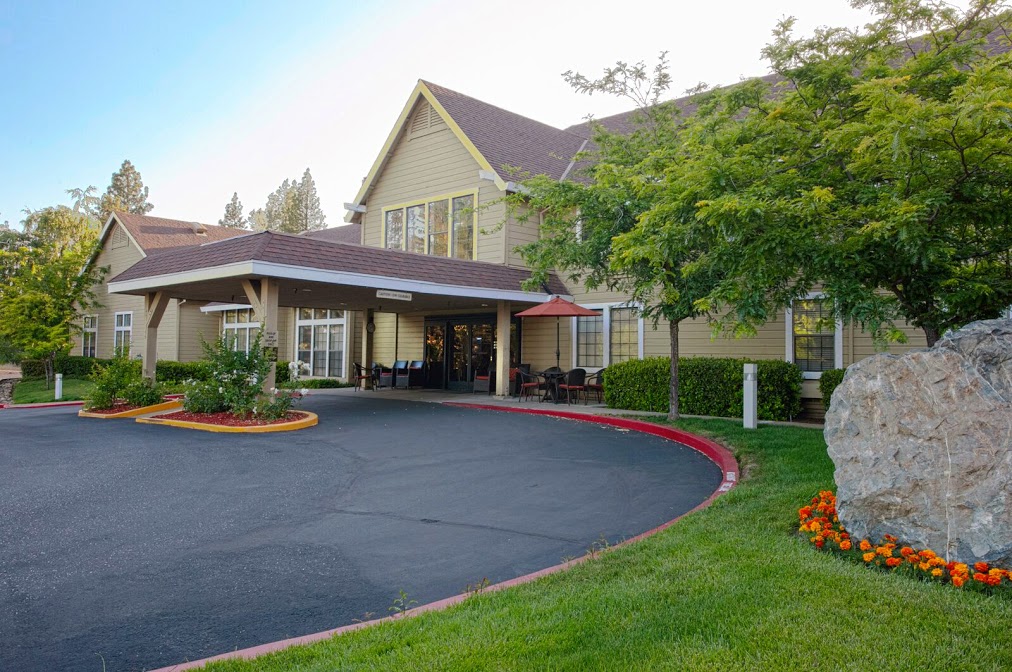
Crystal Ridge Care Center, located in the heart of Grass Valley, CA, is an ideal retreat for retirement living. Nestled in a peaceful residential area, this community offers a tranquil setting perfect for relaxation. Residents can choose from studio, one-bedroom, and two-bedroom apartments designed to accommodate different preferences and budgets. With independent living options, this vibrant community provides a comfortable and enriching place to call home. Its convenient location near markets, restaurants, and shopping centers allows residents to enjoy both peace and accessibility.
A standout feature of this unique community is its wide range of wellness programs, which cater to residents’ physical, emotional, and mental health needs. These offerings ensure each individual receives personalized care in a nurturing environment. With exceptional services, residents of Crystal Ridge Care Center can embrace a fulfilling and vibrant lifestyle.
Your Care is the Licensed Nursing Home Administrator at Crystal Ridge Care Center, overseeing all facility operations, staffing, services, and programs. They lead the leadership team to ensure high-quality care and smooth functioning of the community.
May offer a more intimate, personalized care environment.
Occupancy is moderate, suggesting balanced demand.
This home supports both short-term rehab and long-term care, with residents staying for a wide range of durations.
44% of new residents, usually for short-term rehab.
52% of new residents, often for short stays.
4% of new residents, often for long-term daily care.
Accept Medicaid: Yes, Accept
Total Residents: 99 Residents
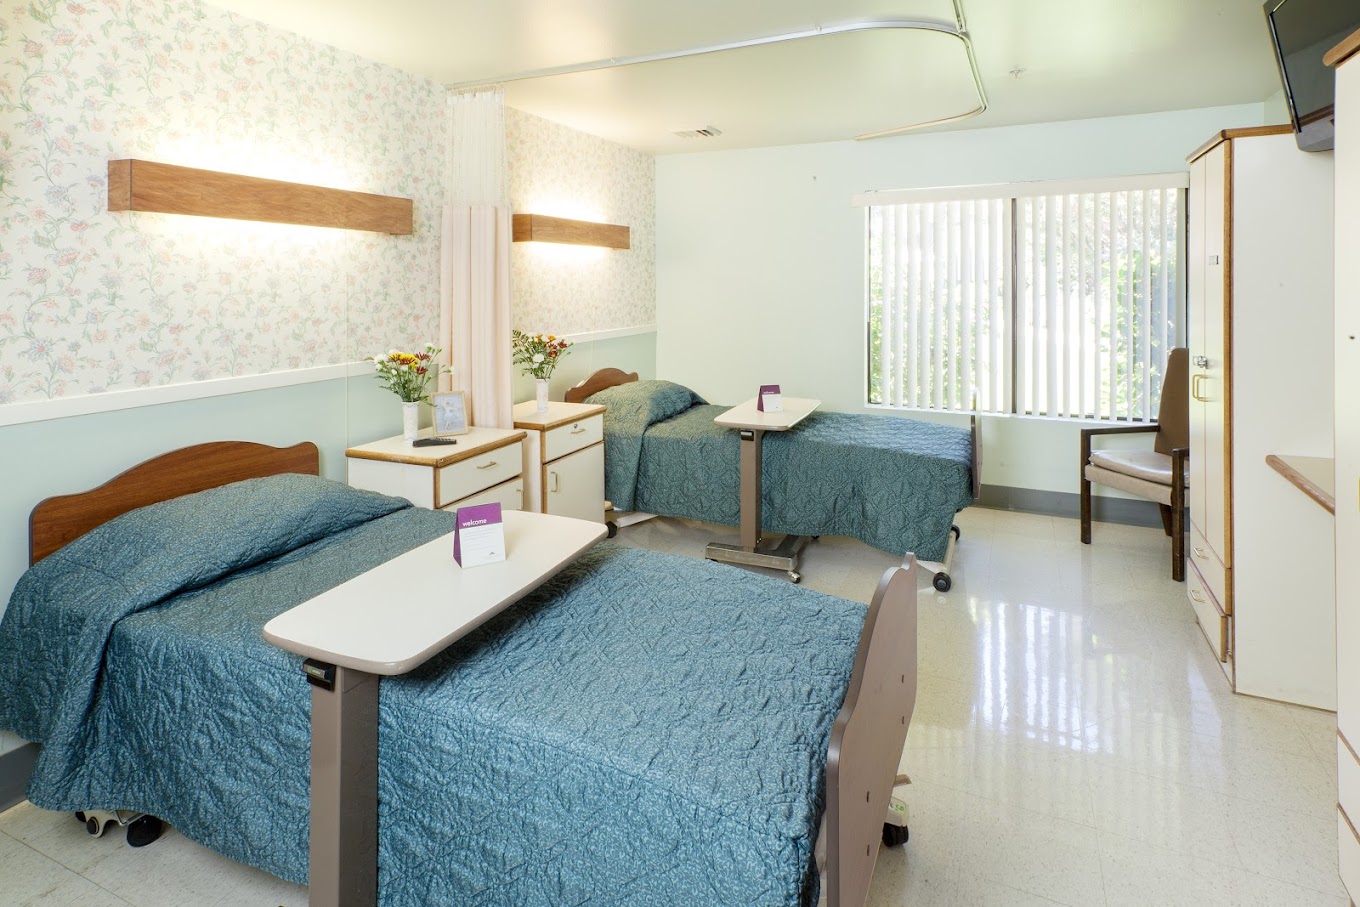
Housing Options: Studio / 1 Bed / 2 Bed
Building Type: Single-story
Ways to qualify for care at this community, including accepted programs and payment options.
This facility is certified for eligible Medicare services.
In California, the Department of Social Services (for assisted living facilities) and the Department of Public Health (for nursing homes) conduct inspections to ensure resident safety and regulatory compliance.
California average 12.5
Last Health inspection on Jul 2025
California average 50.2
California average 4.65
Health citations are formal notices following inspections when they fail to comply with safety and care standards.
31 of 45 citations resulted from standard inspections; 13 of 45 resulted from complaint investigations; and 1 of 45 came from combined inspections (standard and complaint).
California average: 0.4
California average: 1
Data sourced from CMS Health Deficiencies reports. Citation severity codes range from A (least serious) to L (most serious). Immediate Jeopardy (J-L) citations indicate situations where the facility's noncompliance has placed residents at risk of death or serious harm.
Assisted Living A licensed, long-term care setting for seniors or individuals with disabilities who need help with daily activities — like bathing, dressing, and medication management — but not 24-hour skilled nursing. Offers housing, meals, and around-the-clock support while aiming to maximize resident independence.
Independent Living Lifestyle-focused communities for older adults offering dining, activities, and transportation with minimal personal care. Best for active, independent seniors who want community without medical support.
Memory Care Secured, specialized care for people living with Alzheimer's or dementia. Staff trained in cognitive impairment, with higher staff-to-resident ratios and an environment designed to reduce confusion and wandering risk.
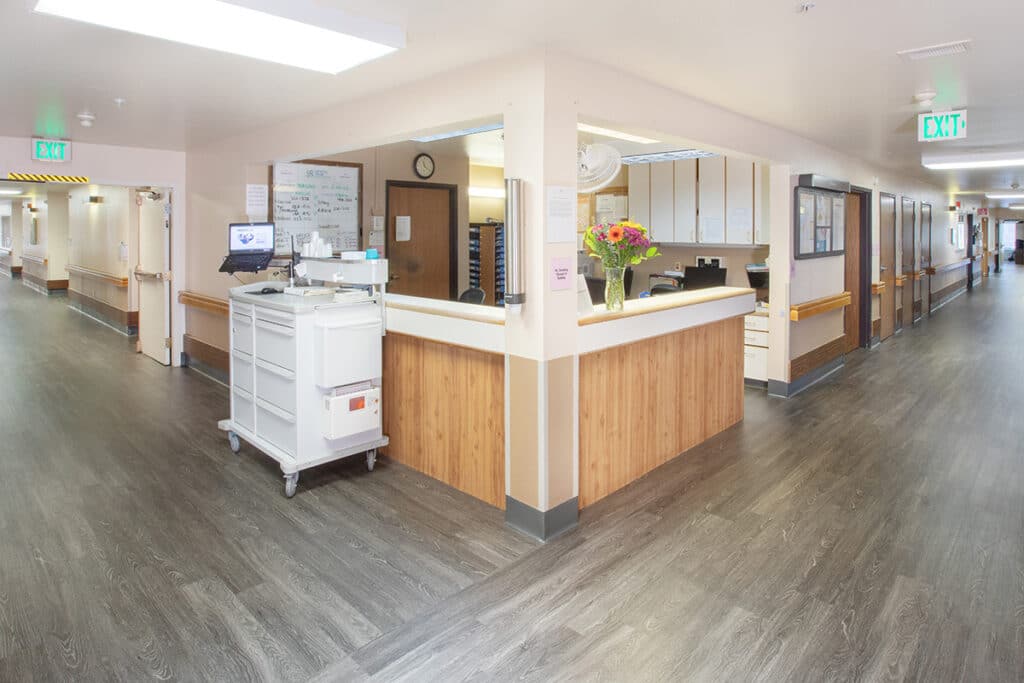
Nursing Home Licensed facility providing 24/7 skilled nursing care for residents with complex, ongoing medical needs. Staffed by RNs, LPNs, and CNAs. Inspected and star-rated annually by CMS. Accepts Medicare (short-term rehab) and Medicaid (long-term care).
Assisted Living A licensed, long-term care setting for seniors or individuals with disabilities who need help with daily activities — like bathing, dressing, and medication management — but not 24-hour skilled nursing. Offers housing, meals, and around-the-clock support while aiming to maximize resident independence.
Independent Living Lifestyle-focused communities for older adults offering dining, activities, and transportation with minimal personal care. Best for active, independent seniors who want community without medical support.
Memory Care Secured, specialized care for people living with Alzheimer's or dementia. Staff trained in cognitive impairment, with higher staff-to-resident ratios and an environment designed to reduce confusion and wandering risk.
Nursing Home Licensed facility providing 24/7 skilled nursing care for residents with complex, ongoing medical needs. Staffed by RNs, LPNs, and CNAs. Inspected and star-rated annually by CMS. Accepts Medicare (short-term rehab) and Medicaid (long-term care).
Nursing Home Licensed facility providing 24/7 skilled nursing care for residents with complex, ongoing medical needs. Staffed by RNs, LPNs, and CNAs. Inspected and star-rated annually by CMS. Accepts Medicare (short-term rehab) and Medicaid (long-term care).
Assisted Living A licensed, long-term care setting for seniors or individuals with disabilities who need help with daily activities — like bathing, dressing, and medication management — but not 24-hour skilled nursing. Offers housing, meals, and around-the-clock support while aiming to maximize resident independence.
Independent Living Lifestyle-focused communities for older adults offering dining, activities, and transportation with minimal personal care. Best for active, independent seniors who want community without medical support.
Memory Care Secured, specialized care for people living with Alzheimer's or dementia. Staff trained in cognitive impairment, with higher staff-to-resident ratios and an environment designed to reduce confusion and wandering risk.
Nursing Home Licensed facility providing 24/7 skilled nursing care for residents with complex, ongoing medical needs. Staffed by RNs, LPNs, and CNAs. Inspected and star-rated annually by CMS. Accepts Medicare (short-term rehab) and Medicaid (long-term care).
![]() 1.9 miles from city center
1.9 miles from city center
![]() 396 Dorsey Dr, Grass Valley, CA 95945
396 Dorsey Dr, Grass Valley, CA 95945
Add your location
This data corresponds to Q2 2025 and is based on CMS Payroll-Based Journal.
California average ratio: 0.00:1
California average: 7.7 hours
Manages medical care and health needs.
No contractors work on this role.
Assists with medical care and medications.
This role is partially covered by contractors.
Helps with daily care and mobility.
This role is partially covered by contractors.
Total hours from contractors
4,095 contractor hours this quarter
| Certified Nursing Assistant | 49 | 32 | 81 | 17,771 | 91 | 100% | 8 |
| Licensed Practical Nurse | 27 | 20 | 47 | 8,429 | 91 | 100% | 8.9 |
| Nurse Aide in Training | 16 | 0 | 16 | 3,411 | 85 | 93% | 7.4 |
| Registered Nurse | 4 | 0 | 4 | 1,349 | 89 | 98% | 8 |
| Other Dietary Services Staff | 3 | 0 | 3 | 1,032 | 88 | 97% | 7.9 |
| RN Director of Nursing | 3 | 0 | 3 | 936 | 65 | 71% | 7.7 |
| Speech Language Pathologist | 0 | 2 | 2 | 671 | 65 | 71% | 6.1 |
| Dietitian | 1 | 0 | 1 | 554 | 67 | 74% | 8.3 |
| Physical Therapy Aide | 0 | 2 | 2 | 534 | 64 | 70% | 7.4 |
| Administrator | 1 | 0 | 1 | 512 | 64 | 70% | 8 |
| Nurse Practitioner | 1 | 0 | 1 | 512 | 64 | 70% | 8 |
| Clinical Nurse Specialist | 1 | 0 | 1 | 478 | 67 | 74% | 7.1 |
| Qualified Social Worker | 0 | 1 | 1 | 471 | 64 | 70% | 7.4 |
| Physical Therapy Assistant | 0 | 2 | 2 | 443 | 61 | 67% | 7.3 |
| Dental Services Staff | 2 | 0 | 2 | 340 | 45 | 49% | 7.6 |
| Respiratory Therapy Technician | 0 | 4 | 4 | 239 | 55 | 60% | 3.7 |
Source: CMS Long-Term Care Facility Characteristics (Data as of Jan 2026)
Residents meet regularly to discuss policies, care quality, and activities
State-approved Nurse Aide Training and Competency Evaluation Program on-site
Organized group of residents that meets regularly to discuss facility policies, quality of life, and activities.
Data sourced from CMS Long-Term Care Facility Characteristics quarterly report. Payer mix reflects the current resident census by primary payment source.
These measures show how residents usually do over time at this home, based on health outcomes and preventive care.
California average: 6.6
California average: 11.3
California average: 11.1%
California average: 12.0%
California average: 11.3%
California average: 1.7%
California average: 5.0%
California average: 1.2%
California average: 4.2%
California average: 6.7%
California average: 10.1%
California average: 98.5%
California average: 98.2%
California average: 2.25
California average: 1.59
California average: 94.0%
California average: 1.5%
California average: 93.2%
California average: 23.2%
California average: 11.2%
California average: 0.8%
California average: 53.7%
California average: 50.6%
Quality measures are calculated from Minimum Data Set (MDS) assessments. For most measures, lower percentages indicate better care quality.
Historical financial and operational data for Crystal Ridge Care Center based on CMS SNF Cost Reports.
Loading trend charts...
Care Cost Calculator: See Prices in Your Area
Nursing Home Data Explorer
Don’t Wait Too Long: 7 Red Flag Signs Your Parent Needs Assisted Living Now
The True Cost of Assisted Living in 2025 – And How Families Are Paying For It
Understanding Senior Living Costs: Pricing Models, Discounts & Financial Assistance

Touring a community? Use this expert-backed checklist to stay organized, ask the right questions, and find the perfect fit.
We'll send you a PDF version of the touring checklist.