

Total health inspections
4
California average 12.5
Last Health inspection on Jan 2025

We arrange tours, appointments, and even moving support so you don’t have to


Devonshire Oaks Nursing Center is a dedicated nursing home in Redwood City, CA, that offers nursing care, rehabilitation services, long-term care, and social services. This Medicare and Medicaid-certified community has an interdisciplinary team that aims to keep older adults comfortable and safe. Therapy services, medication management, and pain management are among the community’s exceptional services, designed to meet residents’ healthcare needs. The community also strives to promote a friendly and supportive environment where residents can feel at ease.
With three nutritious meals daily, residents have a hassle-free dining experience that caters to their nutritional needs. Fun activities and social engagement are also in place, so residents will not feel lonely during their stay. The community’s ideal location in the heart of the San Francisco Peninsula allows residents to experience a laid-back retirement surrounded by lush trees and scenic views. As one of the trusted nursing homes in California, the community continuously provides high-quality services for older adults. Tours are also available by appointment from Monday to Friday, from 9 A.M. to 5 P.M.
 Official CMS rating based on health inspections, staffing and quality measures.
Official CMS rating based on deficiencies found during state health inspections.
Official CMS rating based on nurse staffing hours per resident per day.
Official CMS rating based on clinical outcomes for residents.
Average daily nursing hours per resident (adjusted for acuity). Higher values indicate more nursing time per resident.
Hours of care per resident per day, broken down by staff type. Data from CMS Medicare.
Registered nurse hours per resident per day.
Licensed Practical Nurse / Licensed Vocational Nurse hours per resident per day.
Nurse aide hours per resident per day.
Total number of nurse staff hours per resident per day on weekends.
Physical therapist staff hours per resident per day.
Registered nurse hours per resident per day on weekends.
Official CMS rating based on health inspections, staffing and quality measures.
Official CMS rating based on deficiencies found during state health inspections.
Official CMS rating based on nurse staffing hours per resident per day.
Official CMS rating based on clinical outcomes for residents.
Average daily nursing hours per resident (adjusted for acuity). Higher values indicate more nursing time per resident.
Hours of care per resident per day, broken down by staff type. Data from CMS Medicare.
Registered nurse hours per resident per day.
Licensed Practical Nurse / Licensed Vocational Nurse hours per resident per day.
Nurse aide hours per resident per day.
Total number of nurse staff hours per resident per day on weekends.
Physical therapist staff hours per resident per day.
Registered nurse hours per resident per day on weekends.
May offer a more intimate, personalized care environment.
Lower occupancy suggests more openings may be available.
This home supports both short-term rehab and long-term care, with residents staying for a wide range of durations.
46% of new residents, usually for short-term rehab.
54% of new residents, often for short stays.
The portion of the home's budget spent on staff, including nurses, caregivers, and other employees who support care and operations.
All remaining costs needed to run the home, such as food, utilities, building maintenance, supplies and administrative expenses.
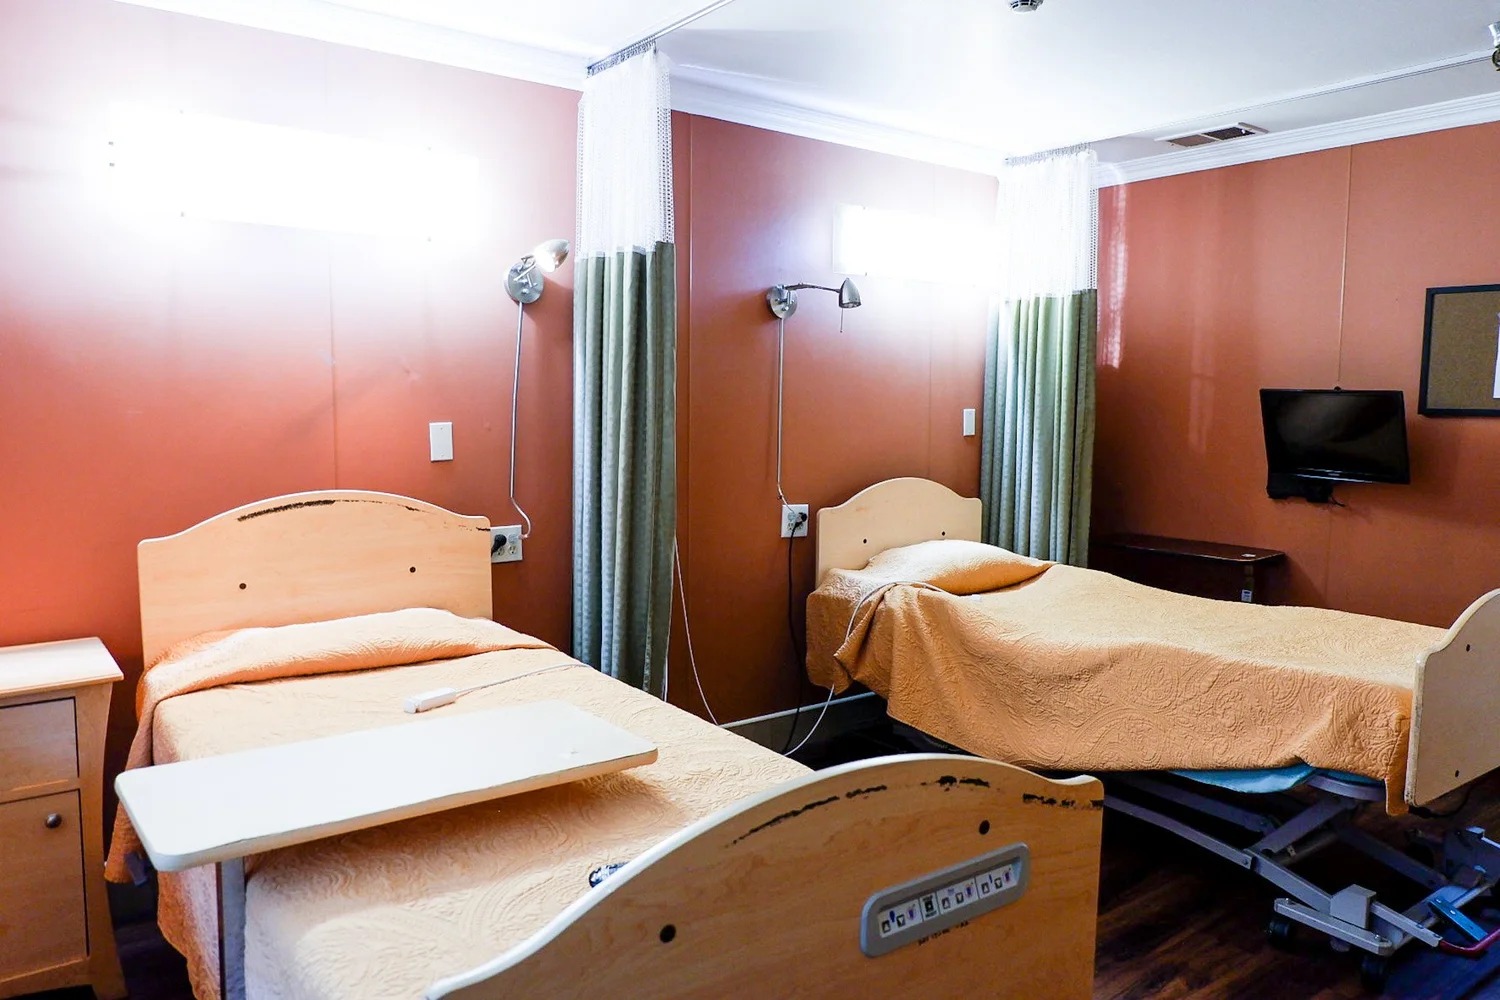
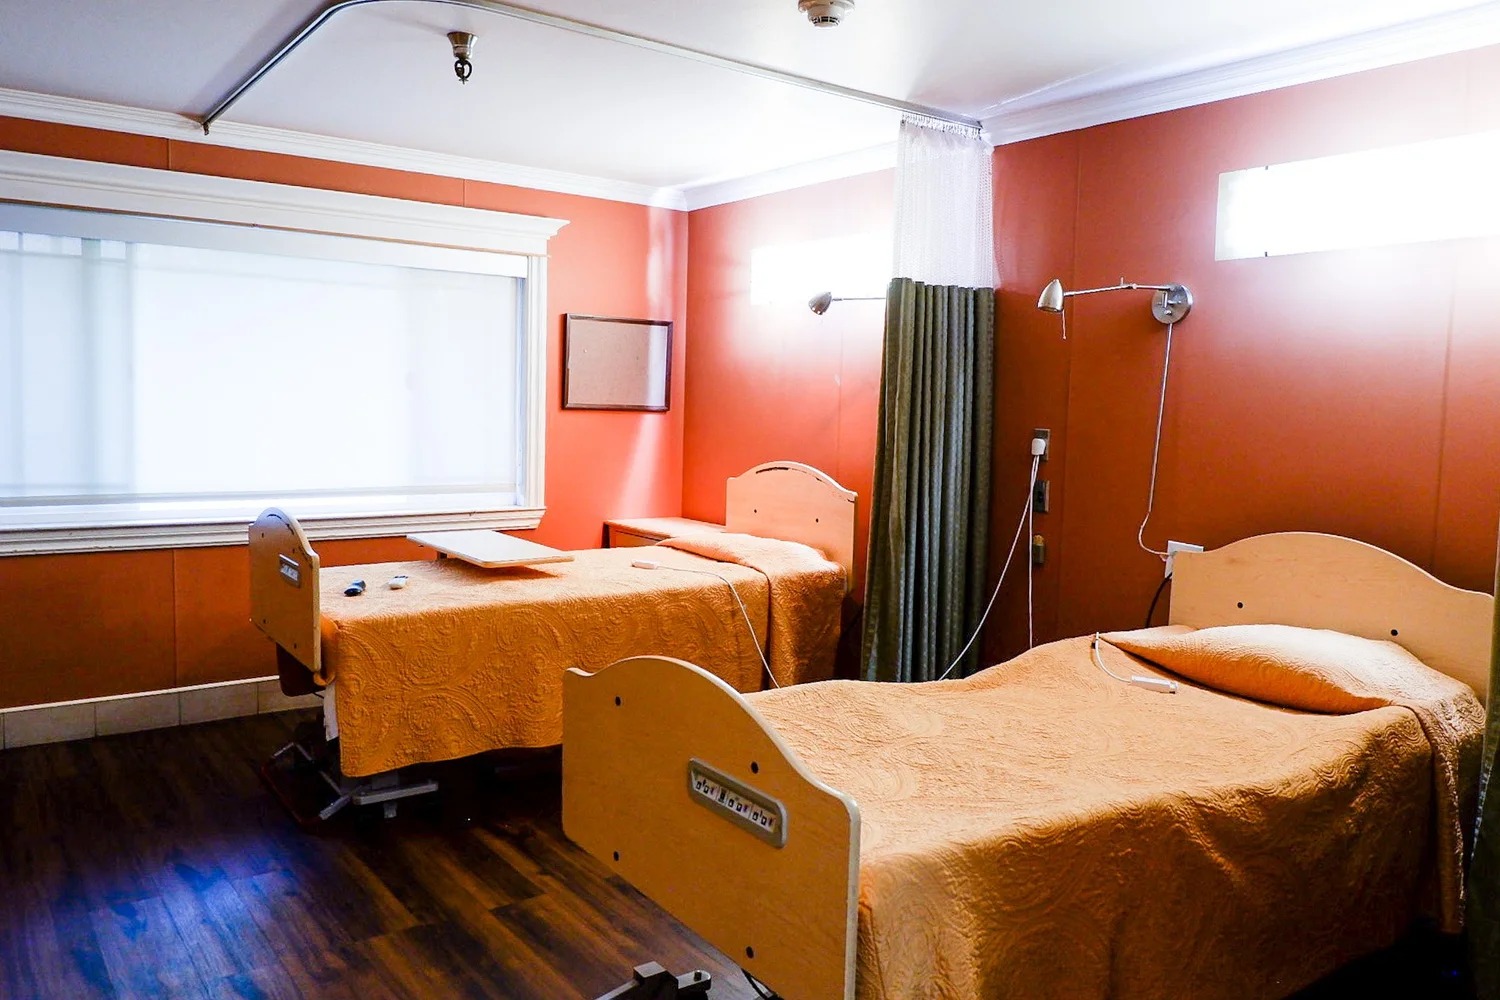
Housing Options: Private / Shared Rooms
Building Type: Single-story
Dining Services
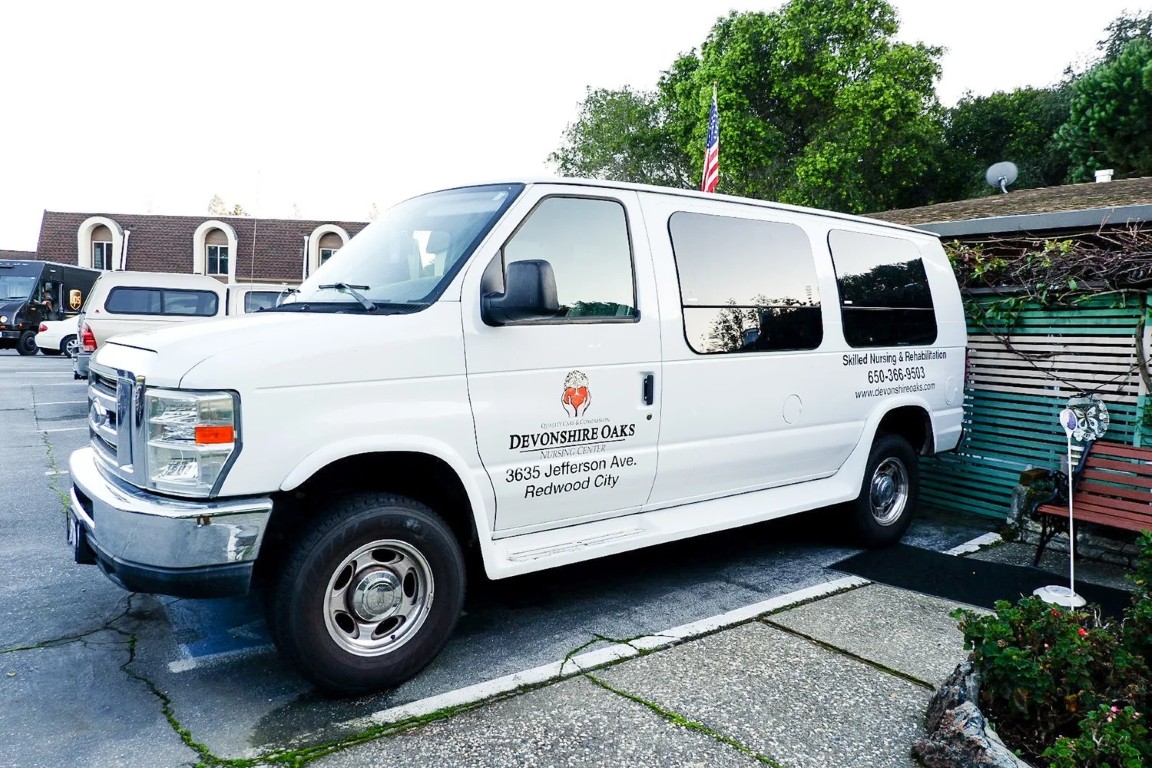
Transportation Services
Housekeeping Services
Social and Recreational Activities

On-site Medical Care and Health Services
Nursing Home 24/7 care needed
Assisted Living For seniors needing help with daily tasks but not full-time nursing.
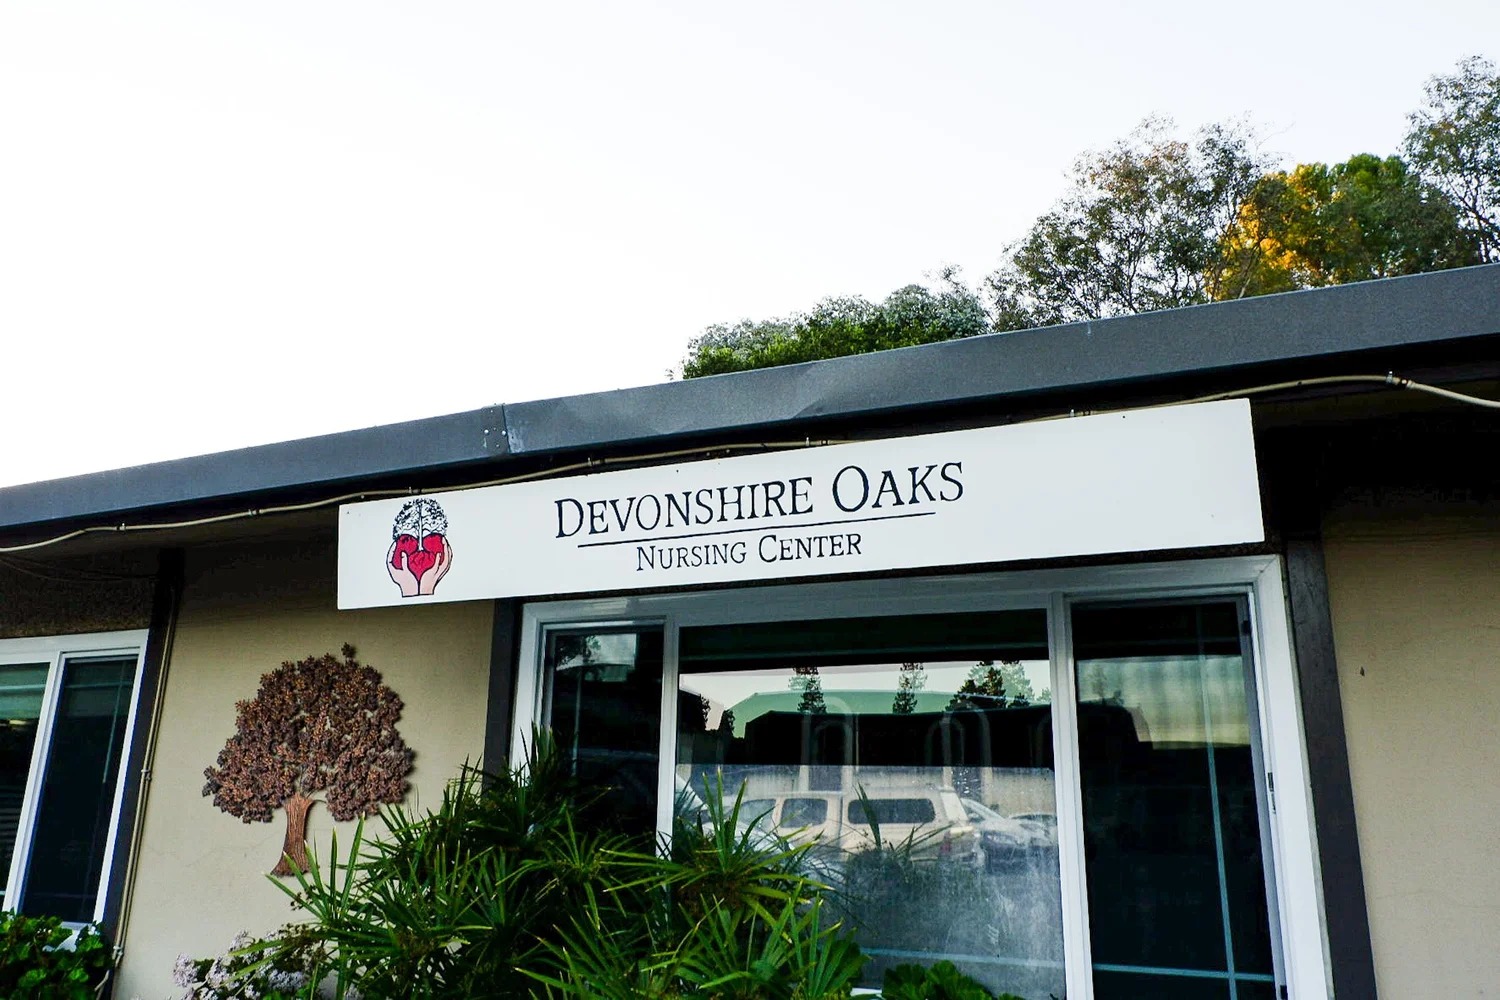
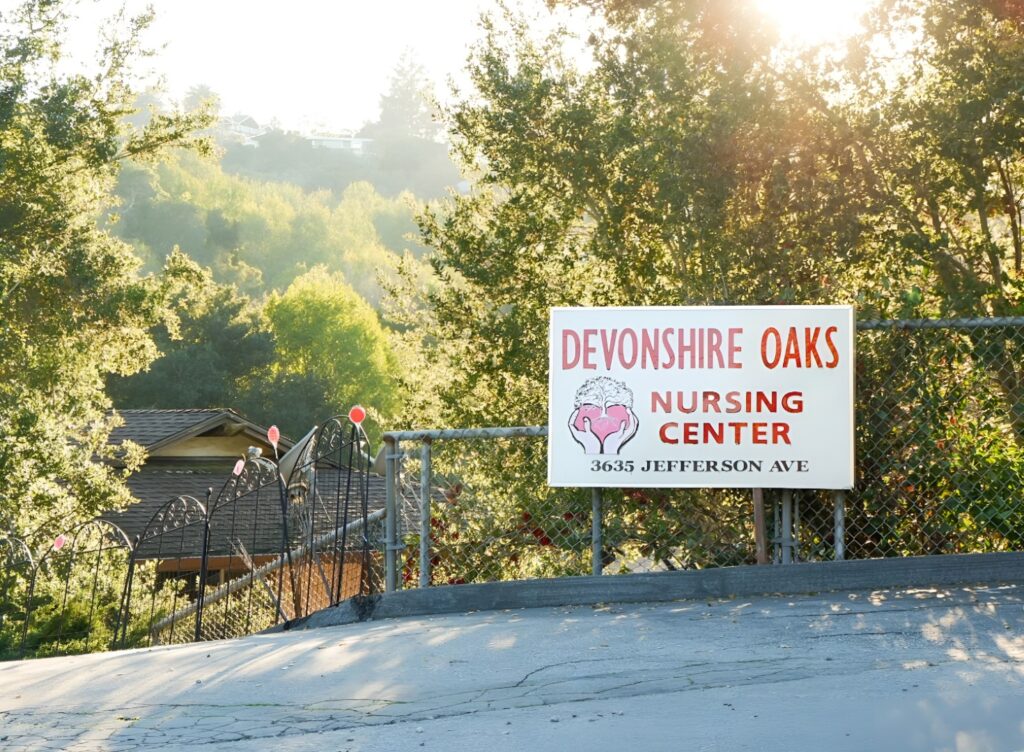 Devonshire Oaks Nursing Center
![]() 2.2 miles from city center
2.2 miles from city center
![]() 3635 Jefferson Ave, Redwood City, CA 94062
3635 Jefferson Ave, Redwood City, CA 94062
Add your location
Source: CMS Payroll-Based Journal (Q2 2025)
| Role ⓘ | Count ⓘ | Avg Shift (hrs) ⓘ | Uses Contractors? ⓘ |
|---|---|---|---|
| Registered Nurse | 7 | 7.6 | No |
| Licensed Practical Nurse | 31 | 8.3 | Yes |
| Certified Nursing Assistant | 72 | 8.2 | Yes |
| Role ⓘ | Employees ⓘ | Contractors ⓘ | Total Staff ⓘ | Total Hours ⓘ | Days Worked ⓘ | % of Days ⓘ | Avg Shift (hrs) ⓘ |
|---|---|---|---|---|---|---|---|
| Certified Nursing Assistant | 15 | 57 | 72 | 7,472 | 91 | 100% | 8.2 |
| Occupational Therapy Aide | 8 | 0 | 8 | 2,838 | 91 | 100% | 7 |
| Registered Nurse | 7 | 0 | 7 | 2,746 | 89 | 98% | 7.6 |
| Licensed Practical Nurse | 8 | 23 | 31 | 1,542 | 89 | 98% | 8.3 |
| Speech Language Pathologist | 3 | 0 | 3 | 849 | 67 | 74% | 7.1 |
| Other Dietary Services Staff | 2 | 0 | 2 | 833 | 88 | 97% | 7.1 |
| Administrator | 1 | 0 | 1 | 520 | 65 | 71% | 8 |
| Clinical Nurse Specialist | 1 | 0 | 1 | 512 | 64 | 70% | 8 |
| Physical Therapy Assistant | 1 | 0 | 1 | 512 | 64 | 70% | 8 |
| Dental Services Staff | 2 | 0 | 2 | 431 | 54 | 59% | 8 |
| Nurse Practitioner | 1 | 0 | 1 | 336 | 42 | 46% | 8 |
| Medical Director | 0 | 1 | 1 | 224 | 39 | 43% | 5.7 |
| Respiratory Therapy Technician | 1 | 0 | 1 | 176 | 43 | 47% | 4.1 |
| Qualified Social Worker | 1 | 0 | 1 | 55 | 25 | 27% | 2.2 |
California average 12.5
Last Health inspection on Jan 2025
Health citations are formal notices following inspections when they fail to comply with safety and care standards.
26 of 28 citations resulted from standard inspections; and 2 of 28 resulted from complaint investigations.
California average: 0.4
California average: 1
Data sourced from CMS Health Deficiencies reports. Citation severity codes range from A (least serious) to L (most serious). Immediate Jeopardy (J-L) citations indicate situations where the facility's noncompliance has placed residents at risk of death or serious harm.
Source: CMS Long-Term Care Facility Characteristics (Data as of Jan 2026)
Active councils help families stay involved in care decisions and facility operations.
These measures show how residents usually do over time at this home, based on health outcomes and preventive care.
California average: 6.6
California average: 11.3
California average: 11.1%
California average: 12.0%
California average: 11.3%
California average: 1.7%
California average: 5.0%
California average: 1.2%
California average: 4.2%
California average: 6.7%
California average: 10.1%
California average: 98.5%
California average: 98.2%
California average: 94.0%
California average: 1.5%
California average: 93.2%
California average: 23.2%
California average: 11.2%
California average: 0.8%
California average: 53.7%
California average: 50.6%
Quality measures are calculated from Minimum Data Set (MDS) assessments. For most measures, lower percentages indicate better care quality.
Historical financial and operational data for Devonshire Oaks Nursing Center based on CMS SNF Cost Reports.
Loading trend charts...
Care Cost Calculator: See Prices in Your Area
Nursing Home Data Explorer
Don’t Wait Too Long: 7 Red Flag Signs Your Parent Needs Assisted Living Now
The True Cost of Assisted Living in 2025 – And How Families Are Paying For It
Understanding Senior Living Costs: Pricing Models, Discounts & Financial Assistance
We help families find affordable senior communities and unlock same day discounts, Medicaid, and Medicare options tailored to your needs.
Contact us Today
Touring a community? Use this expert-backed checklist to stay organized, ask the right questions, and find the perfect fit.
We'll send you a PDF version of the touring checklist.


