Ennis Care Center

Nursing Home
Overview of Ennis Care Center

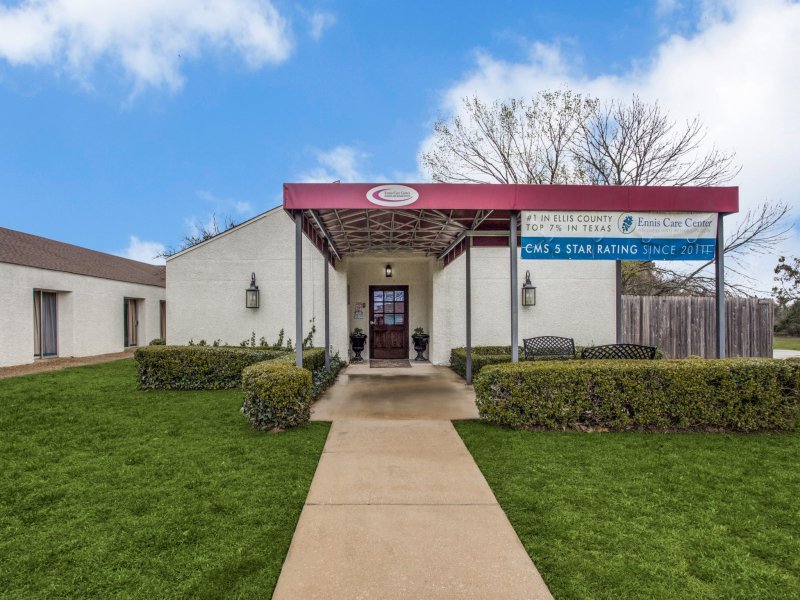
Ennis Care Center is a trusted senior care provider situated in South Street, Ennis, TX, that provides skilled nursing, rehabilitation, and long- and short-term care. The community goes above and beyond to ensure seniors are comfortable and well taken care of. Rest assured that residents experience exceptional comfort with a team of respectful, compassionate, and skilled professionals prepared to lend support in their healing journey.

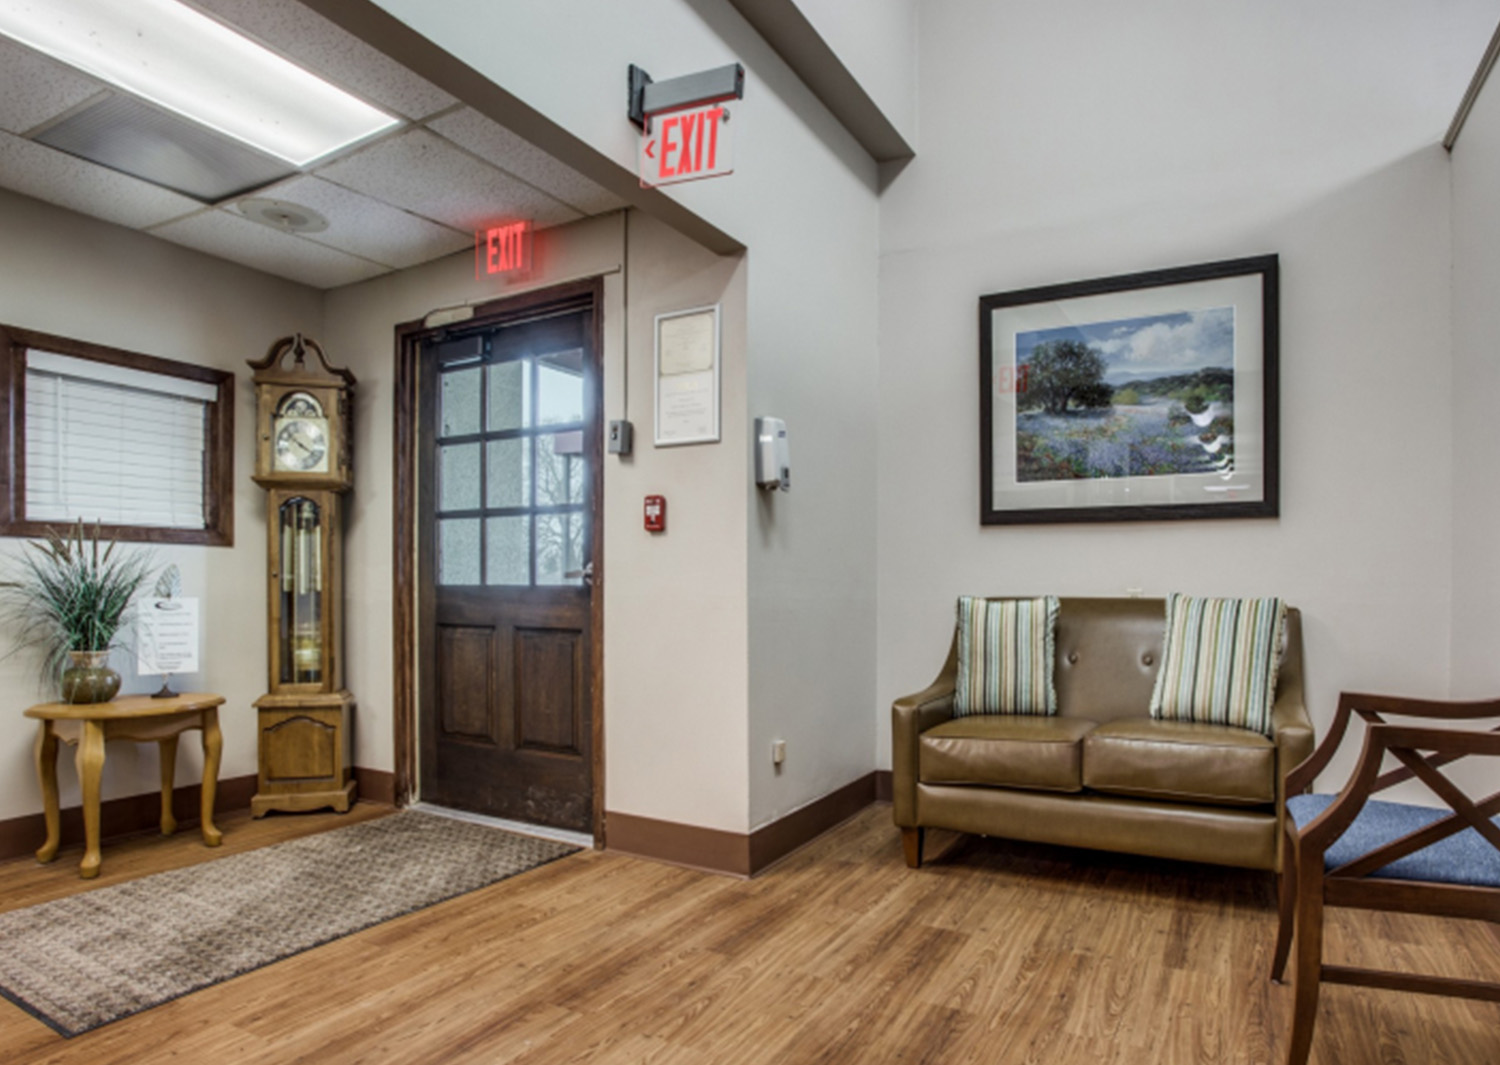
The community is committed to delivering the highest standards of care, utilizing approaches tailored to every resident’s unique needs. With its cozy and warm interior, residents feel at ease knowing they are in safe hands. Promising optimal wellness, the community serves delightful and healthy meals to satisfy residents’ dietary needs and cravings. Ennis Care Center is an ideal place to refresh your mind and find solace with its purposely-made amenities.

(972) 875-9053

Managed by Travvis Dahl

Administrator

Travvis Dahl serves as the Administrator at Ennis Care Center, leading the community with a focus on personalized care and a holistic approach to healing. Under his leadership, the center emphasizes a family-like environment and tailored therapy plans to support each resident's recovery journey.

Quality ratings

Measured by Centers for Medicare & Medicaid Services (CMS)

Overall rating Info Official CMS rating based on health inspections, staffing and quality measures.
1/5
Texas average: 2.8/5
Health Inspection Info Official CMS rating based on deficiencies found during state health inspections.
2/5
Texas average: 2.8/5
Staffing Info Official CMS rating based on nurse staffing hours per resident per day.
1/5
Texas average: 2.1/5
Quality Measures Info Official CMS rating based on clinical outcomes for residents.
3/5
Texas average: 3.8/5

Nursing care per resident

Info Average daily nursing hours per resident (adjusted for acuity). Higher values indicate more nursing time per resident.
2h 54m per day

This home provides 20% less nursing time per resident than the state average.

Texas average: 3h 38m per day

Staffing hours breakdown

Info Hours of care per resident per day, broken down by staff type. Data from CMS Medicare.
Staff type Facility State avg National avg
Registered Nurse (RN) Info Registered nurse hours per resident per day. 18m per day 26m per day 41m per day
LPN / LVN Info Licensed Practical Nurse / Licensed Vocational Nurse hours per resident per day. 1h 7m per day 57m per day 52m per day
Nurse Aide Info Nurse aide hours per resident per day. 1h 31m per day 2h 1m per day 2h 21m per day
Total Nursing (Weekend) Info Total number of nurse staff hours per resident per day on weekends. 2h 19m per day 2h 59m per day 3h 26m per day
Physical Therapist Info Physical therapist staff hours per resident per day. 4m per day 4m per day 4m per day
RN (Weekend) Info Registered nurse hours per resident per day on weekends. 16m per day 21m per day 29m per day

Capacity and availability

Medium-capacity home

Offers a balance of services and community atmosphere.

Total beds 155

This home usually has availability

Lower occupancy suggests more openings may be available.

Lower demand than the Texas average
Occupancy rate 49.3%
Residents per day (avg) 65
Occupancy rate
49.3%
Residents per day (avg)
65

Who this home usually serves

TYPE OF STAY

Mix of rehab and long-term care

This home supports both short-term rehab and long-term care, with residents staying for a wide range of durations.

Breakdown by payment type

Medicare

30% of new residents, usually for short-term rehab.

Typical stay 1 months

Private pay

49% of new residents, often for short stays.

Typical stay 3 months

Medicaid

21% of new residents, often for long-term daily care.

Typical stay 1 - 2 years

Finances and operations

Governmental home
Facility District
Home revenue
$8.5M
Surplus of revenue
$0
Governmental home Facility District
Home revenue
$8,541,176.00
Surplus of revenue
$0.00
Payroll costs Info The portion of the home's budget spent on staff, including nurses, caregivers, and other employees who support care and operations.
$1
0% of revenue
Other operating costs Info All remaining costs needed to run the home, such as food, utilities, building maintenance, supplies and administrative expenses.
$8.5M
Total costs $8.5M
Bed community size
155-bed community
A large-scale community that may provide a wide range of amenities, services, and structured programs.
Years in operation
54 years in operation
A longer operating history, which may indicate experience navigating regulations and delivering ongoing care.
Walk Score
Walk Score: 43 / 100
Somewhat walkable. A few nearby services may be reachable on foot, but most trips require transportation.

Services

MEDICARE/MEDICAID

About this community

License Status
Active
Facility Type
Nursing
License Date
January 4, 2024
License Expiration
January 4, 2027

Additional licensing details

License number: 149872
Year opened: 9/1/1971
County: ELLIS

Ownership & operating entity

Ennis Care Center is administrated by ROBERT REESE.

Management company: CAPSTONEENNIS OPCO LLC
Owner: FANNIN COUNTY HOSPITAL AUTHORITY
Ownership type: HOSPITAL DISTRICT/AUTHORITY

Type Of Units

Medicare
50 units
Medicaid and Medicare
105 units
Total beds
155 units

Staffing

Key information about the people who lead and staff this community.

Leadership

What does this home offer?

Types of Care at Ennis Care Center

Compare Nursing Homes around Ennis

The information below is reported by the Texas Health and Human Services Commission.
Ennis Care Center
SNF

Nursing Homes 24/7 care needed

Ennis
155
No
43
ENNIS NURSING AND REHAB CENTER LLC
49.3%
$8,204,078.00
$1.00
0%
64.50
1/5
2.9035
2/5
1/5
3/5
3
20
3
+48%
-20%
-22%

Places of interest near Ennis Care Center

Address 1.6 miles from city center — 0.53 miles to nearest hospital (Ennis Childrens Clinic)

Address 1200 S Hall St, Ennis, TX 75119

Calculate Travel Distance to Ennis Care Center

Add your location

Address

Staffing Data

Source: CMS Payroll-Based Journal (Q2 2025)

81
Total Staff
73
Employees
8
Contractors
24,948
Total Hours (Quarter)
34
Avg Staff/Day
8.1
Avg Shift (hrs)
Nursing Staff Breakdown
Role Count Avg Shift (hrs) Uses Contractors?
Registered Nurse98.6 No
Licensed Practical Nurse119.9 No
Certified Nursing Assistant248 Yes
Staff by Category
Administration
2 staff
7.5hs shift avg
Nursing Staff
52 staff
8.8hs shift avg
Physicians & Practitioners
3 staff
7.3hs shift avg
Therapy Services
18 staff
7.2hs shift avg
Activities & Recreation
0 staff
0hs shift avg
Social Services
3 staff
6.9hs shift avg
Dietary Services
1 staff
8hs shift avg
Other Services
2 staff
7.9hs shift avg
Contractor Analysis
0.7%
of total hours from contractors
182 contractor hours this quarter
Certified Nursing Assistant: 2 Feeding Assistant: 2 Medical Director: 1 Dental Services Staff: 1 Physician Assistant: 1 Occupational Therapy Assistant: 1
Role Employees Contractors Total Staff Total Hours Days Worked % of Days Avg Shift (hrs)
Certified Nursing Assistant222247,32191100%8
Licensed Practical Nurse110114,32291100%9.9
Physical Therapy Aide8083,1306774%7.4
Speech Language Pathologist6062,2556774%7.1
Registered Nurse9091,78191100%8.6
RN Director of Nursing3031,5797987%9
Medication Aide/Technician3031,0478593%11.8
Qualified Social Worker3039026875%6.9
Administrator1015126470%8
Other Dietary Services Staff1015126470%8
Mental Health Service Worker1015046369%8
Nurse Practitioner1014966268%8
Respiratory Therapy Technician1013596268%5.8
Occupational Therapy Aide2025989%7.4
Feeding Assistant022522123%2.4
Dental Services Staff0113967%6.5
Other Physician10130910%3.3
Medical Director0113089%3.8
Occupational Therapy Assistant0111722%8.5
Physician Assistant011211%2

Health Inspection History

Inspections
Total health inspections 6

Texas average 7.4


Last Health inspection on May 2025

Total health citations 20
Citations per inspection
3.33

Health citations are formal notices following inspections when they fail to comply with safety and care standards.

13 of 20 citations resulted from standard inspections; 6 of 20 resulted from complaint investigations; and 1 of 20 came from combined inspections (standard and complaint).

Breakdown of citation severity (last 3 years)
Critical Health citations More info 3
50% worse than Texas average

Texas average: 2


Serious Health citations More info 0
100% better than Texas average

Texas average: 0.4

3 critical citations More info Texas average: 2

0 serious citations More info Texas average: 0.4

17 moderate citations More info Texas average: 23

0 minor citations More info Texas average: 0.4
Citations history (last 3 years)
Resident Rights moderate citation May 19, 2025
Corrected

Abuse/Neglect moderate citation Mar 13, 2025
Corrected

Nutrition moderate citation Mar 13, 2025
Corrected

Pharmacy moderate citation Mar 13, 2025
Corrected

Facility Characteristics

Source: CMS Long-Term Care Facility Characteristics (Data as of Jan 2026)

Ownership: For-Profit Corporation
Part of: EDURO HC
Resident Census by Payment Source
155 Total Residents
Medicare 46 (29.7%)
Medicaid 109 (70.3%)
Specialized Care Beds
28 Total Specialty Beds
18.1% of Bed Capacity
28
Alzheimer's / Dementia Beds
18.1%
Programs & Services
Residents' Group
Family Engagement

Active councils help families stay involved in care decisions and facility operations.

Quality of care over time

These measures show how residents usually do over time at this home, based on health outcomes and preventive care.

High-risk clinical events score Info A composite score based on pressure ulcers, falls with injury, weight loss, walking ability decline, and activities of daily living decline. 7.6
11% better than Texas average

Texas average: 8.6

Functional decline score Info A composite score based on activities of daily living decline, walking ability decline, and incontinence. 11.4
29% better than Texas average

Texas average: 16.0

Long-stay resident measures
Need for Help with Daily Activities Increased Info Percent of long-stay residents whose need for help with daily activities has increased 20.5%
27% worse than Texas average

Texas average: 16.2%

Walking Ability Worsened Info Percent of long-stay residents whose ability to move independently worsened 7.9%
52% better than Texas average

Texas average: 16.2%

Low Risk Residents with Bowel/Bladder Incontinence Info Percent of low risk long-stay residents who lose control of their bowels or bladder 6.0%
62% better than Texas average

Texas average: 15.7%

Falls with Major Injury Info Percent of long-stay residents experiencing one or more falls with major injury 5.6%
73% worse than Texas average

Texas average: 3.2%

High Risk Residents with Pressure Ulcers Info Percent of long-stay high risk residents with pressure ulcers 1.1%
75% better than Texas average

Texas average: 4.4%

Urinary Tract Infection Info Percent of long-stay residents with a urinary tract infection 1.3%
57% worse than Texas average

Texas average: 0.8%

Lost Too Much Weight Info Percent of long-stay residents who lose too much weight 3.2%
7% better than Texas average

Texas average: 3.5%

Depressive Symptoms Info Percent of long-stay residents who have depressive symptoms 4.1%
44% worse than Texas average

Texas average: 2.9%

Antipsychotic Use Info Percent of long-stay residents who received an antipsychotic medication 0.0%
100% better than Texas average

Texas average: 7.9%

Pneumococcal Vaccine Info Percent of long-stay residents assessed and appropriately given the pneumococcal vaccine 100.0%
In line with Texas average

Texas average: 97.3%

Influenza Vaccine Info Percent of long-stay residents assessed and appropriately given the seasonal influenza vaccine 100.0%
In line with Texas average

Texas average: 97.9%

Hospitalizations per 1,000 days Info Number of hospitalizations per 1,000 long-stay resident days. 2.35
10% worse than Texas average

Texas average: 2.13

ED visits per 1,000 days Info Number of outpatient emergency department visits per 1,000 long-stay resident days. 2.03
In line with Texas average

Texas average: 2.07

Short-stay resident measures
Pneumococcal Vaccine Info Percent of short-stay residents assessed and appropriately given the pneumococcal vaccine 98.7%
9% better than Texas average

Texas average: 90.4%

Antipsychotic medication increase Info Percent of short-stay residents who newly received an antipsychotic medication 3.0%
106% worse than Texas average

Texas average: 1.4%

Influenza Vaccine Info Percent of short-stay residents assessed and appropriately given the seasonal influenza vaccine 100.0%
14% better than Texas average

Texas average: 88.0%

Re-hospitalized after SNF stay Info Percentage of short-stay residents who were re-hospitalized after their nursing home admission. 33.9%
31% worse than Texas average

Texas average: 25.9%

Emergency department visits Info Percentage of short-stay residents who had an outpatient emergency department visit. 16.3%
36% worse than Texas average

Texas average: 12.0%

Falls with major injury Info Percentage of SNF residents who experience falls with major injury during their stay. 3.0%
294% worse than Texas average

Texas average: 0.8%

Ability to care for self at discharge Info Percentage of residents at or above expected ability to care for themselves at discharge. 59.3%
10% better than Texas average

Texas average: 53.7%

Successful return to home or community Info Rate of successful return to home or community from a skilled nursing facility. 49.5%
In line with Texas average

Texas average: 50.6%

Penalties and fines

Federal penalties imposed by CMS for regulatory violations, including civil money penalties (fines) and denials of payment for new Medicare/Medicaid admissions.

Source: CMS Penalties Database (Data as of Jan 2026)

Total fines amount $191K
137% higher than Texas average

Texas average: $80K

Number of fines 3
21% more fines than Texas average

Texas average: 2.5

Payment Denials Info Serious action where Medicare and/or Medicaid temporarily stops payments for new residents until issues are fixed. 1
354% more payment denials than Texas average

Texas average: 0.2

Fines amount comparison
This facility $191K
Texas average $80K
Penalty History

Penalties are imposed by CMS for violations of federal nursing home regulations.

Civil Money Penalty Info Fines imposed for noncompliance, which can be assessed per day or per instance of violation. May 19, 2025
$10K
Civil Money Penalty Info Fines imposed for noncompliance, which can be assessed per day or per instance of violation. Feb 1, 2024
$31K
Payment Denial Info Serious action where Medicare and/or Medicaid temporarily stops payments for new residents until issues are fixed. Feb 1, 2024
5 days
Civil Money Penalty Info Fines imposed for noncompliance, which can be assessed per day or per instance of violation. Aug 11, 2023
$150K

Last updated: Jan 2026

Guides for Better Senior Living

Care Cost Calculator: See Prices in Your Area

Nursing Home Data Explorer

Don’t Wait Too Long: 7 Red Flag Signs Your Parent Needs Assisted Living Now

The True Cost of Assisted Living in 2025 – And How Families Are Paying For It

Understanding Senior Living Costs: Pricing Models, Discounts & Financial Assistance

Financial Aid for Texas Seniors

Get financial aid guidance

Community Care for the Aged and Disabled (CCAD)

TX Medicaid CCAD

Age 65+ or disabled, Texas resident, Medicaid-eligible, care need (not always nursing home level).

~$2,829/month (300% FBR, individual).

$2,000 (individual), $3,000 (couple).

Large state; rural access challenges.

Texas Community Care Services

TX CCS

Age 60+, Texas resident, at risk of decline.

~$2,000/month (individual, varies).

$5,000 (individual).

Limited funding; high demand in urban areas.

Area Agency on Aging (AAA) Services

Texas AAA Services

Age 60+, TX resident; no income/asset limits.

None; donations encouraged.

Not assessed.

28 AAAs; includes Meals on Wheels in some areas.

Medicare Savings Program (MSP)

Texas Medicare Savings Program

Age 65+ or disabled, TX resident, Medicare Part A/B.

~$2,510/month (QMB), ~$3,380/month (SLMB), ~$3,598/month (QI)—individual.

$9,430 (individual), $14,130 (couple).

Includes Extra Help for Part D; no waitlist.

Low-Income Home Energy Assistance Program (LIHEAP)

Texas Comprehensive Energy Assistance Program (CEAP)

Age 60+ prioritized, TX resident, low-income.

~$3,970/month (185% FPL).

Not assessed.

Priority for elderly/disabled; covers gas, electric, propane.

Family Caregiver Support Program (FCSP)

Texas Family Caregiver Support Program

Caregivers of 60+ needing care or 55+ caregivers of others; TX resident; 2+ ADLs.

No strict cap; prioritizes low-income (~$24,980/year).

Not assessed.

High rural demand; includes grandparent caregivers.

Senior Community Service Employment Program (SCSEP)

Texas SCSEP

Age 55+, unemployed, low-income, TX resident.

~$1,983/month (125% FPL).

Not specified.

Priority for veterans, rural residents; AARP partnership.

VA Aid and Attendance (A&A) and Housebound Benefits

Texas VA Aid and Attendance/Housebound

Age 65+ or disabled veteran/spouse, TX resident, wartime service, ADL help (A&A) or homebound.

Net income < ~$1,984/month (veteran with dependent, A&A); pension offsets income.

~$155,356 (net worth).

High veteran population; supports rural/urban needs.

Property Tax Exemption for Seniors

Texas Senior Property Tax Exemption

Age 65+, TX resident, homeowner (homestead).

None; tax-based eligibility.

Not assessed.

$25,000+ exemption; optional freeze in some counties; saves ~$500-$1,000/year.

Senior Farmers’ Market Nutrition Program (SFMNP)

Texas SFMNP

Age 60+, TX resident, low-income.

~$2,322/month (185% FPL).

Not assessed.

Vouchers (~$50/season); serves ~20,000 via 28 AAAs.

Who we are

Your Senior Care Partner, Every Step of the Way

We help families find affordable senior communities and unlock same day discounts, Medicaid, and Medicare options tailored to your needs.

Contact us Today
Tour Icon
Planning a tour? Check our touring checklist.
Chat Icon
Thinking of living here? We can help you speak to a current resident