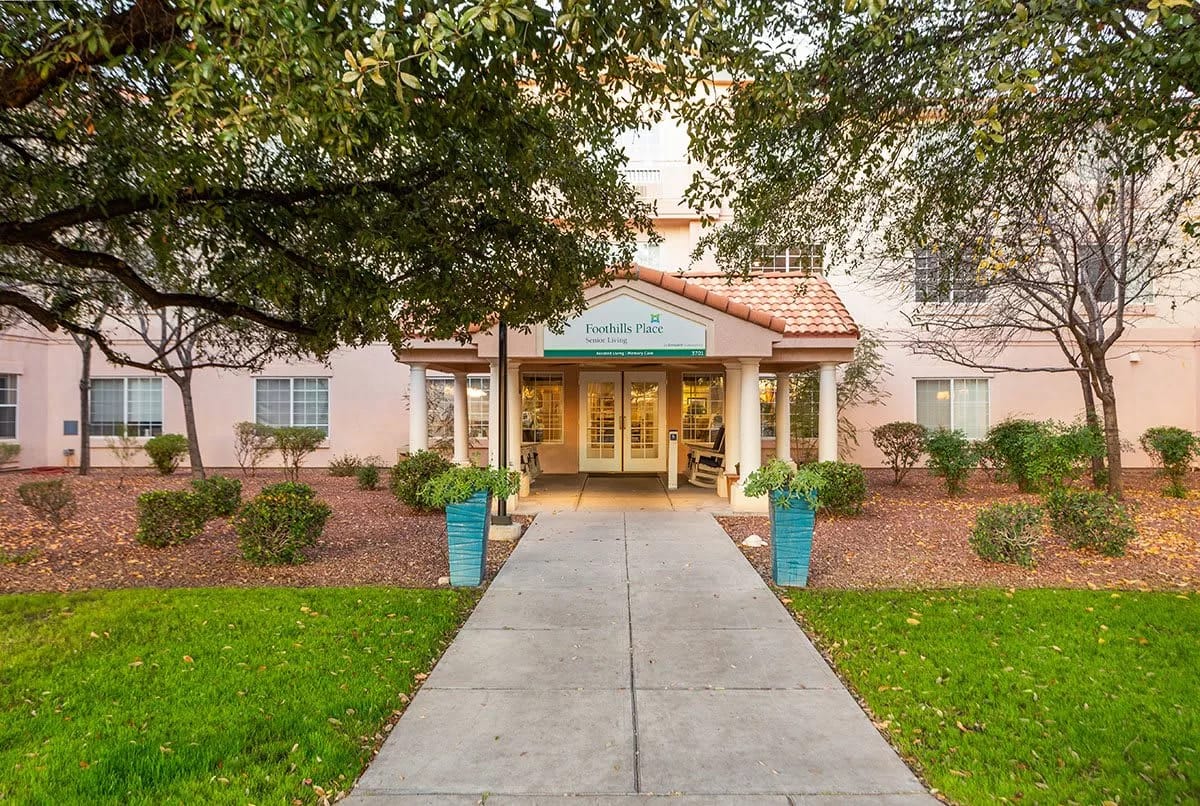
Foothills Place
Nursing Home & Assisted Living · Tucson, AZ
CMS overall rating Info CMS (the Centers for Medicare & Medicaid Services) is the federal agency that rates nursing home quality. Its Overall Rating runs from 1 to 5 stars, combining health inspections, staffing, and quality measures, with inspections weighted most heavily.

Foothills Place

Nursing Home & Assisted Living · Tucson, AZ
CMS overall rating Info CMS (the Centers for Medicare & Medicaid Services) is the federal agency that rates nursing home quality. Its Overall Rating runs from 1 to 5 stars, combining health inspections, staffing, and quality measures, with inspections weighted most heavily.
Calculator: See prices in your area
Foothills Place accepts Medicare, Medicaid, and private pay.

Overview of Foothills Place

A member of the Enlivant senior living group, Foothills Place in Catalina, Tucson is an assisted living and memory care community that approaches senior living care with quality assistance and efficient services. Foothills Place heavily promotes independence for their residents to maintain a sense of individuality to live life on their own terms. The assisted living community aims to provide a vibrant environment for residents to feel a sense of belonging by providing personal care plans that lead to meeting the social, emotional, mental, and physical wellness of each. The professional staff of Foothills highly encouraged them to make deep connections between residents– a bond built on trust and respect. Foothills Place is the ideal place for seniors looking to thrive in a community that understands the every basic need of an adult. 
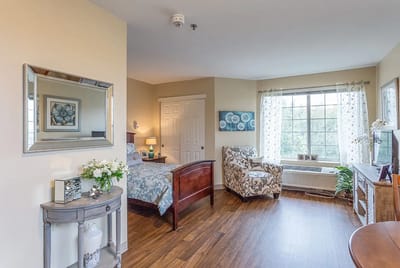
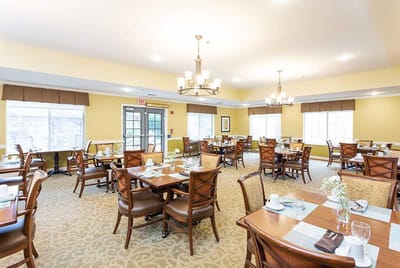
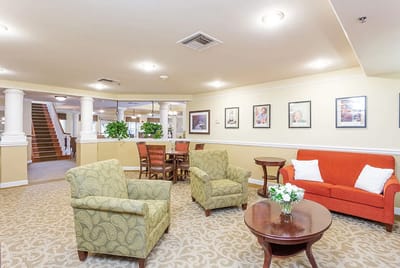
Accommodations at Foothills Place are exerted through efficiency and genuinity. This approach allows for seniors and their families to trust and relax that their best intentions are being put first. Foothills’ services offered are designed to allow flexibility for families, these include respite care, short-terms stays, and urgent placement– living options allowing the staff to adapt to any necessary and immediate need. Some community amenities to highlight are the hair salon, apartment maintenance, housekeeping and laundry services, community outings, and activities.  

(520) 200-3539

Quality ratings

Measured by Centers for Medicare & Medicaid Services (CMS)

Overall rating Info The Overall CMS Rating combines results from health inspections, staffing levels and quality measures. Health inspections carry the most weight. Staffing and quality scores can increase or decrease the final rating based on performance compared to state and national standards.
▲ 20.6% Above AZ avg. ▲ 20.6% Above AZ avg.AZ average: 3.3Click the badge to see the full State ranking.Click here to see the full State ranking.
Health Inspection Info Based on the results of the facility's three most recent standard inspections and any complaint investigations. CMS reviews the number, scope, and severity of deficiencies, with more recent findings weighted more heavily.
▲ 44.4% Above AZ avg. ▲ 44.4% Above AZ avg.AZ average: 2.8Click the badge to see the full State ranking.Click here to see the full State ranking.
Staffing Info Measures average nursing staff hours per resident per day, including Registered Nurses (RNs) and total nursing staff. Ratings are adjusted based on the level of care residents require and are compared to state and national benchmarks.
At AZ avg. At AZ avg.AZ average: 3.0Click the badge to see the full State ranking.Click here to see the full State ranking.
Quality Measures Info Based on clinical and physical health indicators reported to CMS, such as hospital readmissions, falls, pressure ulcers, and improvements in mobility. These measures reflect how well residents' health needs are being managed.
▼ 11.3% Below AZ avg. ▼ 11.3% Below AZ avg.AZ average: 4.5Click the badge to see the full State ranking.Click here to see the full State ranking.

Staffing hours breakdown

Info Daily nursing hours per resident by staff type, reported to CMS. Higher is generally better — compare this facility to state and national averages to see where staffing stands.

Hours per resident per day — compared to Arizona state averages

Total nursing care / resident Info This home is ranked 30th out of 71 homes in Arizona for nurse hours. Total adjusted nursing hours per resident per day, combining RN, LPN, and aide time. CMS adjusts this for case-mix so facilities can be fairly compared.
4h 1m per day
Rank #30 / 71Nurse hours — State benchmarkedThis home is ranked 30th out of 71 homes in Arizona. Shows adjusted nurse hours per resident per day benchmarked to the Arizona average, with a ranking across 71 Arizona facilities. More hours mean more direct care. The national average is about 3.5 hrs; below 3.0 is a red flag.Ranking totals vary by category as each rank only includes facilities that report data for that metric. Homes missing that data point aren't included in the ranking.Click the rank badge to see the full State ranking.Click here to see the full State ranking.
This facility Arizona avg (4h 4m per day)
vs Arizona avg
-1%

3 of 6 metrics below state avg

Standout metric Physical Therapist is +33% above state avg
Staff typeHours / Day / Residentvs state avg
Registered Nurse (RN) Info RNs hold the highest nursing license and can assess residents, interpret test results, and direct care plans. More RN hours per day often signals stronger clinical oversight and faster response to health changes. 34m per day ▼ 22% State avg: 43m per day · National avg: 41m per day
LPN / LVN Info Licensed Practical Nurses (LPNs) or Licensed Vocational Nurses (LVNs) deliver routine hands-on care — medication administration, wound dressing, and monitoring vital signs. They work under RN supervision and make up a large share of daily bedside care. 54m per day ▼ 15% State avg: 1h 3m per day · National avg: 52m per day
Nurse Aide Info Certified Nurse Aides (CNAs) provide the most direct day-to-day assistance: bathing, dressing, feeding, and mobility. Nurse aide hours are typically the largest staffing category and directly affect residents' quality of life. 2h 58m per day ▲ 27% State avg: 2h 20m per day · National avg: 2h 20m per day
Weekend Total Nursing Info Combined nursing hours (RN + LPN + Nurse Aide) per resident per day on weekends. Staffing often drops on weekends — this figure reveals whether the facility maintains adequate coverage outside of weekday hours. 3h 49m per day ▲ 5% State avg: 3h 39m per day · National avg: 3h 27m per day
Physical Therapist Info Hours per resident per day provided by licensed Physical Therapists (PTs) or PT Assistants. PT services help residents recover mobility after injury or illness and are especially important for post-acute (short-stay) rehabilitation. 8m per day ▲ 33% State avg: 6m per day · National avg: 4m per day
Weekend RN Info Registered nurse hours specifically on weekends. Facilities sometimes reduce RN presence on Saturdays and Sundays — a low weekend RN figure compared to weekday hours can indicate reduced clinical oversight when most administrative staff are absent. 25m per day ▼ 19% State avg: 31m per day · National avg: 29m per day

Capacity and availability

This home usually has availability

Lower occupancy than the Arizona average: 72.7%
Occupancy rate
57.1% Rank #54 / 76Occupancy rate — State benchmarkedThis home is ranked 54th out of 76 homes in Arizona. Shows this facility's occupancy rate versus the Arizona average, with its Statewide rank out of 76. Higher occupancy signals strong local demand and financial stability.Ranking totals vary by category as each rank only includes facilities that report data for that metric. Homes missing that data point aren't included in the ranking.Click the rank badge to see the full State ranking.Click here to see the full State ranking.
Avg. Length of Stay
34 days
Bed community size
66-bed community
A moderately sized community that may balance personal attention with shared amenities and social activities.
Walk Score
Walk Score: 27 / 100
Somewhat walkable. A few nearby services may be reachable on foot, but most trips require transportation.
BBB Rating
BBB Rating: A+ (Not Accredited)
An independent rating from the Better Business Bureau based on factors such as complaint history, transparency, and business practices.
How BBB ratings work

About this community

Contact Foothills Place

Health Inspection History

Inspections since 2022
Total health inspections 2

Arizona average 6.3


Last Health inspection on Apr 2025

Total health citations
11 Rank #15 / 75Health citations — State benchmarkedThis home is ranked 15th out of 75 homes in Arizona. Shows this facility's total health deficiency citations benchmarked to the Arizona State average, with a ranking across all 75 AZ facilities. Lower citation counts earn a better rank.Ranking totals vary by category as each rank only includes facilities that report data for that metric. Homes missing that data point aren't included in the ranking.Click the rank badge to see the full State ranking.Click here to see the full State ranking.

Arizona average 23.2

Citations per inspection
5.5 Rank #66 / 75Citations per inspection — State benchmarkedThis home is ranked 66th out of 75 homes in Arizona. Shows average deficiency citations per CMS inspection for this facility versus the Arizona mean across 75 facilities with citation data. Lower is better.Ranking totals vary by category as each rank only includes facilities that report data for that metric. Homes missing that data point aren't included in the ranking.Click the rank badge to see the full State ranking.Click here to see the full State ranking.

Arizona average 3.82


Health citations are formal notices following inspections when they fail to comply with safety and care standards.

8 of 11 citations resulted from standard inspections; and 3 of 11 came from combined inspections (standard and complaint).

Breakdown of citation severity (last 4 years)
Critical health citations
0
100% better than Arizona average

Arizona average: 0.1


Serious health citations
1
67% worse than Arizona average

Arizona average: 0.6

0 critical citations Arizona average: 0.1

1 serious citation Arizona average: 0.6

10 moderate citations Arizona average: 22.3

0 minor citations Arizona average: 0.2
Citations history (last 4 years)
Abuse/Neglect moderate citation Apr 11, 2025
Corrected

Administration moderate citation Apr 11, 2025
Corrected

Quality of Care moderate citation Apr 11, 2025
Corrected

Resident Rights moderate citation Apr 11, 2025
Corrected

Staffing Data

Reporting period: October 1 – December 31, 2025 (Q4 2025). Source: CMS Payroll-Based Journal report.

Total staff 161
Employees 161
Contractors 0
Staff to resident ratio 2.44 : 1
35% more staff per resident than Arizona average
Arizona average ratio: 1.80 : 1 Arizona average ratio: 1.80 : 1See full Arizona ranking
Avg staff/day 51
Average shift 7.7 hours
9% worse than Arizona average
Arizona average: 8.5 hours Arizona average shift: 8.5 hoursSee full Arizona ranking
Total staff hours (quarter) 35,911

Nursing staff breakdown

Q4 2025 · Oct 1 – Dec 31 More info This data comes from the CMS Payroll-Based Journal report covering October 1 – December 31, 2025.
Registered Nurse

Manages medical care and health needs.

RN Staff Info All 10 RN Staff are full-time employees. No contractors work on this role. 10
Average shift length Info Average shift length. Calculated as total hours divided by days worked and average staff per day. 10 hours
Licensed Practical Nurse

Assists with medical care and medications.

LPN Staff Info All 23 LPN Staff are full-time employees. No contractors work on this role. 23
Average shift length Info Average shift length. Calculated as total hours divided by days worked and average staff per day. 8.9 hours
Certified Nursing Assistant

Helps with daily care and mobility.

CNA Staff Info All 53 CNA Staff are full-time employees. No contractors work on this role. 53
Average shift length Info Average shift length. Calculated as total hours divided by days worked and average staff per day. 7.6 hours

Contractor staffing

Q4 2025 · Oct 1 – Dec 31 More info This data comes from the CMS Payroll-Based Journal report covering October 1 – December 31, 2025.
Total hours from contractors 0% — all staff are direct employees this quarter

Staff by category

Q4 2025 · Oct 1 – Dec 31 More info This data comes from the CMS Payroll-Based Journal report covering October 1 – December 31, 2025.
Certified Nursing Assistant5305311,31992100%7.6
Nurse Aide in Training180185,05092100%7.5
Licensed Practical Nurse230234,68992100%8.9
Registered Nurse100102,0378289%10
Physical Therapist5052,03192100%6.6
Speech Language Pathologist7071,4966975%6.4
Physical Therapy Aide6061,2536672%7
Dental Services Staff5051,2238289%8.1
Physical Therapy Assistant7071,1717278%6.4
Medication Aide/Technician4041,1427582%9.5
Respiratory Therapy Technician3038146773%6.2
Clinical Nurse Specialist4046676267%8.7
Qualified Social Worker8086516267%5.9
Administrator2026406975%6.5
RN Director of Nursing2026156672%8.9
Nurse Practitioner1015946672%9
Other Dietary Services Staff2025086065%6.4
Occupational Therapy Aide1011244%3.1
53 Certified Nursing Assistant
% of Days 100%
18 Nurse Aide in Training
% of Days 100%
23 Licensed Practical Nurse
% of Days 100%
10 Registered Nurse
% of Days 89%
5 Physical Therapist
% of Days 100%
7 Speech Language Pathologist
% of Days 75%
6 Physical Therapy Aide
% of Days 72%
5 Dental Services Staff
% of Days 89%
7 Physical Therapy Assistant
% of Days 78%
4 Medication Aide/Technician
% of Days 82%
3 Respiratory Therapy Technician
% of Days 73%
4 Clinical Nurse Specialist
% of Days 67%
8 Qualified Social Worker
% of Days 67%
2 Administrator
% of Days 75%
2 RN Director of Nursing
% of Days 72%
1 Nurse Practitioner
% of Days 72%
2 Other Dietary Services Staff
% of Days 65%
1 Occupational Therapy Aide
% of Days 4%

Penalties and fines

Federal penalties imposed by CMS for regulatory violations, including civil money penalties (fines) and denials of payment for new Medicare/Medicaid admissions.

Source: CMS Penalties Database

No penalties in the past 3 years

No civil money penalties or payment denials were reported in the last 3 years.

Quality of care over time

These measures show how residents usually do over time at this home, based on health outcomes and preventive care.

High-risk clinical events score Info A composite score based on pressure ulcers, falls with injury, weight loss, walking ability decline, and activities of daily living decline. 3.3
56% better than Arizona average

Arizona average: 7.6

Functional decline score Info A composite score based on activities of daily living decline, walking ability decline, and incontinence. 19.4
21% worse than Arizona average

Arizona average: 16.1

Long-stay resident measures
Need for Help with Daily Activities Increased Info Percent of long-stay residents whose need for help with daily activities has increased 6.6%
41% better than Arizona average

Arizona average: 11.2%

Low Risk Residents with Bowel/Bladder Incontinence Info Percent of low risk long-stay residents who lose control of their bowels or bladder 32.2%
54% worse than Arizona average

Arizona average: 20.8%

Falls with Major Injury Info Percent of long-stay residents experiencing one or more falls with major injury 0.0%
100% better than Arizona average

Arizona average: 2.1%

High Risk Residents with Pressure Ulcers Info Percent of long-stay high risk residents with pressure ulcers 1.3%
74% better than Arizona average

Arizona average: 5.1%

Urinary Tract Infection Info Percent of long-stay residents with a urinary tract infection 0.0%
100% better than Arizona average

Arizona average: 1.3%

Lost Too Much Weight Info Percent of long-stay residents who lose too much weight 5.4%
In line with Arizona average

Arizona average: 5.4%

Depressive Symptoms Info Percent of long-stay residents who have depressive symptoms 2.9%
35% better than Arizona average

Arizona average: 4.5%

Antipsychotic Use Info Percent of long-stay residents who received an antipsychotic medication 2.6%
75% better than Arizona average

Arizona average: 10.3%

Pneumococcal Vaccine Info Percent of long-stay residents assessed and appropriately given the pneumococcal vaccine 97.5%
In line with Arizona average

Arizona average: 97.2%

Influenza Vaccine Info Percent of long-stay residents assessed and appropriately given the seasonal influenza vaccine 95.0%
In line with Arizona average

Arizona average: 94.6%

Short-stay resident measures
Pneumococcal Vaccine Info Percent of short-stay residents assessed and appropriately given the pneumococcal vaccine 88.1%
In line with Arizona average

Arizona average: 91.5%

Antipsychotic medication increase Info Percent of short-stay residents who newly received an antipsychotic medication 0.9%
12% better than Arizona average

Arizona average: 1.0%

Influenza Vaccine Info Percent of short-stay residents assessed and appropriately given the seasonal influenza vaccine 81.8%
6% worse than Arizona average

Arizona average: 87.3%

Breakdown by payment type

Medicare

13% of new residents, usually for short-term rehab.

Typical stay 22 days

Private pay

73% of new residents, often for short stays.

Typical stay 16 days

Medicaid

15% of new residents, often for long-term daily care.

Typical stay 4 - 5 months

Facility Characteristics

Source: CMS Long-Term Care Facility Characteristics (Data as of Jan 2026)

Total residents 66
Medicare
8
12.1% of residents
Medicaid
31
47% of residents
Private pay or other
27
40.9% of residents
Programs & Services
Residents Group

Residents meet regularly to discuss policies, care quality, and activities

CCRC

Part of a Continuing Care Retirement Community offering multiple care levels

Active Resident Council

Organized group of residents that meets regularly to discuss facility policies, quality of life, and activities.

Finances and operations

Based on CMS SNF Cost Report for fiscal year ending in 12/2023.

Privately-owned community
Operated by a single business entity.
Net patient revenue Info Net patient revenue — what the home actually collects for resident care, after contractual allowances, bad debt and discounts are subtracted from its gross charges (CMS cost report, Worksheet G-3). It covers resident care only; money the home earns from other sources is shown separately as "Other income."
$9.5M
Net patient income Info Net patient income: net patient revenue minus the home's total operating expenses. A positive figure means it earns more from resident care than it spends to deliver it; a negative figure means the opposite. It excludes non-operating "other income."
-$1.5M
Privately-owned community Operated by a single business entity.
Net patient revenue Info Net patient revenue — what the home actually collects for resident care, after contractual allowances, bad debt and discounts are subtracted from its gross charges (CMS cost report, Worksheet G-3). It covers resident care only; money the home earns from other sources is shown separately as "Other income."
$9.5M Rank #44 / 79Revenue — State benchmarkedThis home is ranked 44th out of 79 homes in Arizona. Shows this facility's annual revenue compared to the Arizona average. Higher revenue generally means more resources for staffing and capital — read alongside Payroll %.Ranking totals vary by category as each rank only includes facilities that report data for that metric. Homes missing that data point aren't included in the ranking.Click the rank badge to see the full State ranking.Click here to see the full State ranking.
Net patient income Info Net patient income: net patient revenue minus the home's total operating expenses. A positive figure means it earns more from resident care than it spends to deliver it; a negative figure means the opposite. It excludes non-operating "other income."
-$1.5M
Other income Info Money the home earns outside of resident care — such as investments, grants, rentals and other non-operating sources (CMS cost report, Worksheet G-3). It is tracked separately from net patient revenue: it is not part of that figure, and it is not included in net patient income.
$136.1K
Payroll costs Info Staff salaries plus wage-related costs — benefits such as payroll taxes, health insurance and retirement — from the home's own accounting records (CMS cost report, Worksheet A). Contract or agency labor is counted separately, under other operating costs. Rank #56 / 79Payroll — State benchmarkedThis home is ranked 56th out of 79 homes in Arizona. Shows total annual staff payroll benchmarked to the Arizona average. Higher payroll investment relative to peers often signals better staffing and less reliance on cheaper contract labor.Ranking totals vary by category as each rank only includes facilities that report data for that metric. Homes missing that data point aren't included in the ranking.Click the rank badge to see the full State ranking.Click here to see the full State ranking.
$5.2M 54.6% of net patient revenue Info Payroll as a share of revenue: staff salaries and wage-related benefits divided by net patient revenue. A higher figure means more of each revenue dollar goes to staff pay. Rank #48 / 79Payroll % — State benchmarkedThis home is ranked 48th out of 79 homes in Arizona. Shows payroll as a percentage of revenue versus the Arizona average. Well-run Arizona facilities typically land around 58–71% — the top third Statewide. Below 25% may signal understaffing or heavy agency use — read with Staffing ratings.Ranking totals vary by category as each rank only includes facilities that report data for that metric. Homes missing that data point aren't included in the ranking.Click the rank badge to see the full State ranking.Click here to see the full State ranking.
Other operating costs Info Everything it costs to run the home apart from payroll — food, utilities, supplies, maintenance, contract labor and administration. Calculated as total operating expense minus payroll (staff salaries and wage-related benefits).
$5.8M
Total costs Info The home's total operating expense for the year — all the costs of running it, salaries included (CMS cost report, Worksheet G-3).
$11.0M

Who this home usually serves

TYPE OF STAY

Primarily long-term care, limited rehab

Most residents stay long-term, while a smaller portion are admitted for short-term rehab.

Most new residents arrive under private pay (73% of admissions), and a typical private pay stay runs around 16 days.

Admissions
404 total

Coverage residents most often arrive under.

Medicare 13%
Private pay 73%
Medicaid 15%
Discharges
409 total

Coverage residents most often leave under.

Medicare 13%
Private pay 71%
Medicaid 16%

Places of interest near Foothills Place

Address 4.9 miles from city center Info Estimated distance in miles from Tucson's city center to Foothills Place's address, calculated via Google Maps. — 1.37 miles to nearest hospital (Fresenius Medical Care at Healthsouth Rehabilitiation Institu)

Calculate Travel Distance to Foothills Place

Add your location

Address

Compare Nursing Home around Tucson

The information below is reported by the Arizona Department of Health Services, Bureau of Long Term Care Licensing.

5 facilities compared · CMS & AZ Dept. of Health data

Splendido at Rancho Vistoso
NH
AL
HC
MC
RC
Tucson42
84.9%
Facility 84.9%
AZ AVG 72.7%
Rank #26 / 76
+17%
5.13
Facility 5.13
AZ AVG 4.06
Rank #9 / 71
-4%+26%
$8.0k
Facility $8.0k
AZ AVG $31.7k
Rank #60 / 75
82
Facility 82
AZ AVG 82
Rank #8 / 53
10
Facility 10
AZ AVG 23.2
Rank #11 / 75
2.5
Facility 2.5
AZ AVG 3.8
Rank #17 / 75
135- 8 Tucson Mather Plaza, LLC
$30.6M
Facility $30.6M
AZ AVG $14.7M
Rank #9 / 79
$11.7M
Facility $11.7M
AZ AVG $6.4M
Rank #13 / 79
38.2%
Facility 38.2%
AZ AVG 48.1%
Rank #67 / 79
35273
Foothills Place
NH
AL
Tucson66
57.1%
Facility 57.1%
AZ AVG 72.7%
Rank #54 / 76
-22%
4.02
Facility 4.02
AZ AVG 4.06
Rank #30 / 71
-38%-1%
$0
Facility $0
AZ AVG $31.7k
Rank #1 / 75
-
11
Facility 11
AZ AVG 23.2
Rank #15 / 75
5.5
Facility 5.5
AZ AVG 3.8
Rank #66 / 75
164A+ 27 Chandler Monks
$9.5M
Facility $9.5M
AZ AVG $14.7M
Rank #44 / 79
$5.2M
Facility $5.2M
AZ AVG $6.4M
Rank #56 / 79
54.6%
Facility 54.6%
AZ AVG 48.1%
Rank #48 / 79
35251
Brookdale Santa Catalina
NH
AL
IL
MC
Tucson (Sin Vacas)155--
4.24
Facility 4.24
AZ AVG 4.06
Rank #21 / 71
-37%+4%
$0
Facility $0
AZ AVG $31.7k
Rank #1 / 75
71
Facility 71
AZ AVG 82
Rank #31 / 53
30
Facility 30
AZ AVG 23.2
Rank #53 / 75
5.0
Facility 5.0
AZ AVG 3.8
Rank #58 / 75
-30A+ 0 Anna Munoz
$16.5M
Facility $16.5M
AZ AVG $14.7M
Rank #71 / 79
$7.4M
Facility $7.4M
AZ AVG $6.4M
Rank #35 / 79
44.5%
Facility 44.5%
AZ AVG 48.1%
Rank #2 / 79
35253
Devon Gables
NH
AL
IL
MC
NC
Tucson (Rose Hill)312
72.8%
Facility 72.8%
AZ AVG 72.7%
Rank #37 / 76
0%
4.13
Facility 4.13
AZ AVG 4.06
Rank #25 / 71
+12%+2%
$0
Facility $0
AZ AVG $31.7k
Rank #1 / 75
67
Facility 67
AZ AVG 82
Rank #40 / 53
20
Facility 20
AZ AVG 23.2
Rank #35 / 75
3.3
Facility 3.3
AZ AVG 3.8
Rank #29 / 75
1227- 58 Heather Friebus
$21.5M
Facility $21.5M
AZ AVG $14.7M
Rank #18 / 79
$12.6M
Facility $12.6M
AZ AVG $6.4M
Rank #10 / 79
58.3%
Facility 58.3%
AZ AVG 48.1%
Rank #36 / 79
35145
Haven Health Tucson
NH
AL
MC
Tucson118
89.8%
Facility 89.8%
AZ AVG 72.7%
Rank #15 / 76
+23%
2.49
Facility 2.49
AZ AVG 4.06
Rank #71 / 71
+3%-39%
$0
Facility $0
AZ AVG $31.7k
Rank #1 / 75
60
Facility 60
AZ AVG 82
Rank #49 / 53
19
Facility 19
AZ AVG 23.2
Rank #31 / 75
3.8
Facility 3.8
AZ AVG 3.8
Rank #39 / 75
297- 27 Jason Seastrand
$18.3M
Facility $18.3M
AZ AVG $14.7M
Rank #12 / 79
$7.6M
Facility $7.6M
AZ AVG $6.4M
Rank #20 / 79
41.4%
Facility 41.4%
AZ AVG 48.1%
Rank #74 / 79
35165

Financial Assistance for
Nursing Home in Arizona

Foothills Place is located in Tucson, Arizona.
Here are the financial assistance programs available to residents in Arizona.

Get Financial aid guidance

Arizona Long Term Care System

ALTCS

Age 65+ or disabled
General Arizona resident, Medicaid-eligible, nursing home-level care need.
Income Limits (2025) ~$2,829/month 300% FBR, individual
Asset Limits $2,000 (individual), $3,000 (couple).
AZ

Covers tribal members; rural outreach.

Benefits
In-home care (6-8 hours/day) Assisted living Nursing home care Medical services Transportation (10 trips/month)

Non-Medical Home and Community Based Services

AZ DES Non-Medical HCBS

Age 60+
General Arizona resident, at risk of institutionalization.
Income Limits ~$2,000/month individual, varies
Asset Limits $10,000 individual
AZ

Limited funding; waitlists common.

Benefits
Homemaker services (3-5 hours/week) Respite care (up to 10 days/year) Adult day care (~$60/day)

Weatherization Assistance Program (WAP)

AZ WAP

Age 60+ priority
General Arizona resident, own/rent home, low-income.
Income Limits (2025) ~$2,510/month 200% of poverty level, individual
Asset Limits Not applicable; income-focused.
AZ

High demand in rural desert areas; limited annual funds.

Benefits
Insulation Weather stripping HVAC repairs (avg. $500-$1,000/year savings)

Section 202 Supportive Housing for the Elderly

AZ Section 202

Age 62+
General Arizona resident, very low income, able to live independently with support.
Income Limits (2025) ~$1,645/month 50% of area median income, individual, varies by county
Asset Limits $10,000 individual, excludes home if owned
AZ

Limited units; high demand in metro areas like Phoenix.

Benefits
Subsidized rent (30% of income, e.g., $300-$500/month) On-site services (housekeeping, transportation, ~$200/month value)

Arizona CARES Program

AZ CARES

Age
General Caregivers of Arizona residents 60+ needing help with 3+ daily activities; no caregiver age limit.
Income Limits No strict limit; cost-sharing above ~$2,500/month threshold.
Asset Limits Not applicable; need-based.
AZ

Focus on rural access; complements ALTCS respite.

Benefits
Respite care (up to 10 days/year) Counseling (4-6 sessions/year) Training (2-3 workshops/year) Supplies (~$200/year)

AZ DES Non-Medical Home and Community Based Services (HCBS)

AZ DES Non-Medical HCBS

Age 60+ or disabled
General Arizona resident, need assistance with daily activities, not eligible for Medicaid/ALTCS.
Income Limits Above Medicaid threshold but low-income ~$1,500-$2,500/month, varies by region
Asset Limits Not specified; income-driven eligibility.
AZ

Targets those ineligible for ALTCS; prioritizes rural and tribal areas.

Benefits
Homemaker services (3-5 hours/week) Personal care (limited hours) Respite care (up to 10 days/year) Transportation (~5 trips/month)

Frequently Asked Questions about Foothills Place

Is Foothills Place in a walkable area?

Foothills Place has a walk score of 27. Somewhat walkable. A few nearby services may be reachable on foot, but most trips require transportation.

What is the occupancy rate at Foothills Place?

Foothills Place's occupancy is 57.1%.

Are there photos of Foothills Place?

Yes — there are 4 photos of Foothills Place in the photo gallery on this page.

What is the phone number of Foothills Place?

(520) 200-3539 will put you in contact with the team at Foothills Place.

Is Foothills Place Medicare or Medicaid certified?

Yes — Foothills Place is a CMS-certified provider of Medicare and Medicaid.

Guides for Better Senior Living

Care Cost Calculator: See Prices in Your Area

Nursing Home Data Explorer

Don’t Wait Too Long: 7 Red Flag Signs Your Parent Needs Assisted Living Now

The True Cost of Assisted Living in 2025 – And How Families Are Paying For It

Understanding Senior Living Costs: Pricing Models, Discounts & Financial Assistance