

Total health inspections
3
Florida average 4.3
Last Health inspection on Apr 2024

We arrange tours, appointments, and even moving support so you don’t have to

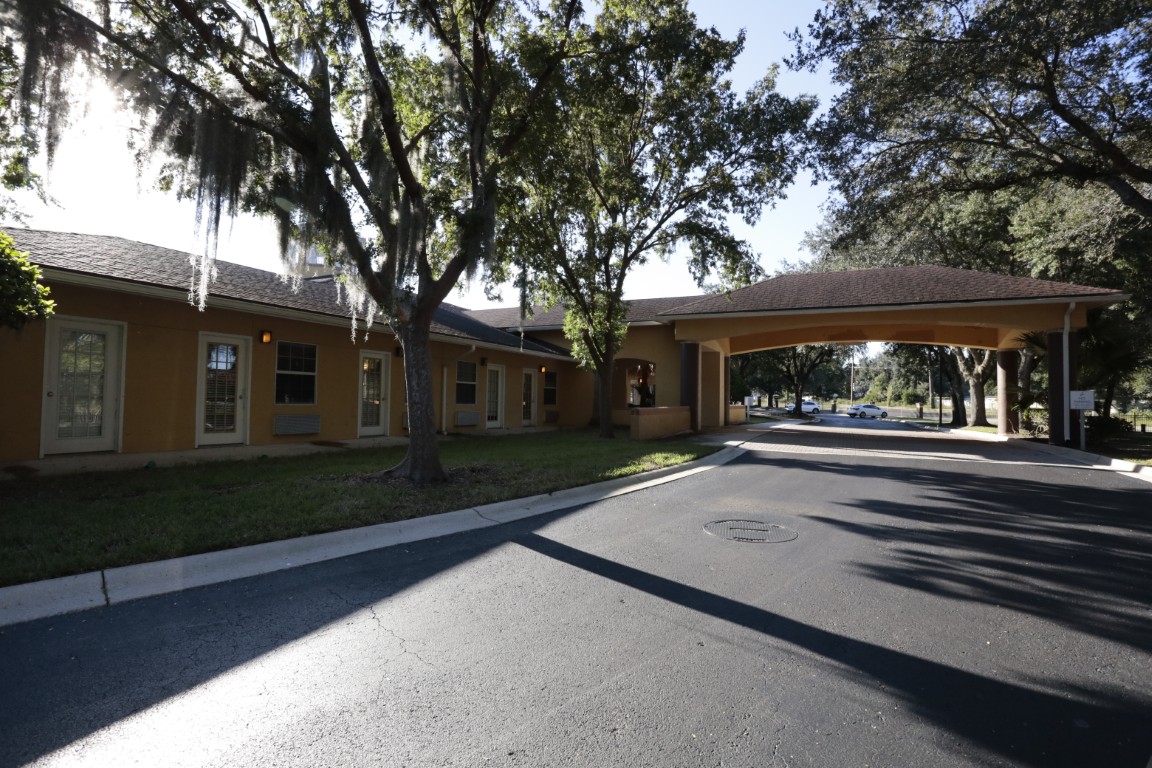
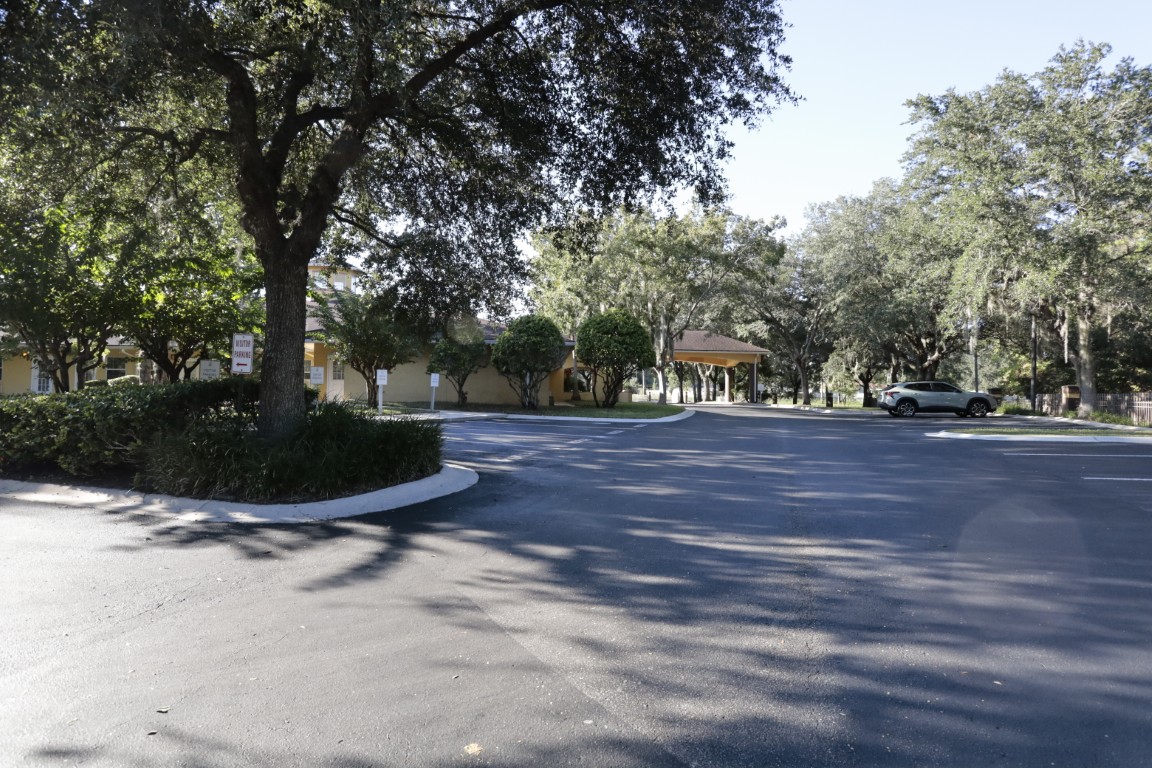
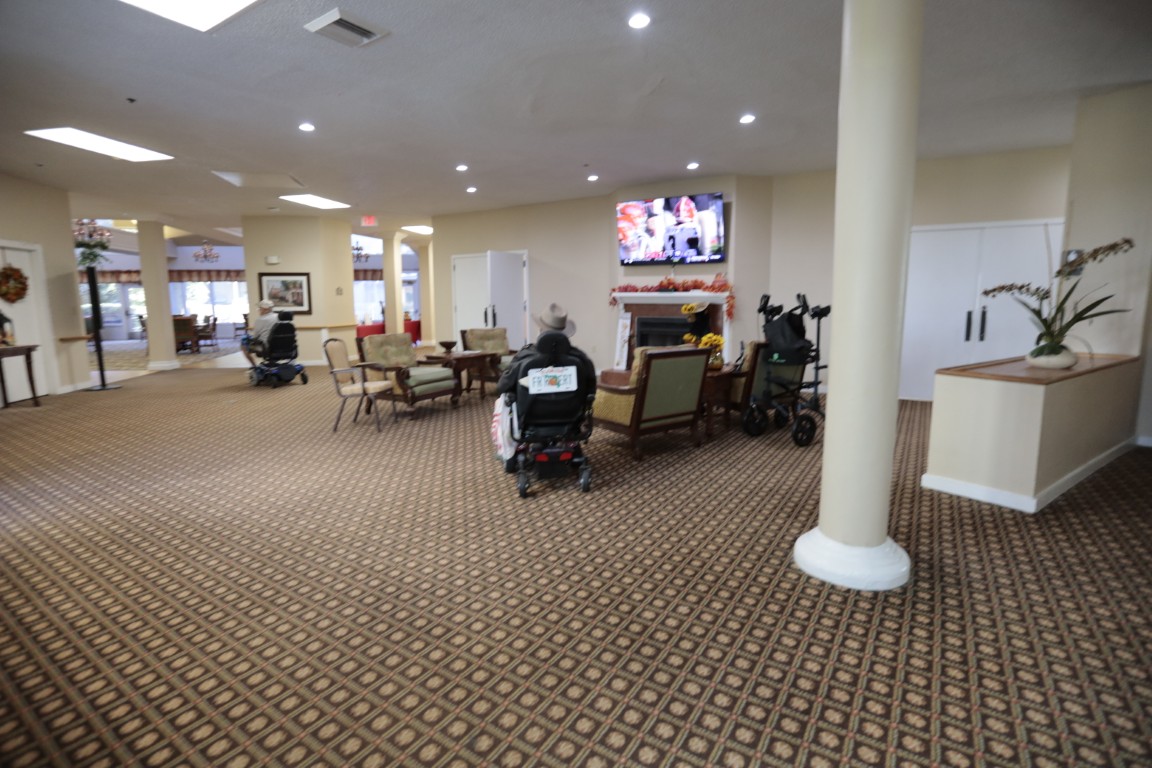
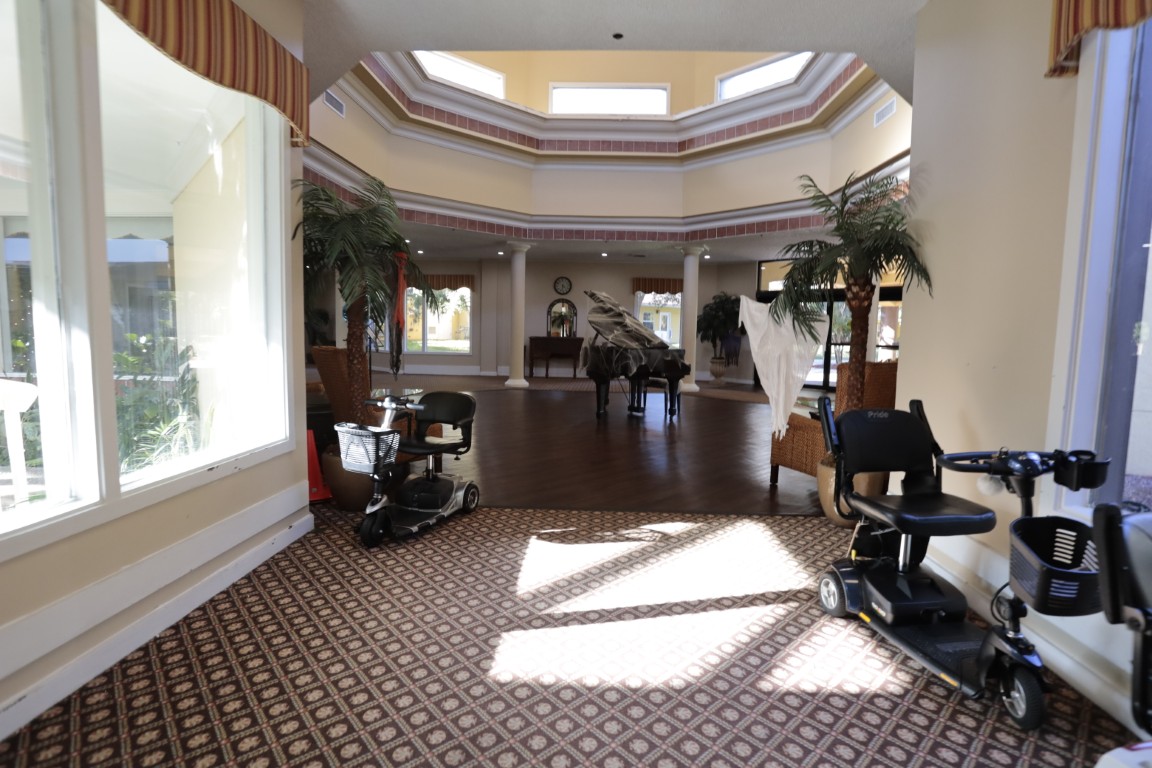
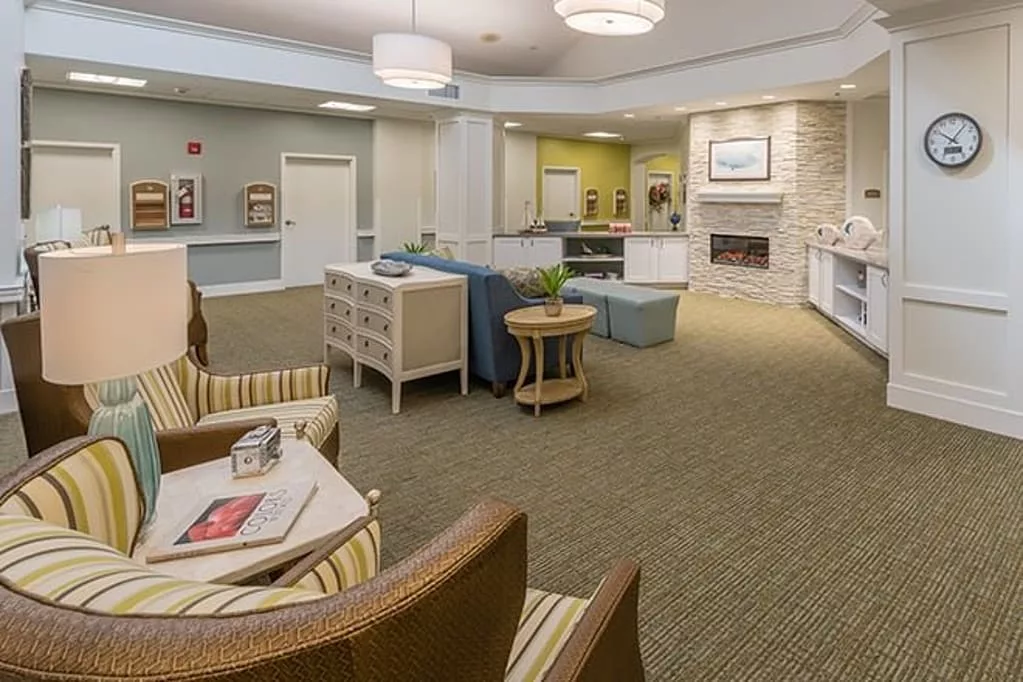
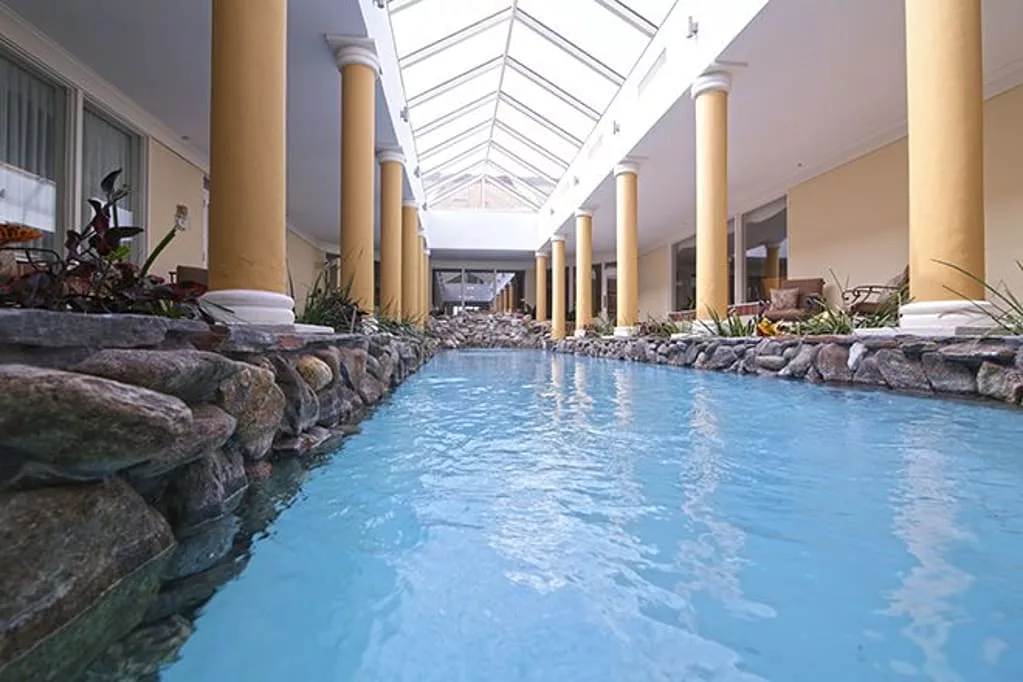

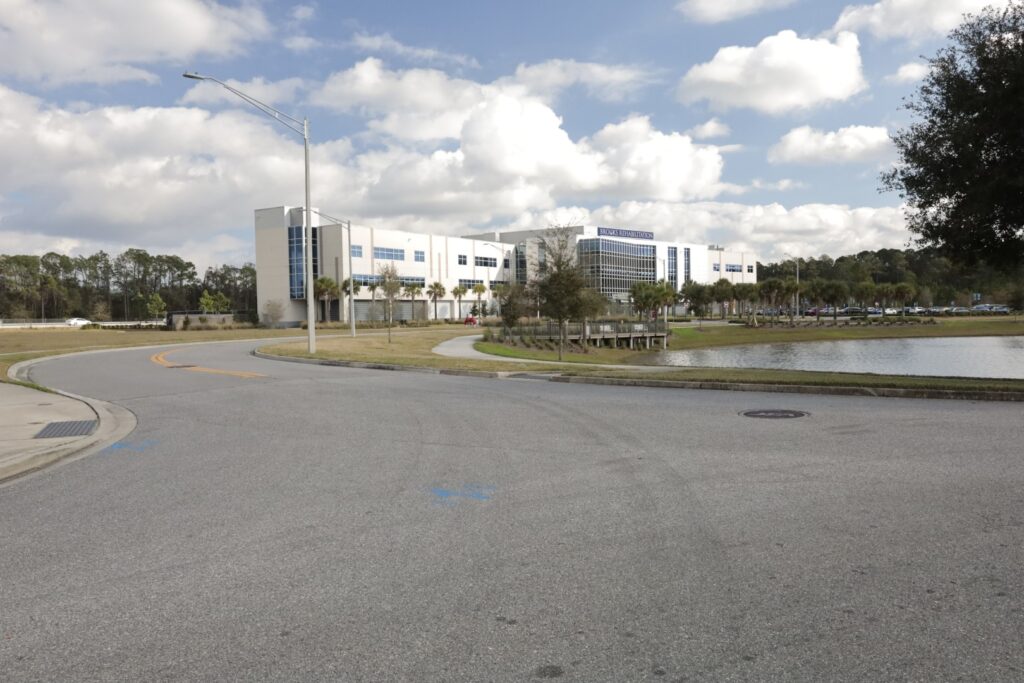
Fountains at Mill Cove, situated in Jacksonville, Florida, excels as an exceptional senior living community offering independent living, assisted living, memory care, and skilled nursing services – a complete package for residents seeking peace of mind. Its strategic location ensures a tranquil environment, complemented by secure entrances and exits, along with round-the-clock emergency response services.
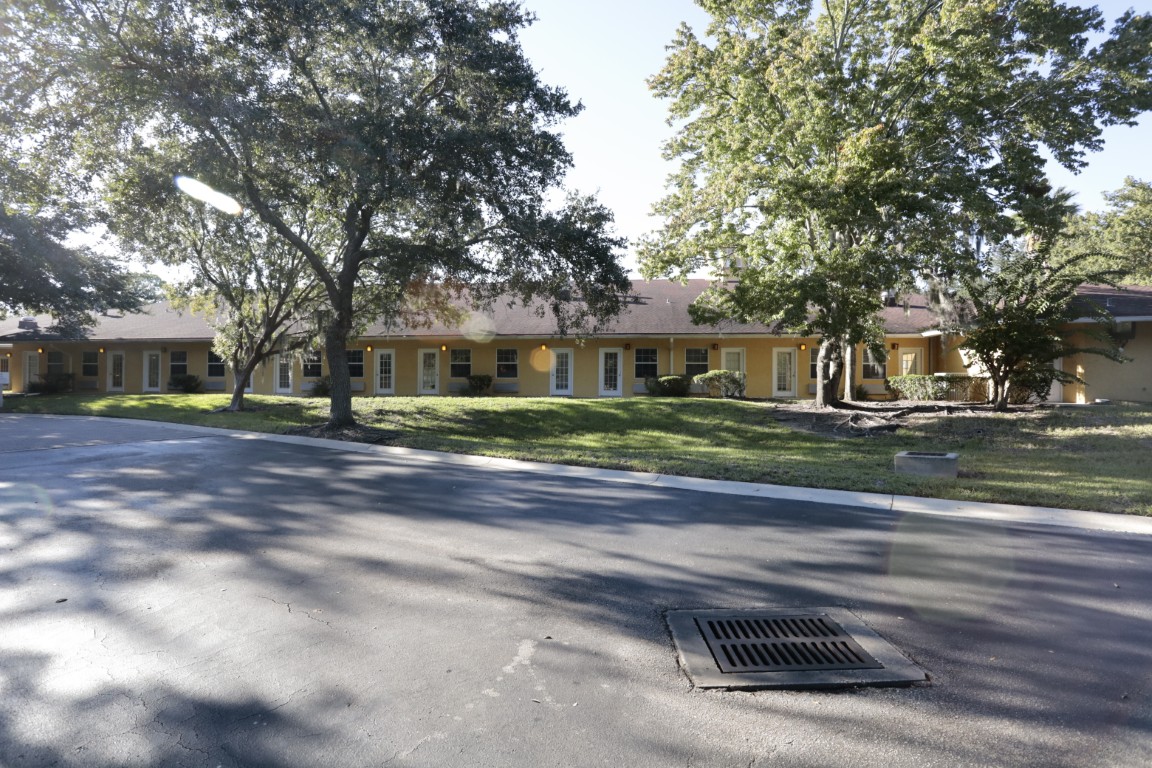
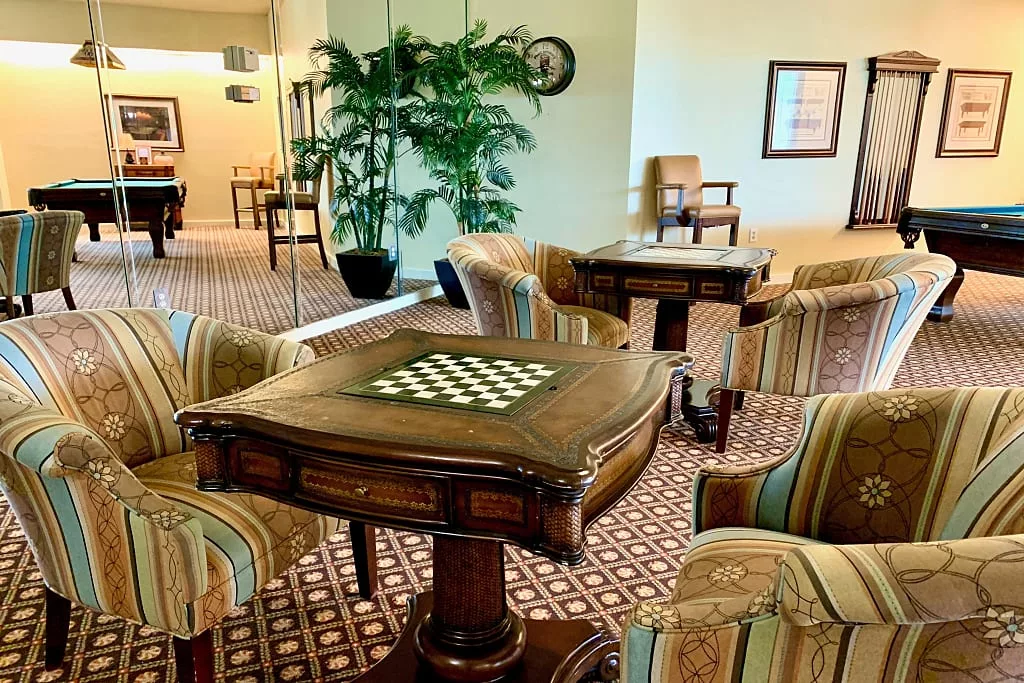
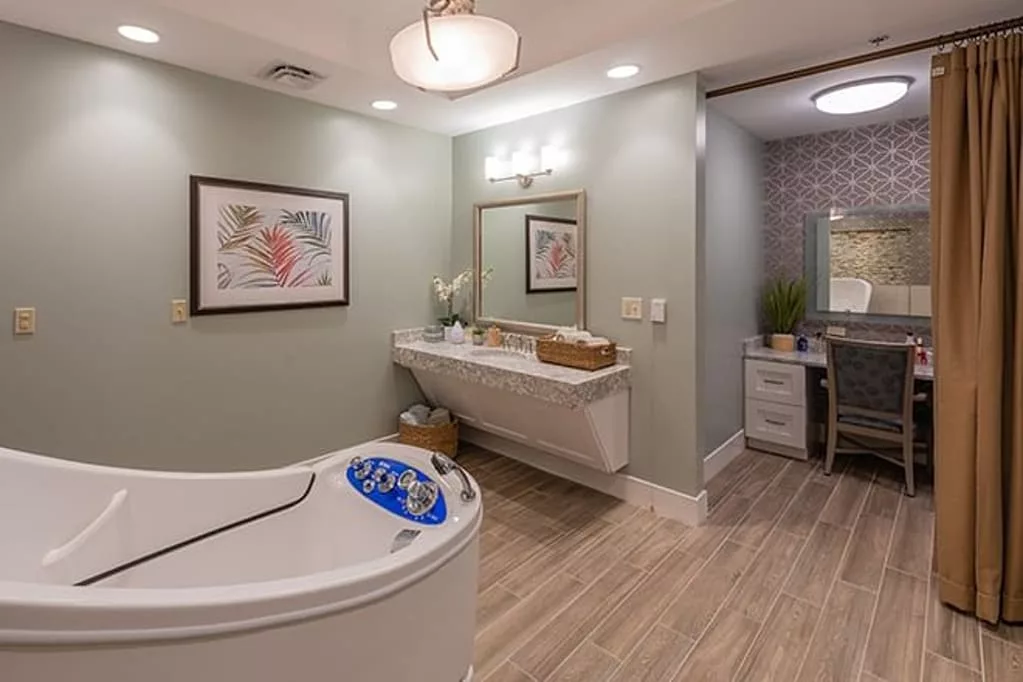
The interiors boast light palettes, exuding style and relaxation, creating an inviting atmosphere for residents. Seniors can also engage in a variety of activities, including offsite trips for dining, entertainment, and shopping. This community definitely crafts a lifestyle where residents’ golden years are filled with enriching experiences and a sense of belonging.
 Official CMS rating based on health inspections, staffing and quality measures.
Official CMS rating based on deficiencies found during state health inspections.
Official CMS rating based on nurse staffing hours per resident per day.
Official CMS rating based on clinical outcomes for residents.
Average daily nursing hours per resident (adjusted for acuity). Higher values indicate more nursing time per resident.
Hours of care per resident per day, broken down by staff type. Data from CMS Medicare.
Registered nurse hours per resident per day.
Licensed Practical Nurse / Licensed Vocational Nurse hours per resident per day.
Nurse aide hours per resident per day.
Total number of nurse staff hours per resident per day on weekends.
Physical therapist staff hours per resident per day.
Registered nurse hours per resident per day on weekends.
Official CMS rating based on health inspections, staffing and quality measures.
Official CMS rating based on deficiencies found during state health inspections.
Official CMS rating based on nurse staffing hours per resident per day.
Official CMS rating based on clinical outcomes for residents.
Average daily nursing hours per resident (adjusted for acuity). Higher values indicate more nursing time per resident.
Hours of care per resident per day, broken down by staff type. Data from CMS Medicare.
Registered nurse hours per resident per day.
Licensed Practical Nurse / Licensed Vocational Nurse hours per resident per day.
Nurse aide hours per resident per day.
Total number of nurse staff hours per resident per day on weekends.
Physical therapist staff hours per resident per day.
Registered nurse hours per resident per day on weekends.
May provide extensive amenities, services and programs.
That suggests steady demand, but availability may be limited.
This home supports both short-term rehab and long-term care, with residents staying for a wide range of durations.
49% of new residents, usually for short-term rehab.
50% of new residents, often for short stays.
1% of new residents, often for long-term daily care.
The portion of the home's budget spent on staff, including nurses, caregivers, and other employees who support care and operations.
All remaining costs needed to run the home, such as food, utilities, building maintenance, supplies and administrative expenses.
Fountains Rehabilitation at Mill Cove is legally operated by ATRIUM ALF OPERATING LLC, and administrated by RUSSELL THEODORE WARD.
Key information about the people who lead and staff this community.
Minimum Age: 62
Pets Allowed: Yes, Pets Allowed
In Florida, the Agency for Health Care Administration (AHCA) is the primary authority that conducts unannounced inspections and completes official health quality reports for all healthcare facilities.
Citations indicate regulatory violations. A higher number implies the facility had several areas requiring improvement.
Deficiencies indicate regulatory issues. A higher number implies the facility had several areas requiring improvement.
May 15, 2023: Fine resulted from BGS Rapback.
A fine of $500.00 was formally imposed on August 8, 2023.
June 8, 2017: Fine resulted from Survey.
A fine of $1,000.00 was formally imposed on November 27, 2018.
Nursing Home 24/7 care needed
Assisted Living For seniors needing help with daily tasks but not full-time nursing.
Nursing Home 24/7 care needed
Assisted Living For seniors needing help with daily tasks but not full-time nursing.
Independent Living For self-sufficient seniors seeking community and minimal assistance.
Memory Care Specialized care for those with Memory Loss, Alzheimer's, or dementia, ensuring safety and support.
Nursing Home 24/7 care needed
Assisted Living For seniors needing help with daily tasks but not full-time nursing.
Nursing Home 24/7 care needed
Assisted Living For seniors needing help with daily tasks but not full-time nursing.
Nursing Home 24/7 care needed
Assisted Living For seniors needing help with daily tasks but not full-time nursing.
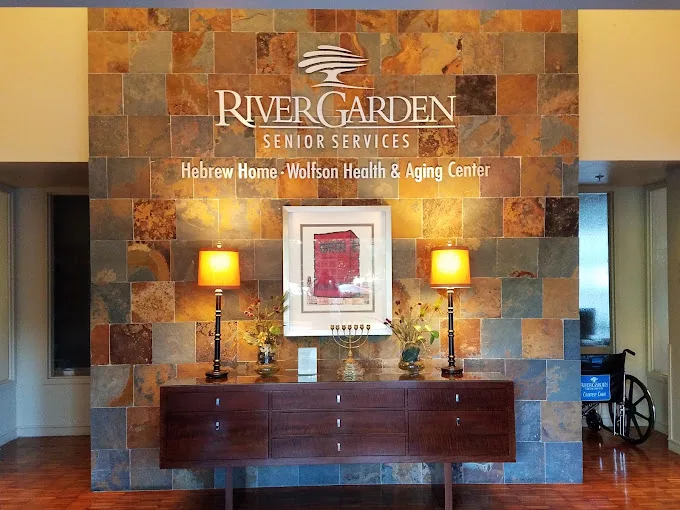 River Garden Senior Services
 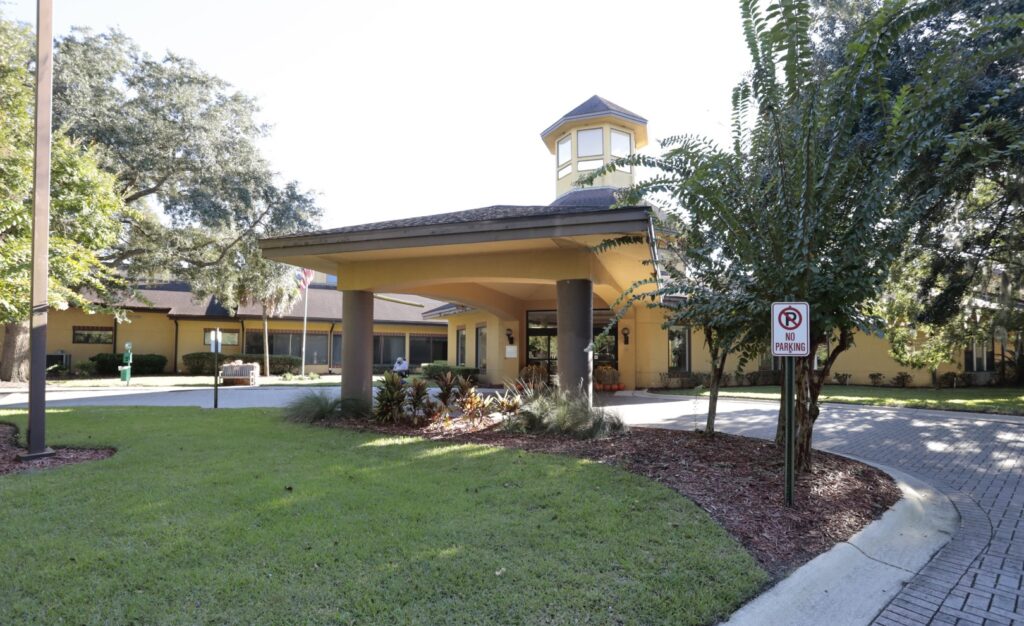 Fountains Rehabilitation at Mill Cove
  Cathedral Care
  Signature HealthCARE of Jacksonville
![]() 7.0 miles from city center — 4.46 miles to nearest hospital (Publix Pharmacy at Deerwood Lake Commons)
7.0 miles from city center — 4.46 miles to nearest hospital (Publix Pharmacy at Deerwood Lake Commons)
![]() 9960 Atrium Way, Jacksonville, FL 32225
9960 Atrium Way, Jacksonville, FL 32225
Add your location
Source: CMS Payroll-Based Journal (Q2 2025)
| Role ⓘ | Count ⓘ | Avg Shift (hrs) ⓘ | Uses Contractors? ⓘ |
|---|---|---|---|
| Registered Nurse | 10 | 9.1 | Yes |
| Licensed Practical Nurse | 18 | 8.5 | No |
| Certified Nursing Assistant | 64 | 8 | Yes |
| Role ⓘ | Employees ⓘ | Contractors ⓘ | Total Staff ⓘ | Total Hours ⓘ | Days Worked ⓘ | % of Days ⓘ | Avg Shift (hrs) ⓘ |
|---|---|---|---|---|---|---|---|
| Certified Nursing Assistant | 63 | 1 | 64 | 16,081 | 91 | 100% | 8 |
| Licensed Practical Nurse | 18 | 0 | 18 | 6,012 | 91 | 100% | 8.5 |
| Registered Nurse | 8 | 2 | 10 | 3,741 | 91 | 100% | 9.1 |
| Speech Language Pathologist | 5 | 0 | 5 | 1,284 | 77 | 85% | 7.1 |
| Dietitian | 3 | 0 | 3 | 1,138 | 86 | 95% | 6.6 |
| Clinical Nurse Specialist | 2 | 0 | 2 | 993 | 64 | 70% | 8 |
| Dental Services Staff | 2 | 0 | 2 | 941 | 66 | 73% | 7.7 |
| RN Director of Nursing | 2 | 0 | 2 | 904 | 64 | 70% | 8 |
| Respiratory Therapist | 3 | 0 | 3 | 882 | 73 | 80% | 6.6 |
| Physical Therapy Assistant | 2 | 0 | 2 | 657 | 77 | 85% | 6 |
| Respiratory Therapy Technician | 3 | 0 | 3 | 480 | 69 | 76% | 7 |
| Administrator | 1 | 0 | 1 | 472 | 59 | 65% | 8 |
| Nurse Practitioner | 1 | 0 | 1 | 410 | 55 | 60% | 7.5 |
| Occupational Therapy Aide | 1 | 0 | 1 | 262 | 74 | 81% | 3.5 |
| Qualified Social Worker | 3 | 0 | 3 | 224 | 52 | 57% | 3.9 |
Florida average 4.3
Last Health inspection on Apr 2024
Health citations are formal notices following inspections when they fail to comply with safety and care standards.
All 8 citations resulted from standard inspections.
Florida average: 0.8
Florida average: 0.4
Data sourced from CMS Health Deficiencies reports. Citation severity codes range from A (least serious) to L (most serious). Immediate Jeopardy (J-L) citations indicate situations where the facility's noncompliance has placed residents at risk of death or serious harm.
Source: CMS Long-Term Care Facility Characteristics (Data as of Jan 2026)
Active councils help families stay involved in care decisions and facility operations.
These measures show how residents usually do over time at this home, based on health outcomes and preventive care.
Florida average: 7.4
Florida average: 12.4
Florida average: 10.5%
Florida average: 12.9%
Florida average: 13.5%
Florida average: 2.6%
Florida average: 5.4%
Florida average: 0.9%
Florida average: 6.0%
Florida average: 3.3%
Florida average: 8.0%
Florida average: 97.7%
Florida average: 99.2%
Florida average: 2.10
Florida average: 1.18
Florida average: 94.0%
Florida average: 1.5%
Florida average: 94.7%
Florida average: 26.2%
Florida average: 9.3%
Florida average: 0.8%
Florida average: 53.7%
Florida average: 50.6%
Quality measures are calculated from Minimum Data Set (MDS) assessments. For most measures, lower percentages indicate better care quality.
Historical financial and operational data for Fountains Rehabilitation at Mill Cove based on CMS SNF Cost Reports.
Loading trend charts...
Care Cost Calculator: See Prices in Your Area
Nursing Home Data Explorer
Don’t Wait Too Long: 7 Red Flag Signs Your Parent Needs Assisted Living Now
The True Cost of Assisted Living in 2025 – And How Families Are Paying For It
Understanding Senior Living Costs: Pricing Models, Discounts & Financial Assistance

We help families find affordable senior communities and unlock same day discounts, Medicaid, and Medicare options tailored to your needs.
Contact us Today
Touring a community? Use this expert-backed checklist to stay organized, ask the right questions, and find the perfect fit.
We'll send you a PDF version of the touring checklist.


