Frasier Retirement Community

Senior Living Home
Overview of Frasier Retirement Community

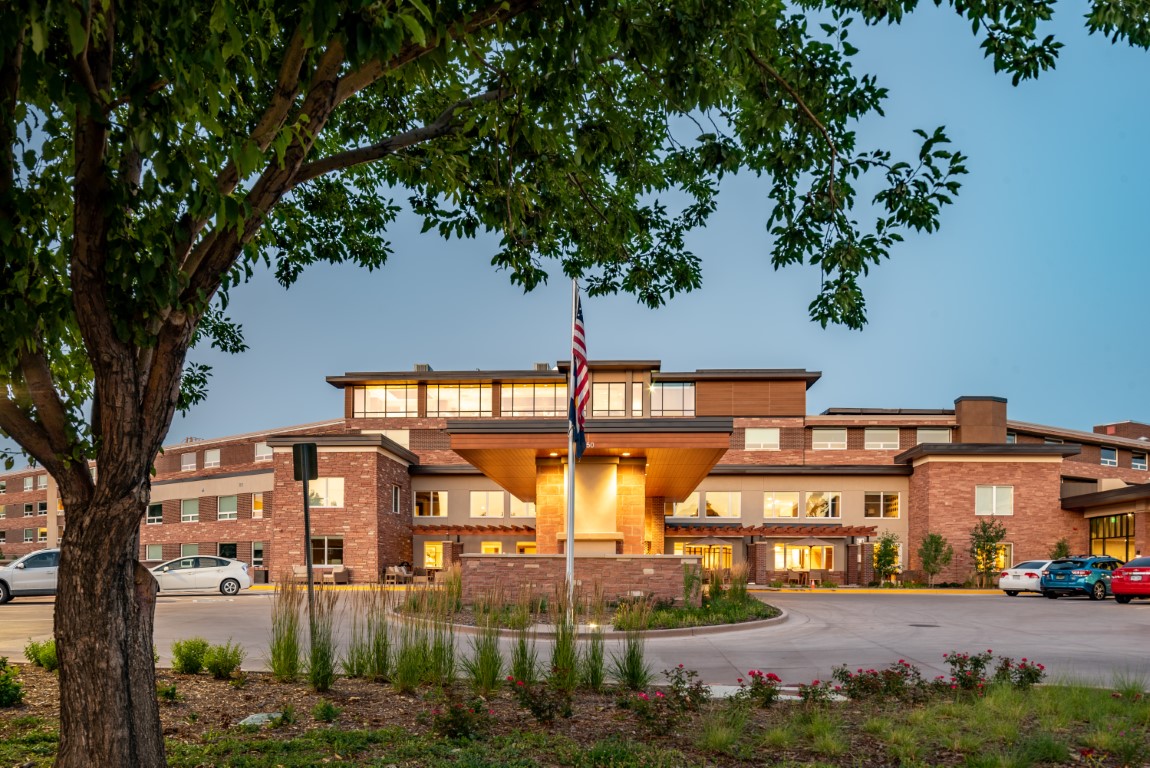
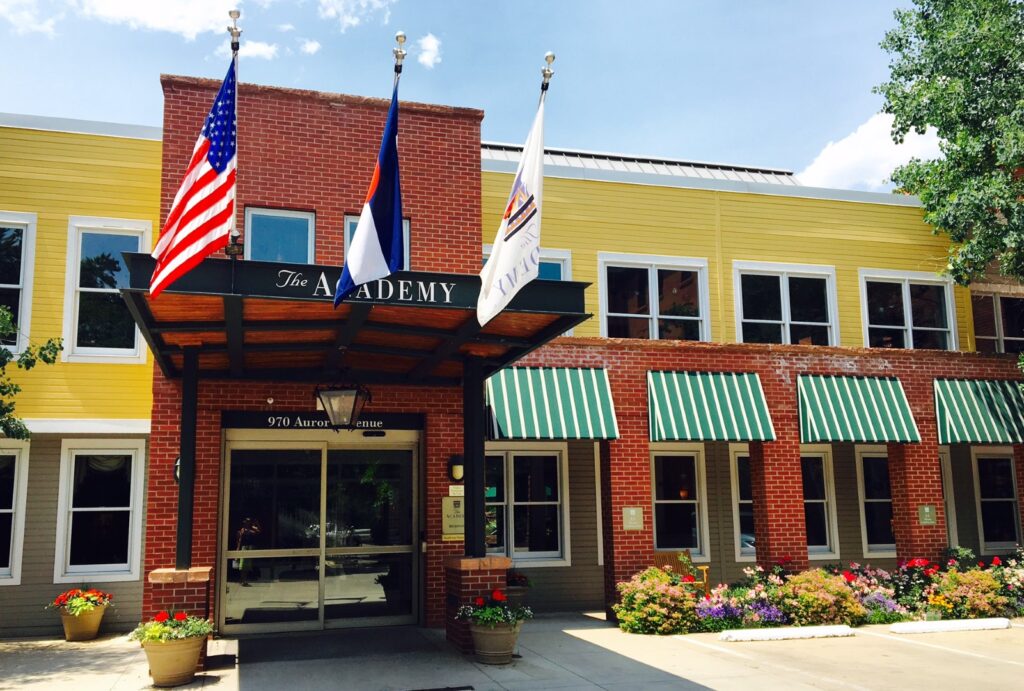
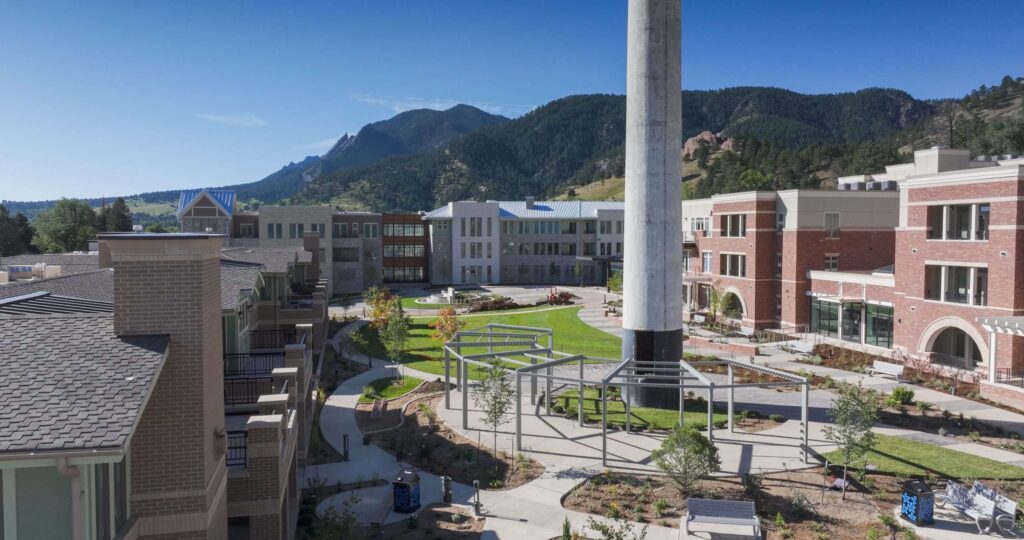
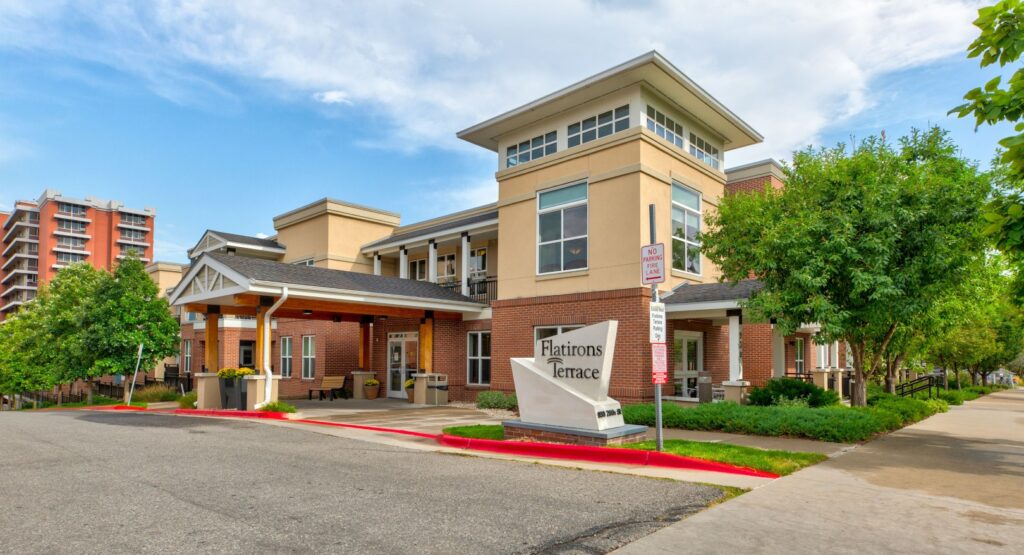
Experience the best of your golden years at Frasier Retirement Community, an idyllic retreat in Boulder, CO, offering independent living, assisted living, memory care, and skilled nursing. Alongside beautifully furnished and spacious floor plans, exceptional care tailored to residents’ needs is provided to ensure comfort and safety. Residents enjoy a worry-free lifestyle with the community handling the housekeeping and other chores.

With a well-thought-out calendar of fun recreational activities and enriching programs, residents are encouraged to live actively and make new friends. Delightful and well-balanced meals are also served to satisfy residents’ dietary needs and preferences. The community’s continuum of care and state-of-the-art amenities create the ideal setting for residents to live a blissful retirement.

Quality ratings

Measured by Centers for Medicare & Medicaid Services (CMS)

Overall rating Info Official CMS rating based on health inspections, staffing and quality measures.
5/5
Colorado average: 3.1/5
Health Inspection Info Official CMS rating based on deficiencies found during state health inspections.
4/5
Colorado average: 2.8/5
Staffing Info Official CMS rating based on nurse staffing hours per resident per day.
5/5
Colorado average: 3.0/5
Quality Measures Info Official CMS rating based on clinical outcomes for residents.
5/5
Colorado average: 4.1/5

Nursing care per resident

Info Average daily nursing hours per resident (adjusted for acuity). Higher values indicate more nursing time per resident.
5h 2m per day

This home provides 30% more nursing time per resident than the state average.

Colorado average: 3h 52m per day

Capacity and availability

Smaller home

May offer a more intimate, personalized care environment.

Total beds 54

This home usually has limited availability

Occupancy is moderate, suggesting balanced demand.

Similar demand to the Colorado average
Occupancy rate 92.5%
Residents per day (avg) 53
Occupancy rate
92.5%
Residents per day (avg)
53

Who this home usually serves

TYPE OF STAY

Mix of rehab and long-term care

This home supports both short-term rehab and long-term care, with residents staying for a wide range of durations.

Breakdown by payment type

Medicare

45% of new residents, usually for short-term rehab.

Typical stay 27 days

Private pay

49% of new residents, often for short stays.

Typical stay 6 months

Medicaid

5% of new residents, often for long-term daily care.

Typical stay 11 - 12 months

Finances and operations

Proprietary home
Corporation
Home revenue
$59.9M
Profit
$12.4M
Proprietary home Corporation
Home revenue
$59,921,359.00
Profit
$12,379,923.00
Payroll costs Info The portion of the home's budget spent on staff, including nurses, caregivers, and other employees who support care and operations.
$13.6M
22.7% of revenue
Other operating costs Info All remaining costs needed to run the home, such as food, utilities, building maintenance, supplies and administrative expenses.
$34.0M
Total costs $47.5M
Walk Score
Walk Score: 65 / 100
Moderately walkable. Some errands can be accomplished on foot, with a mix of nearby amenities.
BBB Rating
BBB Rating: A+ (Not Accredited)
An independent rating from the Better Business Bureau based on factors such as complaint history, transparency, and business practices.
How BBB ratings work

About this community

Care Services

Accepts Medicaid
Nursing Services
Rehabilitation Services
Respite Care
Memory Care
Independent Living
Skilled Nursing
24-Hour Staffing

Amenities & Lifestyle

Dining
Wellness Center
Activities
Outdoor Spaces
Library
Salon/Spa Services

Programs & Activities

Specific Programs
Independent Living, Assisted Living, Memory Support, Skilled Nursing, Day Program, Activities, Dining, Wellness Center

Pricing & Financial Information

Dining & Nutrition

Food Description
Nutrition is a key factor in senior health and wellness, with a community-specific menu around resident preferences and local seasonal ingredients.
Meals Included
Yes
Meals Per Day
3

What does this home offer?

Housing options icon

Housing Options: 1 Bed / 2 Bed

Building type icon
Building type icon

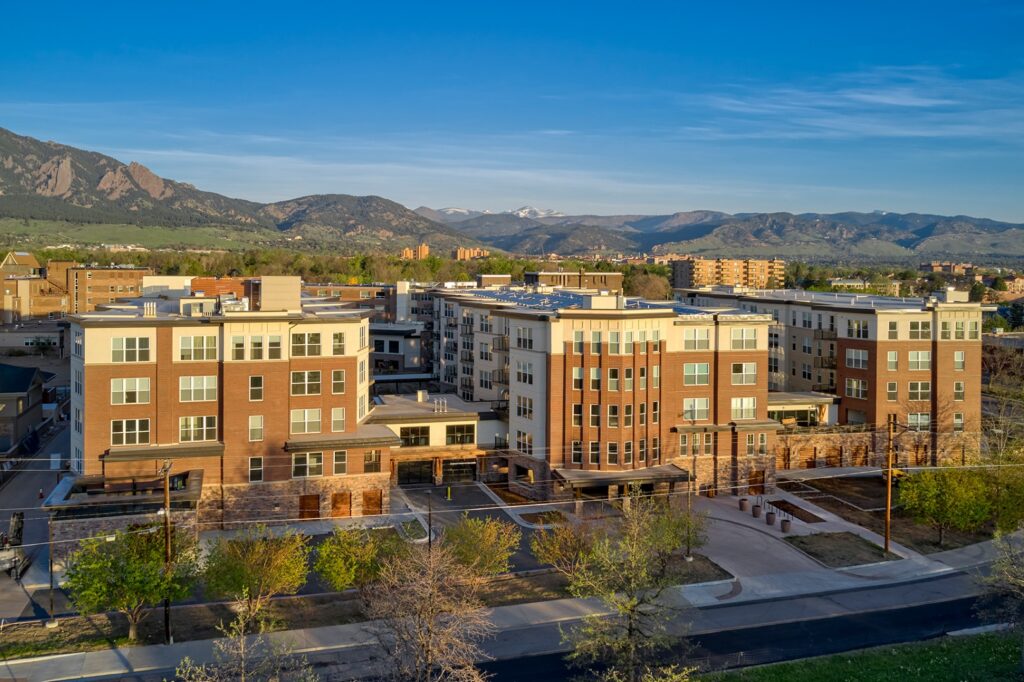
Building Type: Mid-rise
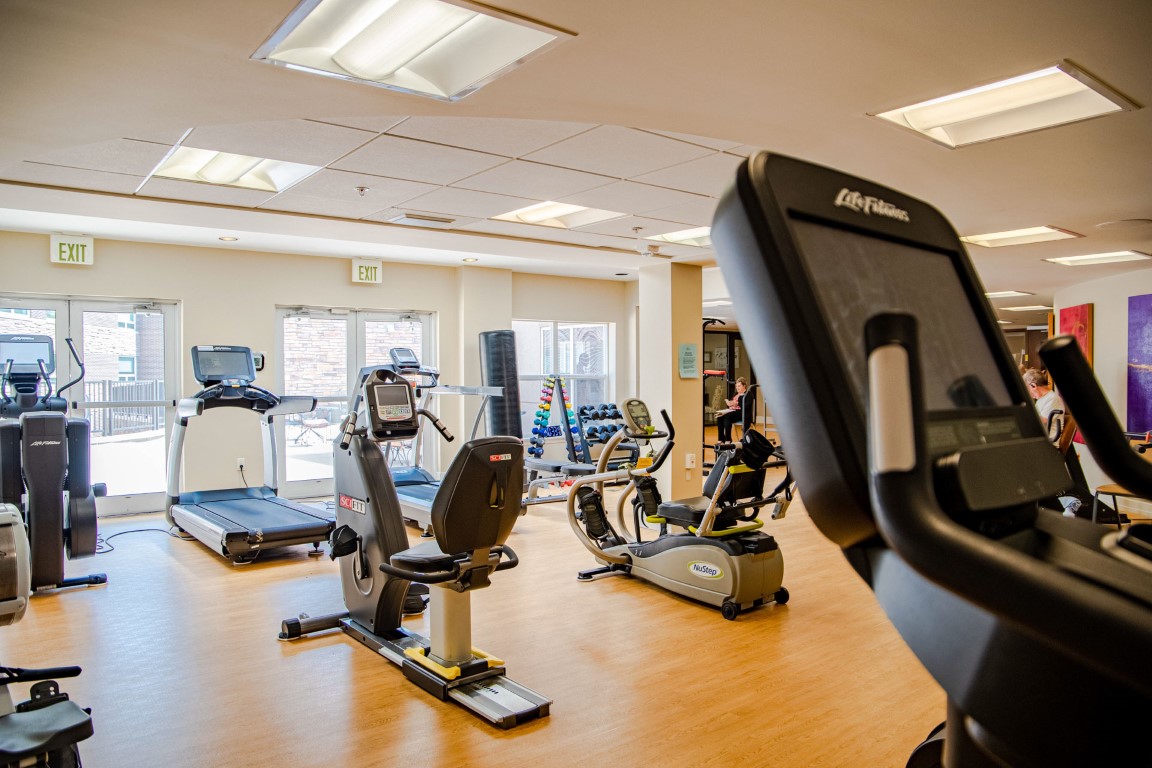
Dining services icon

Dining Services

Beauty services icon

Beauty Services

Transportation services icon

Transportation Services

Housekeeping icon
Housekeeping icon

Housekeeping Services

Social and recreational activities icon

Social and Recreational Activities

Types of Care at Frasier Retirement Community

Independent Living
Contact Frasier Retirement Community

Compare Independent Living around Weld County

The information below is reported by the Colorado Department of Public Health and Environment, Health Facilities Division.
Frasier Retirement Community
SNF

Nursing Home 24/7 care needed

IL

Independent Living For self-sufficient seniors seeking community and minimal assistance.

Boulder (Frasier Meadows)
54
No
A+
65
LEWIS, NIKKI
92.5%
$10,870,542.00
$13,572,618.00
124.9%
53.00
5/5
5.0281
4/5
5/5
5/5
10
7
2
+35%
+30%
+21%
1 Bed / 2 Bed
Academy Boulder Communities
IL

Independent Living For self-sufficient seniors seeking community and minimal assistance.

Boulder (Lower Chautauqua)
-
No
A+
73
-
-
-
-
-
-
-
-
-
-
-
-
-
-
-
-
-
2 Bed / 3 Bed
Academy Mapleton Hill
IL

Independent Living For self-sufficient seniors seeking community and minimal assistance.

Boulder
-
No
-
43
-
-
-
-
-
-
-
-
-
-
-
-
-
-
-
-
-
2 Bed / 3 Bed
Bella Vita Senior Living
IL

Independent Living For self-sufficient seniors seeking community and minimal assistance.

Aurora (Village East)
-
Yes
A+
83
-
-
-
-
-
-
-
-
-
-
-
-
-
-
-
-
-
1 Bed / 2 Bed
Flatirons Terrace Senior Living
IL

Independent Living For self-sufficient seniors seeking community and minimal assistance.

Boulder (Baseline Sub)
-
No
-
68
-
-
-
-
-
-
-
-
-
-
-
-
-
-
-
-
-
1 Bed

Living Spaces & Floor Plans

The Peaks Floor Plans
Download PDF
The Prairies Floor Plans
Download PDF
Assisted Living Floor Plans
Download PDF

Places of interest near Frasier Retirement Community

Address 3.8 miles from city center

Address 350 Ponca Pl, Boulder, CO 80303

Calculate Travel Distance to Frasier Retirement Community

Add your location

Address

Staffing Data

Source: CMS Payroll-Based Journal (Q2 2025)

110
Total Staff
74
Employees
36
Contractors
27,657
Total Hours (Quarter)
38
Avg Staff/Day
8
Avg Shift (hrs)
Nursing Staff Breakdown
Role Count Avg Shift (hrs) Uses Contractors?
Registered Nurse208 Yes
Licensed Practical Nurse128 Yes
Certified Nursing Assistant578.6 Yes
Staff by Category
Administration
1 staff
8hs shift avg
Nursing Staff
89 staff
8.4hs shift avg
Physicians & Practitioners
2 staff
8hs shift avg
Therapy Services
7 staff
4.1hs shift avg
Activities & Recreation
0 staff
0hs shift avg
Social Services
1 staff
1.9hs shift avg
Dietary Services
7 staff
7.5hs shift avg
Other Services
3 staff
7.7hs shift avg
Contractor Analysis
5.2%
of total hours from contractors
1,450 contractor hours this quarter
Registered Nurse: 6 Certified Nursing Assistant: 17 Licensed Practical Nurse: 5 Speech Language Pathologist: 4 Physical Therapy Assistant: 1 Qualified Social Worker: 1 Respiratory Therapy Technician: 2
Role Employees Contractors Total Staff Total Hours Days Worked % of Days Avg Shift (hrs)
Certified Nursing Assistant40175715,35191100%8.6
Registered Nurse146204,35491100%8
Licensed Practical Nurse75122,18291100%8
Other Dietary Services Staff7072,1778998%7.5
Dental Services Staff3031,3886571%7.7
Administrator1014966268%8
Clinical Nurse Specialist1014966268%8
Nurse Practitioner1013604549%8
Speech Language Pathologist0443476470%4.1
Physical Therapy Assistant0113106571%4.8
Respiratory Therapy Technician0221584651%3.2
Qualified Social Worker011392022%1.9

Health Inspection History

Inspections
Total health inspections 3

Colorado average 4.8


Last Health inspection on Apr 2024

Total health citations 7
Citations per inspection
2.33

Health citations are formal notices following inspections when they fail to comply with safety and care standards.

All 7 citations resulted from standard inspections.

Breakdown of citation severity (last 3 years)
Critical Health citations More info 0
100% better than Colorado average

Colorado average: 0.4


Serious Health citations More info 2
5% better than Colorado average

Colorado average: 2.1

0 critical citations More info Colorado average: 0.4

2 serious citations More info Colorado average: 2.1

5 moderate citations More info Colorado average: 22.2

0 minor citations More info Colorado average: 0.2
Citations history (last 3 years)
Quality of Care serious citation Apr 16, 2024
Corrected

Quality of Care serious citation Jan 10, 2023
Corrected

Resident Rights moderate citation Jan 10, 2023
Corrected

Abuse/Neglect moderate citation Sep 16, 2021
Corrected

Facility Characteristics

Source: CMS Long-Term Care Facility Characteristics (Data as of Jan 2026)

Ownership: Non-Profit (Church)
Resident Census by Payment Source
48 Total Residents
Medicare 6 (12.5%)
Medicaid 7 (14.6%)
Private Pay/Other 35 (72.9%)
Programs & Services
Residents' Group
CCRC
Family Engagement

Active councils help families stay involved in care decisions and facility operations.

Quality of care over time

These measures show how residents usually do over time at this home, based on health outcomes and preventive care.

High-risk clinical events score Info A composite score based on pressure ulcers, falls with injury, weight loss, walking ability decline, and activities of daily living decline. 2.9
67% better than Colorado average

Colorado average: 9.0

Functional decline score Info A composite score based on activities of daily living decline, walking ability decline, and incontinence. 12.9
31% better than Colorado average

Colorado average: 18.8

Long-stay resident measures
Need for Help with Daily Activities Increased Info Percent of long-stay residents whose need for help with daily activities has increased 2.9%
82% better than Colorado average

Colorado average: 16.0%

Walking Ability Worsened Info Percent of long-stay residents whose ability to move independently worsened 8.2%
52% better than Colorado average

Colorado average: 17.0%

Low Risk Residents with Bowel/Bladder Incontinence Info Percent of low risk long-stay residents who lose control of their bowels or bladder 27.6%
19% worse than Colorado average

Colorado average: 23.2%

Falls with Major Injury Info Percent of long-stay residents experiencing one or more falls with major injury 1.7%
50% better than Colorado average

Colorado average: 3.3%

High Risk Residents with Pressure Ulcers Info Percent of long-stay high risk residents with pressure ulcers 0.0%
100% better than Colorado average

Colorado average: 3.9%

Urinary Tract Infection Info Percent of long-stay residents with a urinary tract infection 0.0%
100% better than Colorado average

Colorado average: 1.4%

Lost Too Much Weight Info Percent of long-stay residents who lose too much weight 1.9%
64% better than Colorado average

Colorado average: 5.2%

Depressive Symptoms Info Percent of long-stay residents who have depressive symptoms 0.6%
92% better than Colorado average

Colorado average: 7.2%

Antipsychotic Use Info Percent of long-stay residents who received an antipsychotic medication 17.2%
8% better than Colorado average

Colorado average: 18.8%

Pneumococcal Vaccine Info Percent of long-stay residents assessed and appropriately given the pneumococcal vaccine 99.4%
7% better than Colorado average

Colorado average: 93.3%

Influenza Vaccine Info Percent of long-stay residents assessed and appropriately given the seasonal influenza vaccine 100.0%
6% better than Colorado average

Colorado average: 94.7%

Short-stay resident measures
Pneumococcal Vaccine Info Percent of short-stay residents assessed and appropriately given the pneumococcal vaccine 97.1%
27% better than Colorado average

Colorado average: 76.6%

Antipsychotic medication increase Info Percent of short-stay residents who newly received an antipsychotic medication 0.0%
100% better than Colorado average

Colorado average: 1.4%

Influenza Vaccine Info Percent of short-stay residents assessed and appropriately given the seasonal influenza vaccine 92.5%
22% better than Colorado average

Colorado average: 75.6%

Penalties and fines

Federal penalties imposed by CMS for regulatory violations, including civil money penalties (fines) and denials of payment for new Medicare/Medicaid admissions.

Source: CMS Penalties Database (Data as of Jan 2026)

Total fines amount $63K
58% higher than Colorado average

Colorado average: $40K

Number of fines 6
170% more fines than Colorado average

Colorado average: 2.2

Payment Denials Info Serious action where Medicare and/or Medicaid temporarily stops payments for new residents until issues are fixed. 0
100% fewer payment denials than Colorado average

Colorado average: 0.3

Fines amount comparison
This facility $63K
Colorado average $40K
Penalty History

Penalties are imposed by CMS for violations of federal nursing home regulations.

Civil Money Penalty Info Fines imposed for noncompliance, which can be assessed per day or per instance of violation. Apr 16, 2024
$22K
Civil Money Penalty Info Fines imposed for noncompliance, which can be assessed per day or per instance of violation. Oct 30, 2023
$14K
Civil Money Penalty Info Fines imposed for noncompliance, which can be assessed per day or per instance of violation. Sep 11, 2023
$14K
Civil Money Penalty Info Fines imposed for noncompliance, which can be assessed per day or per instance of violation. Jan 10, 2023
$4K

Last updated: Jan 2026

Guides for Better Senior Living

Care Cost Calculator: See Prices in Your Area

Nursing Home Data Explorer

Don’t Wait Too Long: 7 Red Flag Signs Your Parent Needs Assisted Living Now

The True Cost of Assisted Living in 2025 – And How Families Are Paying For It

Understanding Senior Living Costs: Pricing Models, Discounts & Financial Assistance

Financial Aid for Colorado Seniors

Get financial aid guidance

Elderly, Blind, and Disabled Waiver

Colorado Medicaid EBD Waiver

Age 65+ or disabled, Colorado resident, Medicaid- eligible, nursing home-level care need.

~$2,829/month (300% FBR, individual).

$2,000 (individual), $3,000 (couple).

Requires level-of-care assessment by case manager.

Old Age Pension (OAP) Health Care Program

Colorado OAP

Age 60+, Colorado resident.

~$1,215/month (individual).

$2,000 (individual).

Supplements SSI; limited medical coverage.

Program of All-Inclusive Care for the Elderly (PACE)

Colorado Medicaid PACE

Age 55+, Colorado resident, nursing home-level care need, safe with PACE support.

~$2,829/month (300% FBR).

$2,000 (individual), $3,000 (couple).

Limited to specific regions (e.g., Denver, Pueblo).

Home Care Allowance (HCA)

Colorado Home Care Allowance (HCA)

Seniors typically 65+, Age 5+ with disability, Colorado resident, financial/functional need.

~$1,004/month (individual, stricter than waivers).

$2,000 (individual), $3,000 (couple).

Must need help with ADLs; not Medicaid-waiver eligible.

Senior Community Service Employment Program (SCSEP)

Colorado SCSEP (federally funded, state-administered)

Age 55+, unemployed, low-income, Colorado resident.

~$1,983/month (125% FPL, individual).

Not specified; income-focused.

Priority for veterans, rural residents.

Who we are

Your Senior Care Partner, Every Step of the Way

We help families find affordable senior communities and unlock same day discounts, Medicaid, and Medicare options tailored to your needs.

Contact us Today
Tour Icon
Planning a tour? Check our touring checklist.
Chat Icon
Thinking of living here? We can help you speak to a current resident