Nursing Home

Golden Years Nursing and Rehab

Nursing Home

Golden Years Nursing and Rehab

318 Chambers St, Marlin, TX 76661 View map
Overview of Golden Years Nursing and Rehab

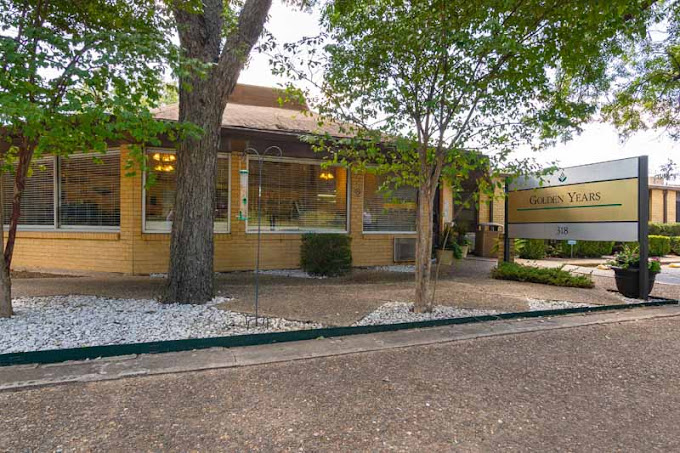
Situated in the serene neighborhood of Chambers Street, Marlin, TX, Golden Years Nursing and Rehab is a distinguished senior care community offering skilled nursing, rehabilitation therapy, and long- and short-term care. With its cozy and spacious rooms, the community promises a comfortable and safe residence. The community features round-the-clock care and assistance with a team of dedicated and skilled professionals comprised of licensed nurses, therapists, and social workers.

Golden Years Nursing and Rehab strives to improve seniors’ well-being, providing physical, occupational, and speech therapy, alongside other care services. Fun activities and wellness programs are conducted to ensure seniors remain active and happy. The community serves healthy and delicious meals to cater to residents’ dietary needs and preferences. Golden Years Nursing and Rehab is a great place to heal with its campus surrounded by wonderful trees and a serene environment.

(254) 883-5508

Managed by Randy Cheeks

Administrator (Interim)

Randy Cheeks serves as the Interim Administrator at Golden Years Nursing and Rehab. He leads the community with a focus on creating a healing environment where residents are treated like family. Under his leadership, the facility customizes care and therapy plans to meet individual needs and prioritizes safety measures during the COVID-19 pandemic.

Quality ratings

Measured by Centers for Medicare & Medicaid Services (CMS)

Overall rating Info Official CMS rating based on health inspections, staffing and quality measures.
5/5
Texas average: 3.0/5
Health Inspection Info Official CMS rating based on deficiencies found during state health inspections.
5/5
Texas average: 2.9/5
Staffing Info Official CMS rating based on nurse staffing hours per resident per day.
2/5
Texas average: 2.4/5
Quality Measures Info Official CMS rating based on clinical outcomes for residents.
5/5
Texas average: 4.0/5

Nursing care per resident

Info Average daily nursing hours per resident (adjusted for acuity). Higher values indicate more nursing time per resident.
3h 8m per day

This home provides 17% less nursing time per resident than the Texas average.

Texas average: 3h 46m per day

Staffing hours breakdown

Info Hours of care per resident per day, broken down by staff type. Data from CMS Medicare.
Staff type Facility State avg National avg
Registered Nurse (RN) Info Registered nurse hours per resident per day. 25m per day 21m per day 29m per day

Capacity and availability

Smaller home

May offer a more intimate, personalized care environment.

Total beds 86

This home usually has availability

Lower occupancy suggests more openings may be available.

Lower demand than the Texas average
Occupancy rate 42.8%
Residents per day (avg) 47
Occupancy rate
42.8%
Residents per day (avg)
47

Who this home usually serves

TYPE OF STAY

Mix of rehab and long-term care

This home supports both short-term rehab and long-term care, with residents staying for a wide range of durations.

Breakdown by payment type

Medicare

32% of new residents, usually for short-term rehab.

Typical stay 1 months

Private pay

52% of new residents, often for short stays.

Typical stay 1 - 2 months

Medicaid

16% of new residents, often for long-term daily care.

Typical stay 2 years

Finances and operations

Governmental community
Operated by state authorities.
Home revenue
$5.1M
Surplus of revenue
$98.2K
Governmental community Operated by state authorities.
Home revenue
$5,087,527.00
Surplus of revenue
$98,226.00
Payroll costs Info The portion of the home's budget spent on staff, including nurses, caregivers, and other employees who support care and operations.
$1
0% of revenue
Other operating costs Info All remaining costs needed to run the home, such as food, utilities, building maintenance, supplies and administrative expenses.
$5.1M
Total costs $5.1M
Bed community size
86-bed community
A larger shared setting that may offer more common spaces and organized community services.
Years in operation
50 years in operation
A longer operating history, which may indicate experience navigating regulations and delivering ongoing care.
Walk Score
Walk Score: 60 / 100
Moderately walkable. Some errands can be accomplished on foot, with a mix of nearby amenities.

Services

Medicare/medicaid

About this community

License details

Facility type
Nursing
Status Active
Issuance January 4, 2025
Expiration January 4, 2028
County: FALLS

Additional licensing details

License number: 308568
Year opened: 11/13/1975

Ownership & operating entity

Golden Years Nursing and Rehab is administrated by CONNOR HUGHES.

Management company: MARLIN NURSING AND REHAB CENTER LLC
Owner: FANNIN COUNTY HOSPITAL AUTHORITY
Ownership type: HOSPITAL DISTRICT/AUTHORITY

Type Of Units

Medicare
17 units
Medicaid and Medicare
69 units
Total beds
86 units

Staffing

Key information about the people who lead and staff this community.

Leadership

Care Services

Accepts Medicaid
Accepts Medicare
Nursing Services
Rehabilitation Services
Skilled Nursing
Licensed Nurses/CNAs
24-Hour Staffing
Short-Term Rehab

All Levels of Care

Skilled Nursing
Rehabilitation Therapy
Long-Term & Short-Term Care

Programs & Activities

Specific Programs
Skilled Nursing, Rehabilitation Therapy, Long-Term & Short-Term Care

Pricing & Financial Information

What does this home offer?

Building type icon
Building type icon

Building Type: Single-story

Fitness and recreation icon

Fitness and Recreation

Types of Care at Golden Years Nursing and Rehab

Skilled Nursing

Access & Eligibility

Ways to qualify for care at this community, including accepted programs and payment options.

Medicaid Accepted

This facility is certified for eligible Medicaid services.

Medicare Accepted

This facility is certified for eligible Medicare services.

Payment & Funding Options

Medicaid Medicare Long-term care insurance

Health Inspection History

Inspections
Total health inspections 4

Texas average 7.4


Last Health inspection on Oct 2024

Total health citations 10
Citations per inspection
2.5

Health citations are formal notices following inspections when they fail to comply with safety and care standards.

7 of 10 citations resulted from standard inspections; and 3 of 10 resulted from complaint investigations.

Breakdown of citation severity (last 3 years)
Critical Health citations More info 1
50% better than Texas average

Texas average: 2


Serious Health citations More info 0
100% better than Texas average

Texas average: 0.4

1 critical citation More info Texas average: 2

0 serious citations More info Texas average: 0.4

9 moderate citations More info Texas average: 23

0 minor citations More info Texas average: 0.4
Citations history (last 3 years)
Care Planning moderate citation Oct 30, 2024
Corrected

Quality of Care moderate citation Jul 03, 2024
Corrected

Resident Rights moderate citation Jul 03, 2024
Corrected

Abuse/Neglect moderate citation Jun 03, 2024
Corrected

Compare Nursing Homes around Marlin

The information below is reported by the Texas Health and Human Services Commission.
Golden Years Nursing and Rehab
SNF

Nursing Homes 24/7 care needed

Marlin
86
60
MARLIN NURSING AND REHAB CENTER LLC
42.8%
$4,905,566.00
$1.00
0%
47.00
5/5
3.1319
5/5
2/5
5/5
1
10
1
-29%
-14%
-33%

Places of interest near Golden Years Nursing and Rehab

Address 0.5 miles from city center — 0.07 miles to nearest hospital (Falls Community Hospital and Clinic)

Address 318 Chambers St, Marlin, TX 76661

Calculate Travel Distance to Golden Years Nursing and Rehab

Add your location

Address

Staffing Data

Source: CMS Payroll-Based Journal (Q2 2025)

57
Total Staff
43
Employees
14
Contractors
17,833
Total Hours (Quarter)
22
Avg Staff/Day
8.9
Avg Shift (hrs)
Nursing Staff Breakdown
Role Count Avg Shift (hrs) Uses Contractors?
Registered Nurse310.2 No
Licensed Practical Nurse119.7 Yes
Certified Nursing Assistant189.5 Yes
Staff by Category
Administration
1 staff
8hs shift avg
Nursing Staff
34 staff
9.5hs shift avg
Physicians & Practitioners
2 staff
8hs shift avg
Therapy Services
16 staff
7.5hs shift avg
Activities & Recreation
1 staff
7.4hs shift avg
Social Services
1 staff
7.5hs shift avg
Dietary Services
1 staff
8.3hs shift avg
Other Services
1 staff
9hs shift avg
Contractor Analysis
7.2%
of total hours from contractors
1,284 contractor hours this quarter
Certified Nursing Assistant: 5 Respiratory Therapy Technician: 3 Licensed Practical Nurse: 4 Physical Therapy Assistant: 2
Role Employees Contractors Total Staff Total Hours Days Worked % of Days Avg Shift (hrs)
Certified Nursing Assistant135185,78891100%9.5
Licensed Practical Nurse74113,08891100%9.7
Registered Nurse3031,3538796%10.2
Respiratory Therapy Technician2351,1636571%7.1
Speech Language Pathologist3031,0586875%8.3
RN Director of Nursing2029846470%8
Physical Therapy Aide6069156571%7.1
Physical Therapy Assistant0225566470%7.8
Nurse Practitioner2025526268%8
Other Dietary Services Staff1015296470%8.3
Administrator1015126470%8
Qualified Social Worker1014796470%7.5
Qualified Activities Professional1014676369%7.4
Mental Health Service Worker1013894347%9

Facility Characteristics

Source: CMS Long-Term Care Facility Characteristics (Data as of Jan 2026)

Total census
40 residents
Residents by payment source
Medicare
3 residents (7.5%)
Medicaid
29 residents (72.5%)
Private pay or other
8 residents (20%)
Programs & Services
Residents' Group

Residents meet regularly to discuss policies, care quality, and activities

Active Resident Council

Organized group of residents that meets regularly to discuss facility policies, quality of life, and activities.

Quality of care over time

These measures show how residents usually do over time at this home, based on health outcomes and preventive care.

High-risk clinical events score Info A composite score based on pressure ulcers, falls with injury, weight loss, walking ability decline, and activities of daily living decline. 7.8
10% better than Texas average

Texas average: 8.6

Functional decline score Info A composite score based on activities of daily living decline, walking ability decline, and incontinence. 15.2
5% better than Texas average

Texas average: 16.0

Long-stay resident measures
Significantly above average Texas avg: 4.2 Info CMS star rating based on long-stay quality measure performance. 5 stars = significantly above average, 1 star = significantly below average.
Need for Help with Daily Activities Increased Info Percent of long-stay residents whose need for help with daily activities has increased 18.3%
13% worse than Texas average

Texas average: 16.2%

Walking Ability Worsened Info Percent of long-stay residents whose ability to move independently worsened 13.3%
18% better than Texas average

Texas average: 16.2%

Low Risk Residents with Bowel/Bladder Incontinence Info Percent of low risk long-stay residents who lose control of their bowels or bladder 14.0%
10% better than Texas average

Texas average: 15.7%

Falls with Major Injury Info Percent of long-stay residents experiencing one or more falls with major injury 0.0%
100% better than Texas average

Texas average: 3.2%

High Risk Residents with Pressure Ulcers Info Percent of long-stay high risk residents with pressure ulcers 2.9%
34% better than Texas average

Texas average: 4.4%

Urinary Tract Infection Info Percent of long-stay residents with a urinary tract infection 0.6%
21% better than Texas average

Texas average: 0.8%

Lost Too Much Weight Info Percent of long-stay residents who lose too much weight 4.3%
25% worse than Texas average

Texas average: 3.5%

Depressive Symptoms Info Percent of long-stay residents who have depressive symptoms 0.7%
76% better than Texas average

Texas average: 2.9%

Antipsychotic Use Info Percent of long-stay residents who received an antipsychotic medication 4.1%
47% better than Texas average

Texas average: 7.9%

Pneumococcal Vaccine Info Percent of long-stay residents assessed and appropriately given the pneumococcal vaccine 97.5%
In line with Texas average

Texas average: 97.3%

Influenza Vaccine Info Percent of long-stay residents assessed and appropriately given the seasonal influenza vaccine 95.2%
In line with Texas average

Texas average: 97.9%

Hospitalizations per 1,000 days Info Number of hospitalizations per 1,000 long-stay resident days. 2.12
In line with Texas average

Texas average: 2.13

ED visits per 1,000 days Info Number of outpatient emergency department visits per 1,000 long-stay resident days. 2.34
13% worse than Texas average

Texas average: 2.07

Short-stay resident measures
Pneumococcal Vaccine Info Percent of short-stay residents assessed and appropriately given the pneumococcal vaccine 85.2%
6% worse than Texas average

Texas average: 90.4%

Antipsychotic medication increase Info Percent of short-stay residents who newly received an antipsychotic medication 0.0%
100% better than Texas average

Texas average: 1.4%

Influenza Vaccine Info Percent of short-stay residents assessed and appropriately given the seasonal influenza vaccine 80.0%
9% worse than Texas average

Texas average: 88.0%

Falls with major injury Info Percentage of SNF residents who experience falls with major injury during their stay. 0.0%
100% better than Texas average

Texas average: 0.8%

Penalties and fines

Federal penalties imposed by CMS for regulatory violations, including civil money penalties (fines) and denials of payment for new Medicare/Medicaid admissions.

Source: CMS Penalties Database (Data as of Jan 2026)

Total fines amount $8K
90% lower than Texas average

Texas average: $80K

Number of fines 1
60% fewer fines than Texas average

Texas average: 2.5

Payment Denials Info Serious action where Medicare and/or Medicaid temporarily stops payments for new residents until issues are fixed. 0
100% fewer payment denials than Texas average

Texas average: 0.2

Fines amount comparison
This facility $8K
Texas average $80K
Penalty History

Penalties are imposed by CMS for violations of federal nursing home regulations.

Civil Money Penalty Info Fines imposed for noncompliance, which can be assessed per day or per instance of violation. Jun 3, 2024
$8K

Last updated: Jan 2026

Guides for Better Senior Living

Care Cost Calculator: See Prices in Your Area

Nursing Home Data Explorer

Don’t Wait Too Long: 7 Red Flag Signs Your Parent Needs Assisted Living Now

The True Cost of Assisted Living in 2025 – And How Families Are Paying For It

Understanding Senior Living Costs: Pricing Models, Discounts & Financial Assistance

Financial Aid for Texas Seniors

Get financial aid guidance

Community Care for the Aged and Disabled (CCAD)

TX Medicaid CCAD

Age 65+ or disabled, Texas resident, Medicaid-eligible, care need (not always nursing home level).

~$2,829/month (300% FBR, individual).

$2,000 (individual), $3,000 (couple).

Large state; rural access challenges.

Texas Community Care Services

TX CCS

Age 60+, Texas resident, at risk of decline.

~$2,000/month (individual, varies).

$5,000 (individual).

Limited funding; high demand in urban areas.

Area Agency on Aging (AAA) Services

Texas AAA Services

Age 60+, TX resident; no income/asset limits.

None; donations encouraged.

Not assessed.

28 AAAs; includes Meals on Wheels in some areas.

Medicare Savings Program (MSP)

Texas Medicare Savings Program

Age 65+ or disabled, TX resident, Medicare Part A/B.

~$2,510/month (QMB), ~$3,380/month (SLMB), ~$3,598/month (QI)—individual.

$9,430 (individual), $14,130 (couple).

Includes Extra Help for Part D; no waitlist.

Low-Income Home Energy Assistance Program (LIHEAP)

Texas Comprehensive Energy Assistance Program (CEAP)

Age 60+ prioritized, TX resident, low-income.

~$3,970/month (185% FPL).

Not assessed.

Priority for elderly/disabled; covers gas, electric, propane.

Family Caregiver Support Program (FCSP)

Texas Family Caregiver Support Program

Caregivers of 60+ needing care or 55+ caregivers of others; TX resident; 2+ ADLs.

No strict cap; prioritizes low-income (~$24,980/year).

Not assessed.

High rural demand; includes grandparent caregivers.

Senior Community Service Employment Program (SCSEP)

Texas SCSEP

Age 55+, unemployed, low-income, TX resident.

~$1,983/month (125% FPL).

Not specified.

Priority for veterans, rural residents; AARP partnership.

VA Aid and Attendance (A&A) and Housebound Benefits

Texas VA Aid and Attendance/Housebound

Age 65+ or disabled veteran/spouse, TX resident, wartime service, ADL help (A&A) or homebound.

Net income < ~$1,984/month (veteran with dependent, A&A); pension offsets income.

~$155,356 (net worth).

High veteran population; supports rural/urban needs.

Property Tax Exemption for Seniors

Texas Senior Property Tax Exemption

Age 65+, TX resident, homeowner (homestead).

None; tax-based eligibility.

Not assessed.

$25,000+ exemption; optional freeze in some counties; saves ~$500-$1,000/year.

Senior Farmers’ Market Nutrition Program (SFMNP)

Texas SFMNP

Age 60+, TX resident, low-income.

~$2,322/month (185% FPL).

Not assessed.

Vouchers (~$50/season); serves ~20,000 via 28 AAAs.