Explore Open Rooms

1 Contact details
2 What type of senior care service are you looking for?
3 What budget do you have in mind for senior care?
4 How soon do you need to find care?
5 Additional details

Thank you for your interest!

Our team will be in touch shortly to help with next steps.

Nursing Home in Fullerton

CMS overall rating Info The Overall CMS Rating combines results from health inspections, staffing levels and quality measures. Health inspections carry the most weight. Staffing and quality scores can increase or decrease the final rating based on performance compared to state and national standards.

Greenfield Care Center of Fullerton

330 W Bastanchury Rd, Fullerton, CA 92835 View map
Overview of Greenfield Care Center of Fullerton

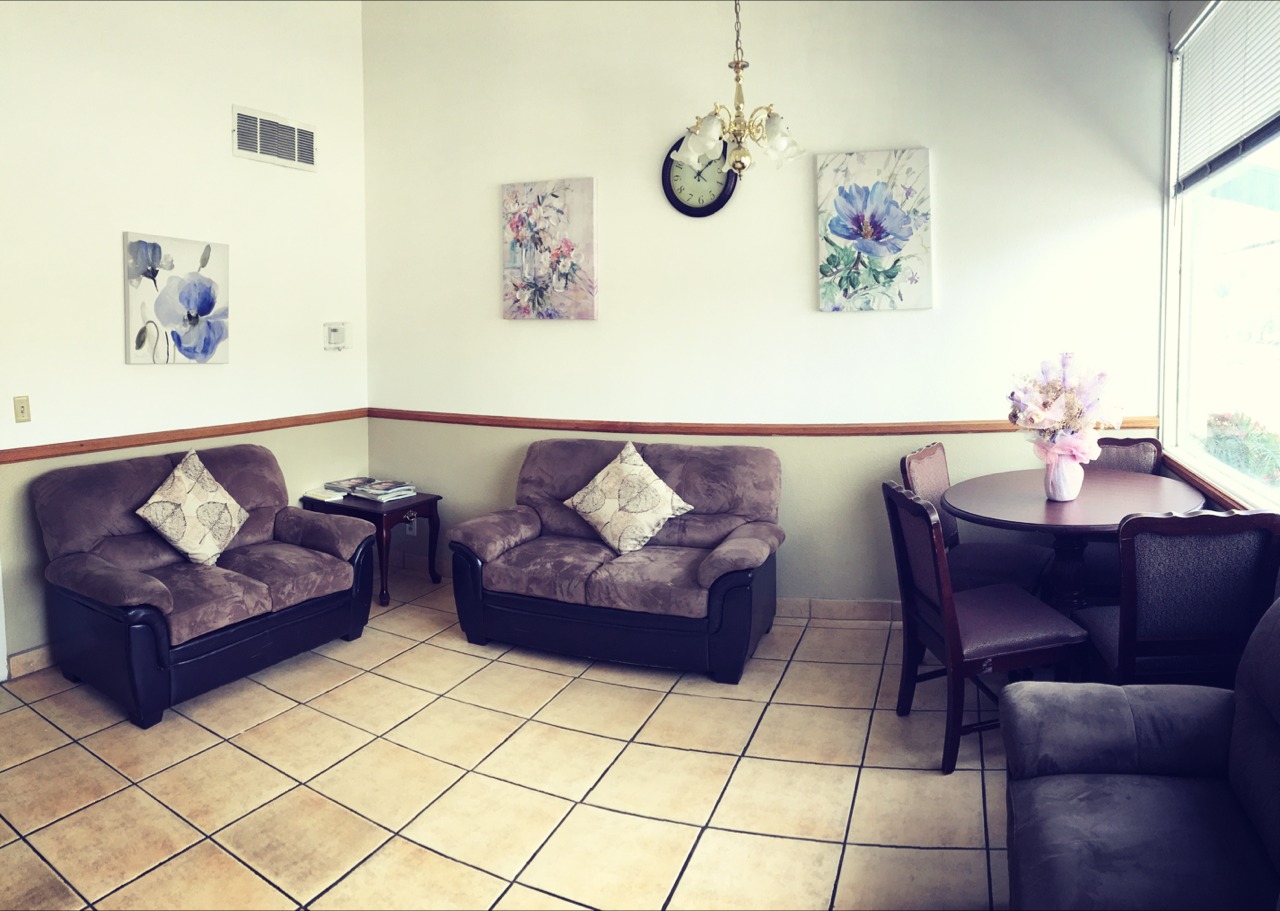
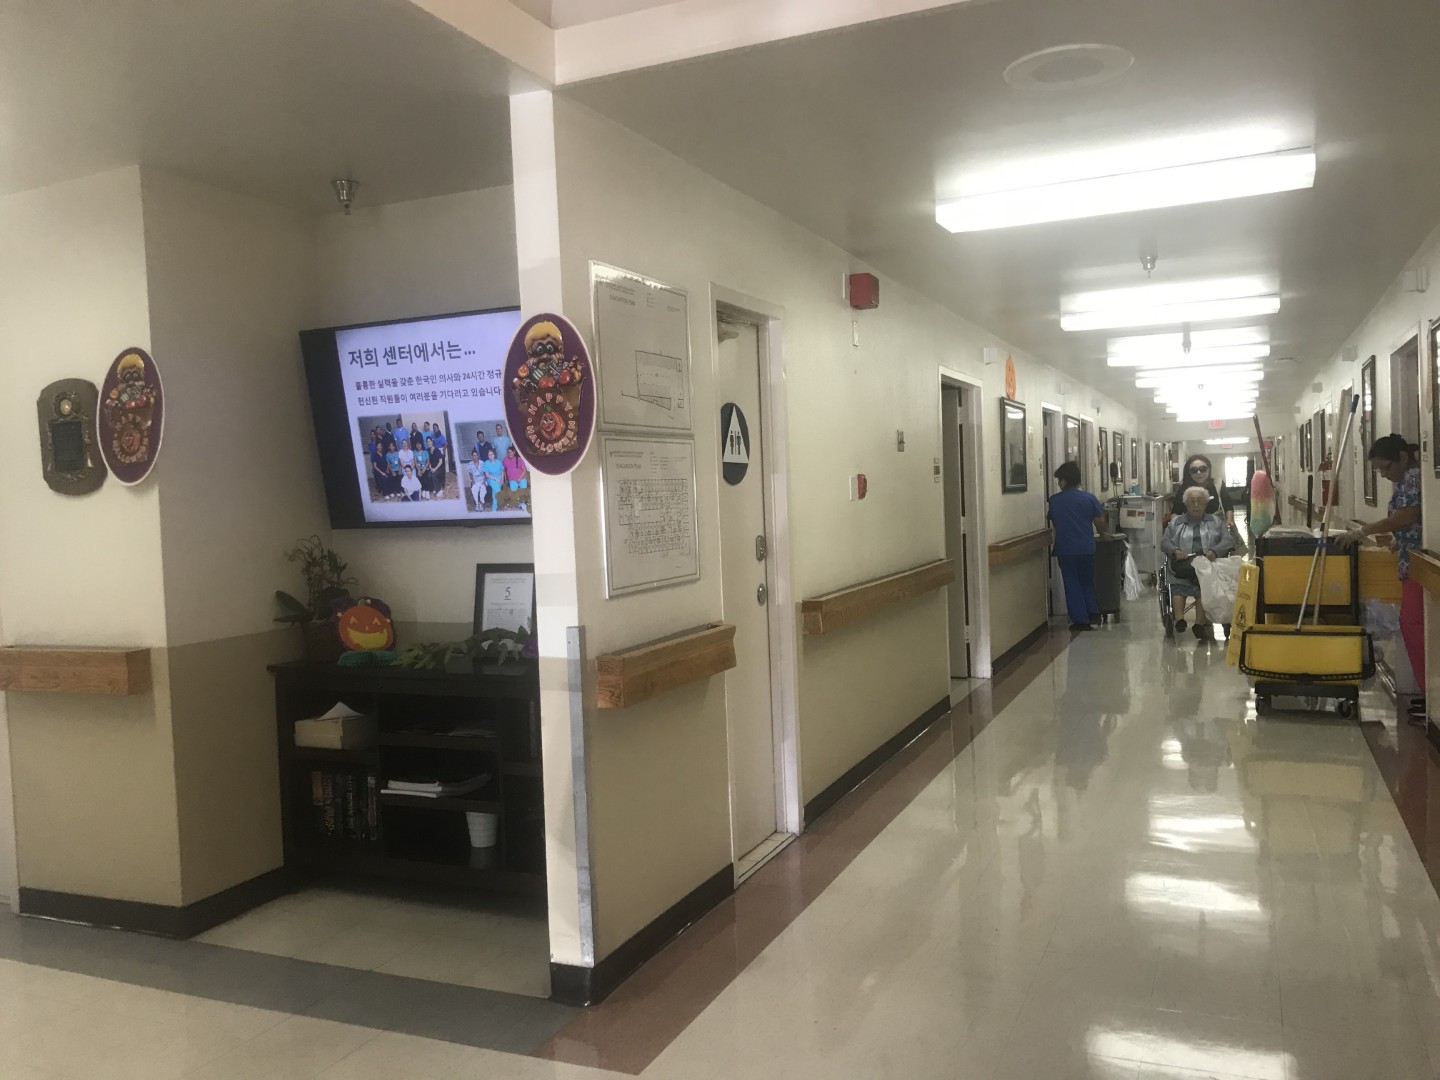
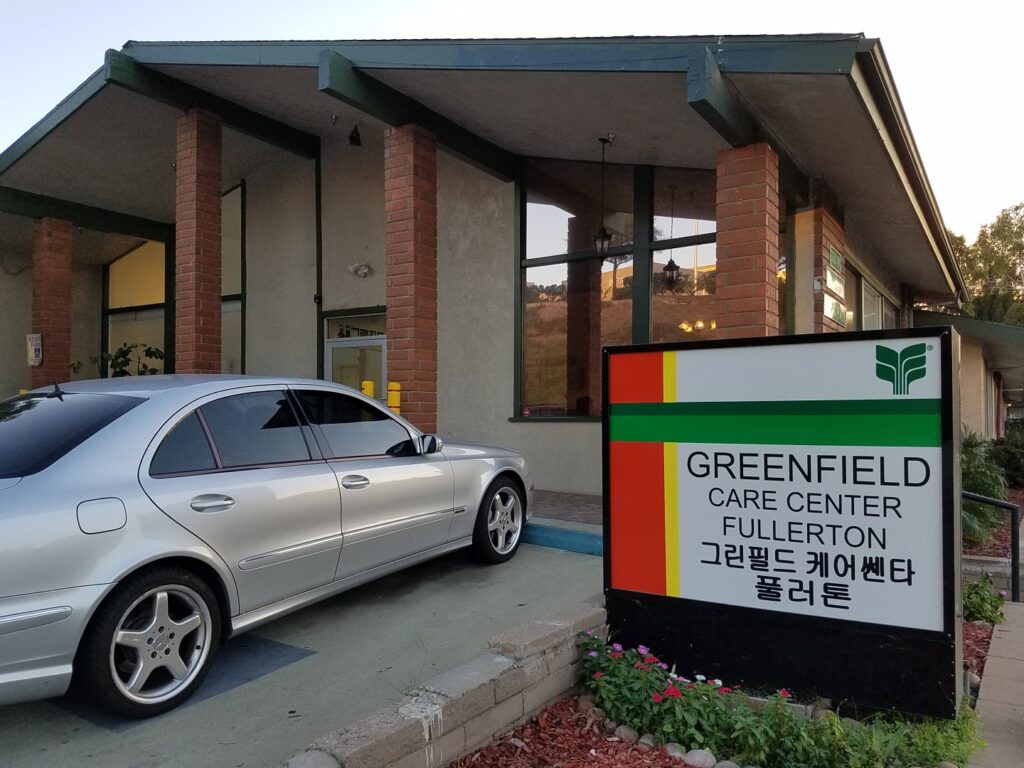
Greenfield Care Center of Fullerton is an astounding nursing home in Fullerton, CA, that offers long-term care, rehabilitation, hospice, and respite care. The community ensures older adults are treated like a family, providing individualized care for their unique needs. 24-hour care, therapy services, and wound care are also offered to meet residents’ healthcare needs. With its dedication to residents’ well-being, the community provides care plans based on their physician’s order and a comprehensive health assessment.

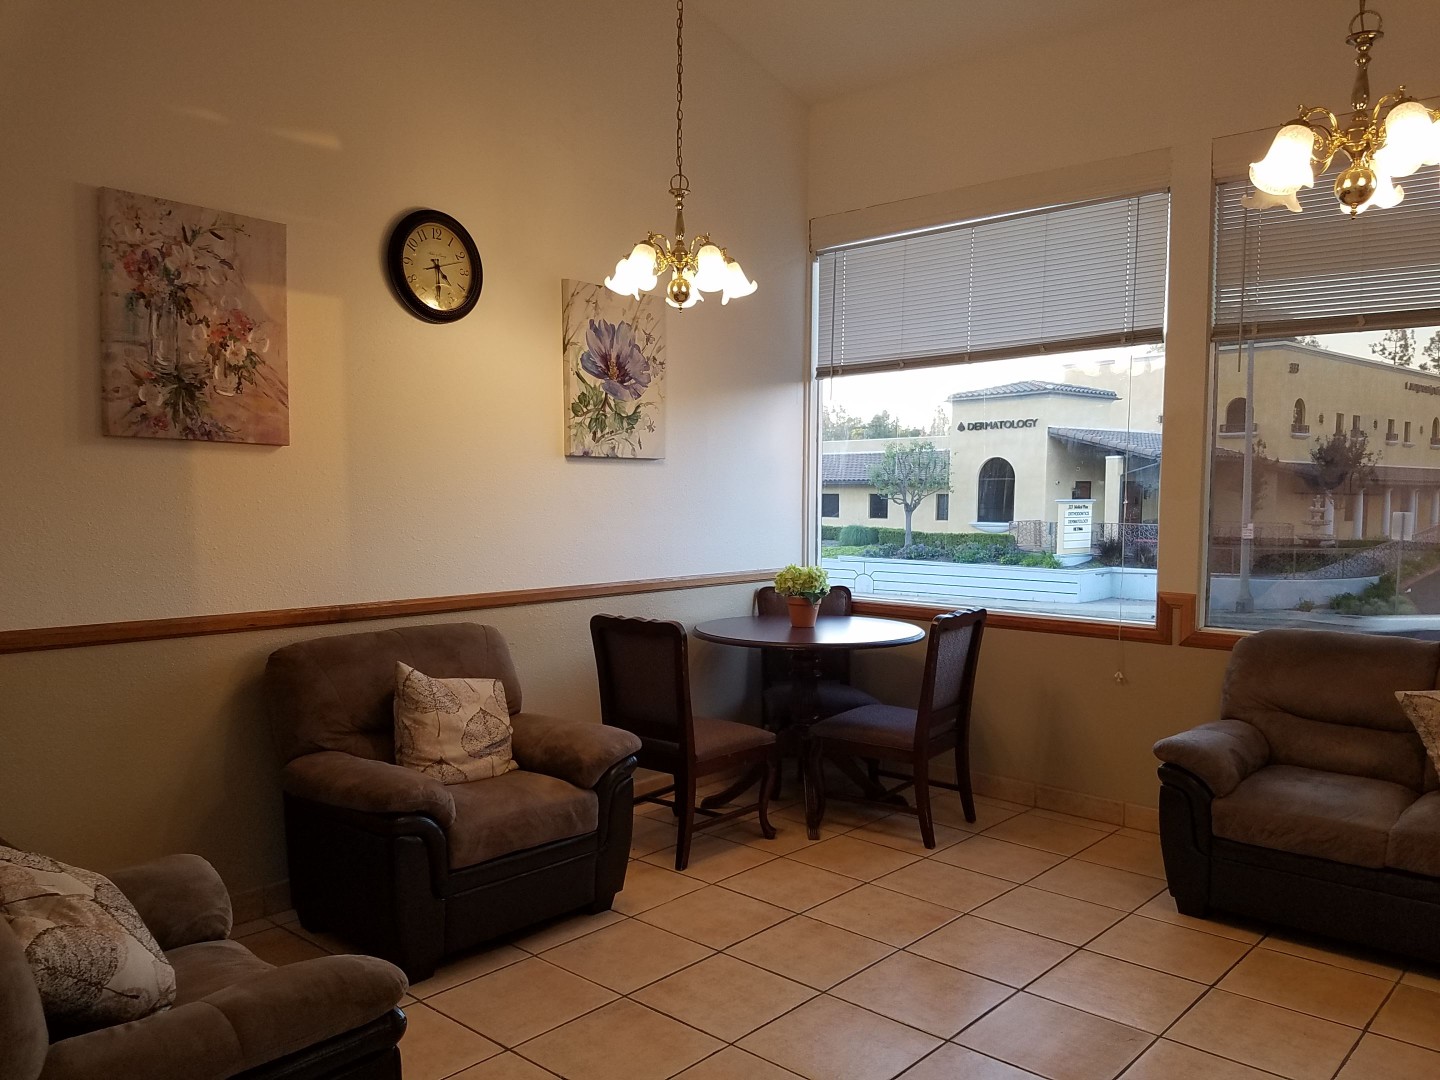
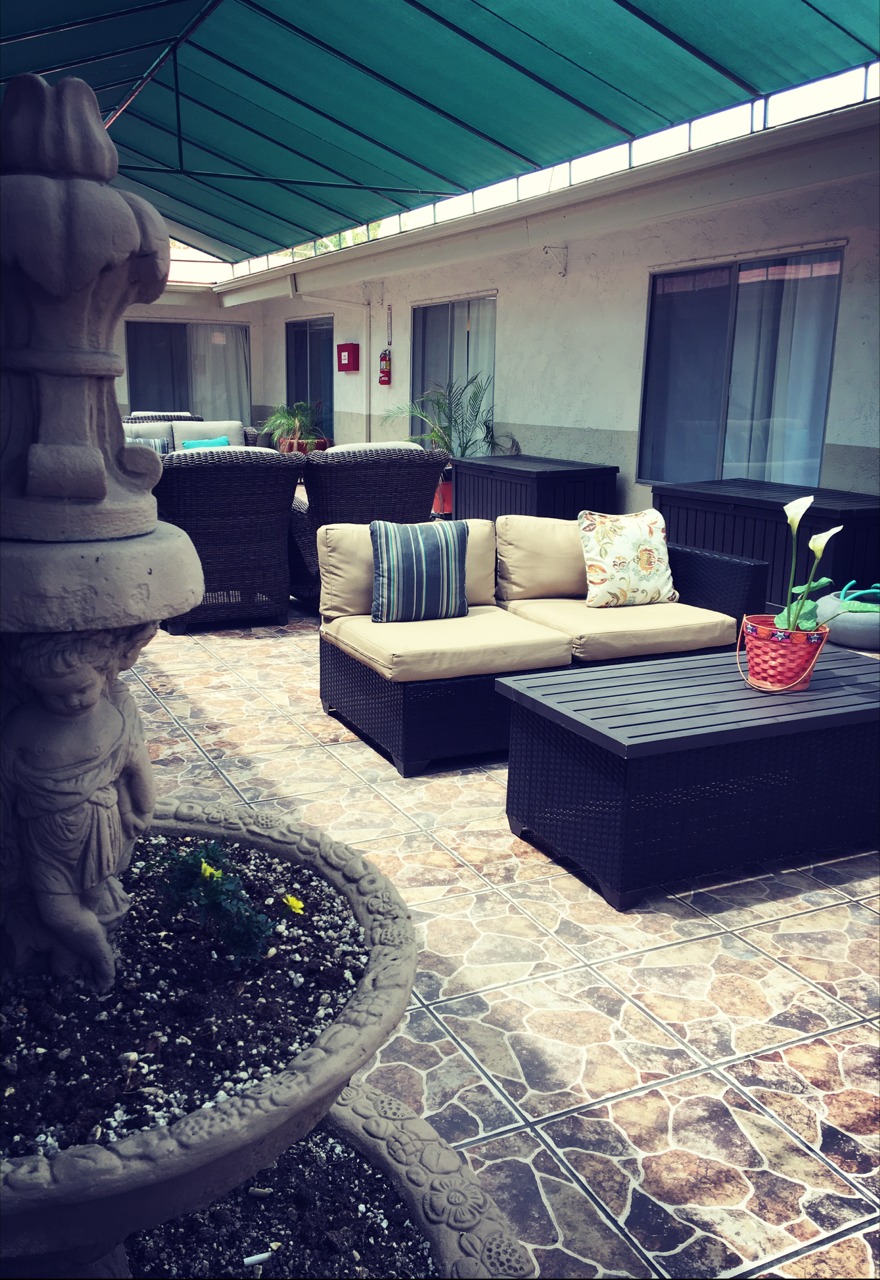
Recreational activities and fitness programs are conducted, so residents can spend their free time as they please. With activity rooms, outdoor patio, and spacious courtyards, residents have plenty of options for leisure. This nursing home is one of the trusted choices for retirement in Fullerton, California, especially with its comprehensive services and extensive amenities.

Managed by Sarah Park

Administrator

Sarah Park serves as the Administrator at Greenfield Care Center of Fullerton. She is recognized by families for her instrumental role in providing professional and compassionate care, contributing significantly to residents' recovery and well-being. Her leadership ensures a supportive environment where staff and families collaborate closely to deliver the best care plans.

Quality ratings

Measured by Centers for Medicare & Medicaid Services (CMS)

Overall rating Info The Overall CMS Rating combines results from health inspections, staffing levels and quality measures. Health inspections carry the most weight. Staffing and quality scores can increase or decrease the final rating based on performance compared to state and national standards.
5/5
California average: 3.6/5
Health Inspection Info Based on the results of the facility's three most recent standard inspections and any complaint investigations. CMS reviews the number, scope, and severity of deficiencies, with more recent findings weighted more heavily.
4/5
California average: 3.2/5
Staffing Info Measures average nursing staff hours per resident per day, including Registered Nurses (RNs) and total nursing staff. Ratings are adjusted based on the level of care residents require and are compared to state and national benchmarks.
5/5
California average: 3.5/5
Quality Measures Info Based on clinical and physical health indicators reported to CMS, such as hospital readmissions, falls, pressure ulcers, and improvements in mobility. These measures reflect how well residents' health needs are being managed.
5/5
California average: 4.3/5

Nursing care per resident

Info This shows how many total hours of nursing staff time are available per resident each day. Higher numbers usually mean more staff support.
4h 23m per day

This home provides 0% more nursing time per resident than the California average.

California average: 4h 23m per day

Staffing hours breakdown

Info Hours of care per resident per day, broken down by staff type. Data from CMS Medicare.
Staff type Facility State avg National avg
Registered Nurse (RN) Info Registered nurse hours per resident per day. 45m per day 39m per day 41m per day
Nurse Aide Info Nurse aide hours per resident per day. 2h 32m per day 2h 39m per day 2h 21m per day
Total Nursing (Weekend) Info Total number of nurse staff hours per resident per day on weekends. 3h 52m per day 4h 5m per day 3h 26m per day
Physical Therapist Info Physical therapist staff hours per resident per day. 7m per day 5m per day 4m per day
RN (Weekend) Info Registered nurse hours per resident per day on weekends. 38m per day 30m per day 29m per day

Capacity and availability

Smaller home

May offer a more intimate, personalized care environment.

Total beds 99

This home usually has limited availability

Occupancy is moderate, suggesting balanced demand.

Similar demand to the California average
Occupancy rate 86.9%
Residents per day (avg) 88
Occupancy rate
86.9%
Residents per day (avg)
88

Who this home usually serves

TYPE OF STAY

Mostly short-term rehab stays

Most residents typically stay for a few weeks or months before returning home or moving on.

Might be optimal for
Short stays Recovery Medicare-covered care

Breakdown by payment type

Medicare

69% of new residents, usually for short-term rehab.

Typical stay 1 - 2 months

Private pay

25% of new residents, often for short stays.

Typical stay 1 - 2 months

Medicaid

5% of new residents, often for long-term daily care.

Typical stay 10 - 11 years

Finances and operations

Privately-owned community
Operated by a business corporation.
Home revenue
$14.0M
Profit
$246.9K
Privately-owned community Operated by a business corporation.
Home revenue
$14,024,738.00
Profit
$246,946.00
Payroll costs Info The portion of the home's budget spent on staff, including nurses, caregivers, and other employees who support care and operations.
$5.8M
41.5% of revenue
Other operating costs Info All remaining costs needed to run the home, such as food, utilities, building maintenance, supplies and administrative expenses.
$8.0M
Total costs $13.8M
Walk Score
Walk Score: 50 / 100
Moderately walkable. Some errands can be accomplished on foot, with a mix of nearby amenities.
BBB Rating
BBB Rating: A+ (Not Accredited)
An independent rating from the Better Business Bureau based on factors such as complaint history, transparency, and business practices.
How BBB ratings work

About this community

Additional Licensing Details

CMS Certification Number56151

Therapy & Rehabilitation

2 services
Rehabilitation Services
Respite Care

Staffing & Medical

2 services
Skilled Nursing
24-Hour Staffing

Amenities & Lifestyle

0 amenities
Specific ProgramsRehabilitation, Hospice & Respite Care, Long-term Care

What does this home offer?

Housing options icon

Housing Options: Private / Shared Rooms

Building type icon
Building type icon

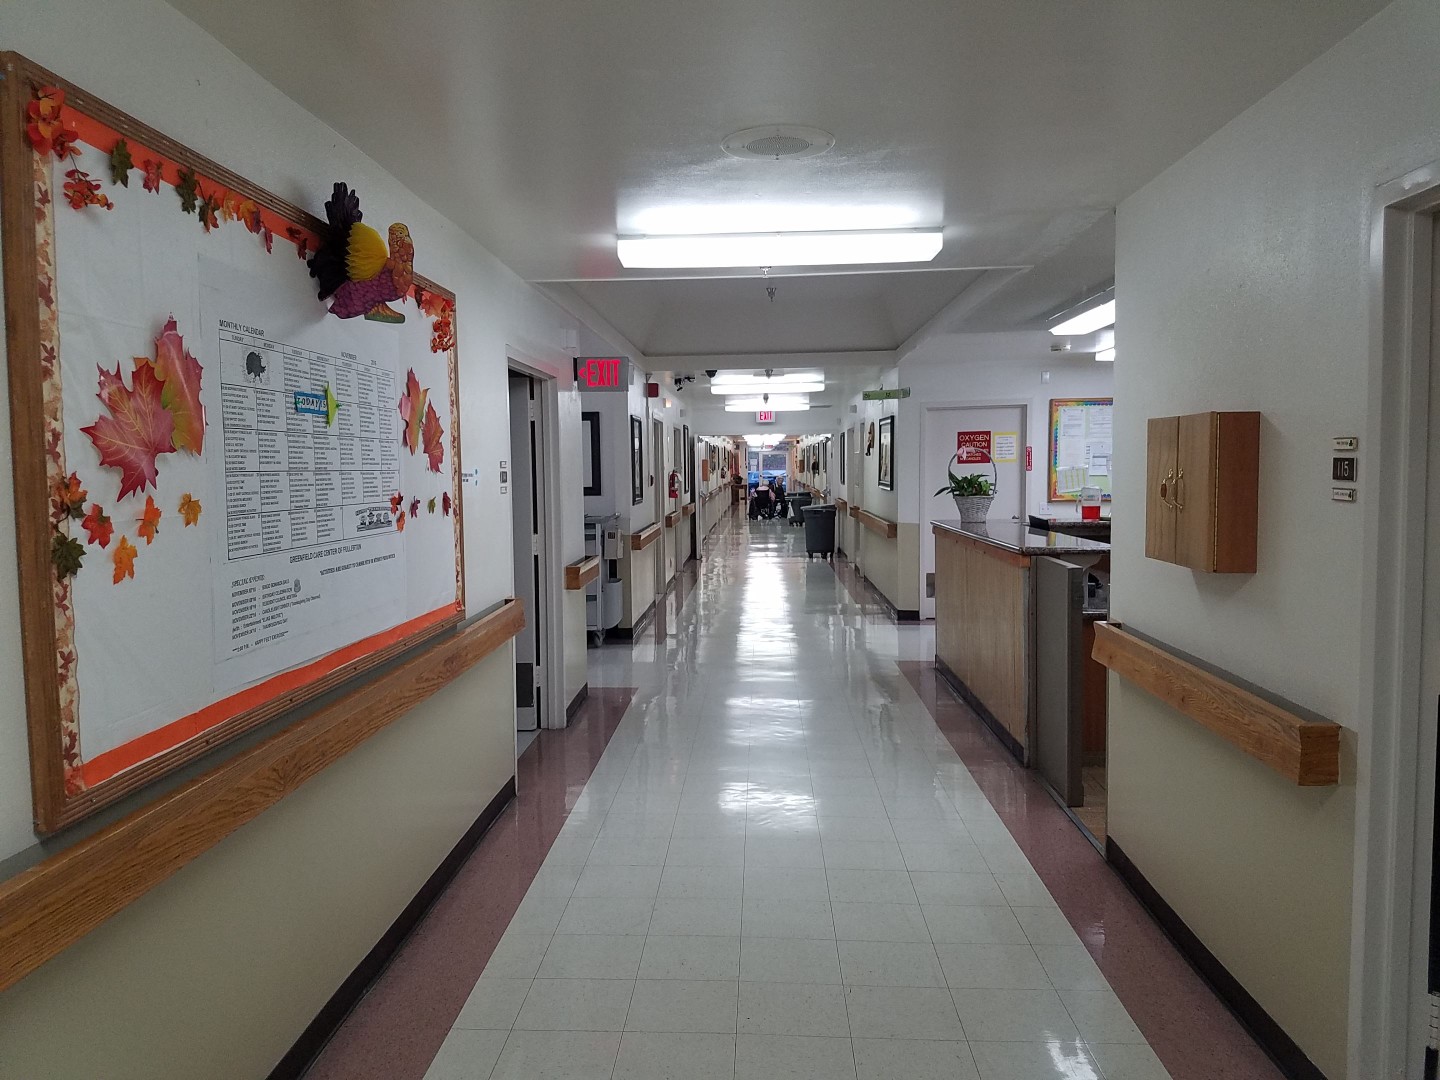
Building Type: Single-story

Dining services icon

Dining Services

Social and recreational activities icon

Social and Recreational Activities

Housekeeping icon
Housekeeping icon

Housekeeping Services

On-site medical care and health services icon

On-site Medical Care and Health Services

Rehabilitative support icon

Rehabilitative Support

Types of Care at Greenfield Care Center of Fullerton

Nursing Home

Inspection History

In California, the Department of Social Services (for assisted living facilities) and the Department of Public Health (for nursing homes) conduct inspections to ensure resident safety and regulatory compliance.

Health Inspection History

Inspections
Total health inspections 4

California average 12.5


Last Health inspection on Sep 2025

Total health citations 31

California average 50.2

Citations per inspection
7.75

California average 4.65


Health citations are formal notices following inspections when they fail to comply with safety and care standards.

29 of 31 citations resulted from standard inspections; and 2 of 31 resulted from complaint investigations.

Breakdown of citation severity (last 3 years)
Critical Health citations More info 0
100% better than California average

California average: 0.4


Serious Health citations More info 0
100% better than California average

California average: 1

0 critical citations More info California average: 0.4

0 serious citations More info California average: 1

28 moderate citations More info California average: 47.2

3 minor citations More info California average: 1.5
Citations history (last 3 years)
Infection Control moderate citation Info Issues related to preventing and controlling infections, including hygiene practices and safety protocols. Sep 11, 2025
Corrected

Nutrition moderate citation Info Issues related to food quality, meal service, and resident's nutritional needs. Sep 11, 2025
Corrected

Pharmacy moderate citation Info Issues related to medication management, including how drugs are stored, administered, and monitored. Sep 11, 2025
Corrected

Pharmacy moderate citation Info Issues related to medication management, including how drugs are stored, administered, and monitored. Sep 11, 2025
Corrected

Compare Nursing Homes around Fullerton The information below is reported by the California Department of Social Services and Department of Public Health.

1 facility compared · CMS & CA Dept. of Health data · Updated Apr 2026

Filter by care type
Greenfield Care Center of Fullerton
NH

Nursing Home Licensed facility providing 24/7 skilled nursing care for residents with complex, ongoing medical needs. Staffed by RNs, LPNs, and CNAs. Inspected and star-rated annually by CMS. Accepts Medicare (short-term rehab) and Medicaid (long-term care).

Fullerton
99
86.9%
+3%
4.38
+39%
+4%
1
31
7.8
0
88
A+
50
$12.9M
$5.8M
45.1%
56151
Private / Shared Rooms

Places of interest near Greenfield Care Center of Fullerton

Address 2.1 miles from city center

Address 330 W Bastanchury Rd, Fullerton, CA 92835

Calculate Travel Distance to Greenfield Care Center of Fullerton

Add your location

Address

Staffing Data (Q2 2025)

This data corresponds to Q2 2025 and is based on CMS Payroll-Based Journal.

Total staff 101
Employees 82
Contractors 19
Staff to resident ratio 1.15:1
1147627% better than California average

California average ratio: 0.00:1

Avg staff/day 54
Average shift 7.6 hours
0% compared with California average

California average: 7.7 hours

Total staff hours (quarter) 37,348
Nursing staff breakdown
Registered Nurse

Manages medical care and health needs.

Total count 12
Average shift length Info Average shift length. Calculated as total hours divided by days worked and average staff per day. 7.7 hours

This role is partially covered by contractors.

Licensed Practical Nurse

Assists with medical care and medications.

Total count 14
Average shift length Info Average shift length. Calculated as total hours divided by days worked and average staff per day. 7.6 hours

No contractors work on this role.

Certified Nursing Assistant

Helps with daily care and mobility.

Total count 45
Average shift length Info Average shift length. Calculated as total hours divided by days worked and average staff per day. 7.8 hours

No contractors work on this role.

Contractor staffing

Total hours from contractors

7.4%

2,768 contractor hours this quarter

Physical Therapy Assistant: 4 Respiratory Therapy Technician: 3 Speech Language Pathologist: 2 Therapeutic Recreation Specialist: 2 Registered Nurse: 1 Medical Director: 1 Occupational Therapy Aide: 1 Qualified Social Worker: 1 Occupational Therapy Assistant: 1 Physical Therapy Aide: 1 Diagnostic X-ray Services Staff: 1 Other Social Services Staff: 1
Staff by category
Certified Nursing Assistant4504520,01491100%7.8
Licensed Practical Nurse140145,34691100%7.6
Registered Nurse111124,53091100%7.7
RN Director of Nursing3031,2767178%7.9
Other Dietary Services Staff3031,23291100%7.8
Respiratory Therapy Technician0338027886%5.3
Physical Therapy Assistant0447317785%6.2
Administrator1015206571%8
Nurse Practitioner1015206571%8
Dietitian1015206571%8
Clinical Nurse Specialist2025046167%8
Dental Services Staff1014405560%8
Therapeutic Recreation Specialist0223035156%5.9
Speech Language Pathologist0222405965%3.8
Qualified Social Worker0111253943%3.2
Occupational Therapy Aide011921314%7
Physical Therapy Aide011821921%4.3
Medical Director011421213%3.5
Occupational Therapy Assistant0112433%8
Other Social Services Staff011311%3
Diagnostic X-ray Services Staff011333%1
45 Certified Nursing Assistant
% of Days 100%
14 Licensed Practical Nurse
% of Days 100%
12 Registered Nurse
% of Days 100%
3 RN Director of Nursing
% of Days 78%
3 Other Dietary Services Staff
% of Days 100%
3 Respiratory Therapy Technician
% of Days 86%
4 Physical Therapy Assistant
% of Days 85%
1 Administrator
% of Days 71%
1 Nurse Practitioner
% of Days 71%
1 Dietitian
% of Days 71%
2 Clinical Nurse Specialist
% of Days 67%
1 Dental Services Staff
% of Days 60%
2 Therapeutic Recreation Specialist
% of Days 56%
2 Speech Language Pathologist
% of Days 65%
1 Qualified Social Worker
% of Days 43%
1 Occupational Therapy Aide
% of Days 14%
1 Physical Therapy Aide
% of Days 21%
1 Medical Director
% of Days 13%
1 Occupational Therapy Assistant
% of Days 3%
1 Other Social Services Staff
% of Days 1%
1 Diagnostic X-ray Services Staff
% of Days 3%

Facility Characteristics

Source: CMS Long-Term Care Facility Characteristics (Data as of Jan 2026)

Total census
88 residents
Residents by payment source
Medicare
15 residents (17%)
Medicaid
68 residents (77.3%)
Private pay or other
5 residents (5.7%)
Programs & Services
Residents' Group

Residents meet regularly to discuss policies, care quality, and activities

Nurse Aide Training

State-approved Nurse Aide Training and Competency Evaluation Program on-site

Active Resident Council

Organized group of residents that meets regularly to discuss facility policies, quality of life, and activities.

Quality of care over time

These measures show how residents usually do over time at this home, based on health outcomes and preventive care.

High-risk clinical events score Info A composite score based on pressure ulcers, falls with injury, weight loss, walking ability decline, and activities of daily living decline. 4.1
39% better than California average

California average: 6.6

Functional decline score Info A composite score based on activities of daily living decline, walking ability decline, and incontinence. 4.8
57% better than California average

California average: 11.3

Long-stay resident measures
Significantly above average California avg: 4.3 Info CMS star rating based on long-stay quality measure performance. 5 stars = significantly above average, 1 star = significantly below average.
Need for Help with Daily Activities Increased Info Percent of long-stay residents whose need for help with daily activities has increased 4.3%
61% better than California average

California average: 11.1%

Walking Ability Worsened Info Percent of long-stay residents whose ability to move independently worsened 6.9%
42% better than California average

California average: 12.0%

Low Risk Residents with Bowel/Bladder Incontinence Info Percent of low risk long-stay residents who lose control of their bowels or bladder 3.4%
70% better than California average

California average: 11.3%

Falls with Major Injury Info Percent of long-stay residents experiencing one or more falls with major injury 2.2%
33% worse than California average

California average: 1.7%

High Risk Residents with Pressure Ulcers Info Percent of long-stay high risk residents with pressure ulcers 0.5%
90% better than California average

California average: 5.0%

Urinary Tract Infection Info Percent of long-stay residents with a urinary tract infection 0.7%
47% better than California average

California average: 1.2%

Lost Too Much Weight Info Percent of long-stay residents who lose too much weight 6.5%
54% worse than California average

California average: 4.2%

Depressive Symptoms Info Percent of long-stay residents who have depressive symptoms 0.0%
100% better than California average

California average: 6.7%

Antipsychotic Use Info Percent of long-stay residents who received an antipsychotic medication 0.0%
100% better than California average

California average: 10.1%

Pneumococcal Vaccine Info Percent of long-stay residents assessed and appropriately given the pneumococcal vaccine 100.0%
In line with California average

California average: 98.5%

Influenza Vaccine Info Percent of long-stay residents assessed and appropriately given the seasonal influenza vaccine 100.0%
In line with California average

California average: 98.2%

Hospitalizations per 1,000 days Info Number of hospitalizations per 1,000 long-stay resident days. 1.10
51% better than California average

California average: 2.25

ED visits per 1,000 days Info Number of outpatient emergency department visits per 1,000 long-stay resident days. 0.70
56% better than California average

California average: 1.59

Short-stay resident measures
Below average California avg: 3.5 Info CMS star rating based on short-stay quality measure performance. 5 stars = much above average, 1 star = much below average.
Pneumococcal Vaccine Info Percent of short-stay residents assessed and appropriately given the pneumococcal vaccine 100.0%
6% better than California average

California average: 94.0%

Antipsychotic medication increase Info Percent of short-stay residents who newly received an antipsychotic medication 0.0%
100% better than California average

California average: 1.5%

Influenza Vaccine Info Percent of short-stay residents assessed and appropriately given the seasonal influenza vaccine 100.0%
7% better than California average

California average: 93.2%

Re-hospitalized after SNF stay Info Percentage of short-stay residents who were re-hospitalized after their nursing home admission. 28.2%
22% worse than California average

California average: 23.2%

Emergency department visits Info Percentage of short-stay residents who had an outpatient emergency department visit. 10.8%
In line with California average

California average: 11.2%

Falls with major injury Info Percentage of SNF residents who experience falls with major injury during their stay. 0.0%
100% better than California average

California average: 0.8%

Ability to care for self at discharge Info Percentage of residents at or above expected ability to care for themselves at discharge. 47.6%
11% worse than California average

California average: 53.7%

Successful return to home or community Info Rate of successful return to home or community from a skilled nursing facility. 38.0%
25% worse than California average

California average: 50.6%

Penalties and fines

Federal penalties imposed by CMS for regulatory violations, including civil money penalties (fines) and denials of payment for new Medicare/Medicaid admissions.

Source: CMS Penalties Database (Data as of Jan 2026)

Total fines amount $3K
94% lower than California average

California average: $55K

Number of fines 1
58% fewer fines than California average

California average: 2.4

Payment Denials Info Serious action where Medicare and/or Medicaid temporarily stops payments for new residents until issues are fixed. 0
100% fewer payment denials than California average

California average: 0.5

Fines amount comparison
This facility $3K
California average $55K
Penalty History

Penalties are imposed by CMS for violations of federal nursing home regulations.

Civil Money Penalty Info Fines imposed for noncompliance, which can be assessed per day or per instance of violation. Jan 11, 2023
$3K

Last updated: Jan 2026

Guides for Better Senior Living

Care Cost Calculator: See Prices in Your Area

Nursing Home Data Explorer

Don’t Wait Too Long: 7 Red Flag Signs Your Parent Needs Assisted Living Now

The True Cost of Assisted Living in 2025 – And How Families Are Paying For It

Understanding Senior Living Costs: Pricing Models, Discounts & Financial Assistance

Financial Aid for California Seniors

Get financial aid guidance

Multipurpose Senior Services Program

MSSP (Medi-Cal Waiver)

Age 65+, California resident, Medi-Cal eligible, nursing home risk.

~$2,829/month (300% FBR, individual).

$2,000 (individual), $3,000 (couple).

County-managed; waitlists possible.

In-Home Supportive Services (IHSS)

California IHSS

Age 65+, California resident, Medicaid-eligible or low-income.

~$1,732/month (individual, Medi-Cal threshold).

$2,000 (individual).

Can hire family as caregivers.

Multipurpose Senior Services Program (MSSP)

CA MSSP

Age 65+, California resident, Medi-Cal-eligible, nursing home-eligible but community-capable.

~$2,829/month (300% FBR, individual).

$2,000 (individual).

Available in 38 counties; waitlists common.

Property Tax Postponement Program (PTP)

CA PTP

Age 62+, California resident, own and live in home, 40% equity.

~$51,500/year (household, adjusted annually).

Equity-based; no strict asset cap.

Deferred taxes accrue interest (5% as of 2024); repaid upon sale/death.

Assisted Living Waiver (ALW)

CA ALW

Age 65+ or disabled, California resident, Medi-Cal-eligible, nursing home-eligible.

~$2,829/month (300% FBR, individual).

$2,000 (individual).

Available in 15 counties (e.g., LA, Sacramento); waitlists common.

California CARES Program

CA CARES

Caregivers of California residents 60+ needing help with 3+ daily activities; no caregiver age limit.

No strict limit; cost-sharing above ~$2,500/month threshold.

Not applicable; need-based.

High demand in urban areas; complements IHSS respite.

Low-Income Home Energy Assistance Program (LIHEAP)

CA LIHEAP

Age 60+ priority, California resident, low-income, utility/heating need.

~$2,510/month (200% of poverty level, individual).

Not applicable; income-focused.

High demand in inland/coastal extremes; weatherization capped at $5,000/home.